Printable Version of Topic
Click here to view this topic in its original format
InstaForex | Forex Forum | Forex world | InstaForex Forum _ Traders' discussions _ AceTraderfx : DAILY TECHNICAL OUTLOOK ON Majors
Posted by: acetraderforex Aug 23, 2013, 08:13 AM
 DAILY TECHNICAL OUTLOOK ON GBP/USD
23 Aug 2013 00:08GMT
Trend Daily Chart: Sideways
Daily Indicators: Rising
21 HR EMA: 1.5597
55 HR EMA: 1.56620
Trend Hourly Chart: Near term down
Hourly Indicators: Falling
13 HR RSI: 47
14 HR DMI: -ve
Daily Analysis: Consolidation with downside bias
Resistance
1.5753 - Jun 17 high
1.5718 - Wed's high
1.5666 - Wed's NY res
Support
1.5563 - Y'day's low
1.5520 - Last Thur's NY low
1.5496 - Last Thur's Australian low
. GBP/USD - 1.5600 ... The British pound ratcheted lower in Asia n Europe y'day n cable dropped to an intra-day low of 1.5563 on dlr's broad-based strength, however, the pound rebounded briefly to 1.5614 on short-covering after the release of worse-than-expected U.S. jobless claims data b4 trading sideways.
. As mentioned in our previous update, the reversal fm Wed's high at 1.5718 signals recent erratic upmove fm Jul's 3-year low at 1.4814 has formed a temp. top there n as hourly technical indicators are still declining, suggesting a much-needed correction has taken place n as long as 1.5666 (Wed's NY res) holds, choppy consolidation with downside bias remains for further weakness twds 1.5520 sup (last Thur's NY low) but anticipated low readings on hourly oscillators shud limit downside to 1.5483 (38.2% r of 1.5102-1.5718) n yield rebound later.
. Today, selling cable again on intra-day recovery in anticipation of further weakness is favoured n only a breach of 1.5666 res wud signal the pullback is over instead n yield resumption of aforesaid upmove fm 1.4814 to 1.5718, abv wud encourage for re-test of key daily res at 1.5753 (Jun). 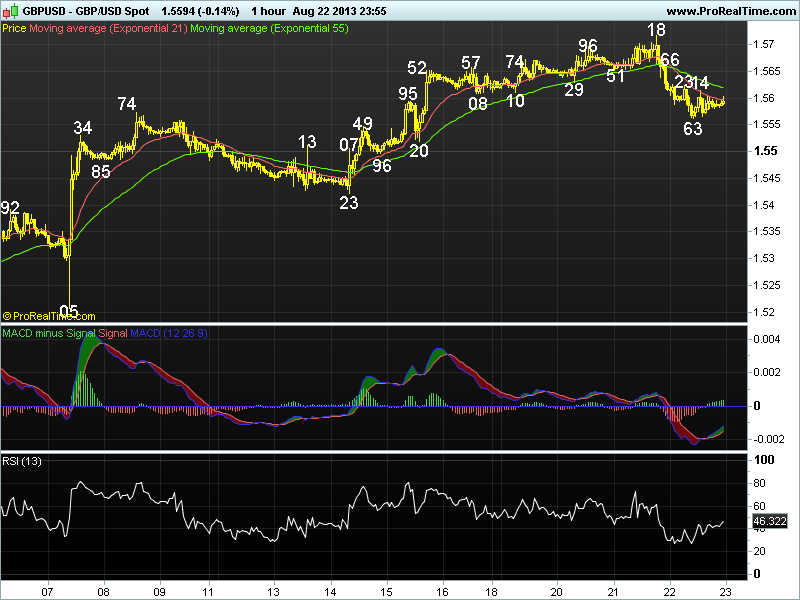
Posted by: acetraderforex Aug 28, 2013, 04:01 AM
DAILY TECHNICAL OUTLOOK ON GBP/USD
28 Aug 2013 01:00GMT
Trend Daily Chart: Sideways
Daily Indicators: Turning down
21 HR EMA: 1.5543
55 HR EMA: 1.5558
Trend Hourly Chart: Sideways
Hourly Indicators: Turning up
13 HR RSI: 46
14 HR DMI: +ve
Daily Analysis: Consolidation with upside bias
Resistance
1.5696 - Last Tue's high
1.5638 - Last Fri's high
1.5592 - Y'day's high
Support
1.5482 - Y'day's low
1.5423 -Last Wed's low
1.5392 - Aug 06 high
. GBP/USD - 1.5538 ... Although the pound traded sideways in Asia on Tue, traders gave sterling a broad-based bashing at European open, price easily penetrated last Fir's low 1.5538 n tumbled to 1.5482 at NY open, dlr's renewed weakness due partly to escalation of Middle East tension lifted cable to 1.5556 .
. Cable's rebound fm 1.5582 signals decline fm last Wed's 2-month peak at 1.5718 has made a temporary bottom there as this low was accompanied by 'bullish convergences' on the hourly oscillators n choppy consolidation is envisaged in next 1-2 days. Looking at the bigger picture, sterling's aforesaid retreat fm 1.5718 signals the 3-legged erratic rise fm Jul's 3-year trough at 1.4814 has possibly made a temporary top there n breach of 1.5423 sup wud add credence to this view, then further subsequent weakness to 1.5373 wud be seen, this is a 'minimum' 38.2% r of aforesaid upmove fm 1.4814.
. Today, expect initial sideways trading in Asia n as long as 1.5510/20 holds, upside bias remains for a retracement of the said decline fm 1.5718 twd 1.5612 but res 1.5638 wud cap upside. Below 1.5582 may risk 1.5423 b4 rebound. 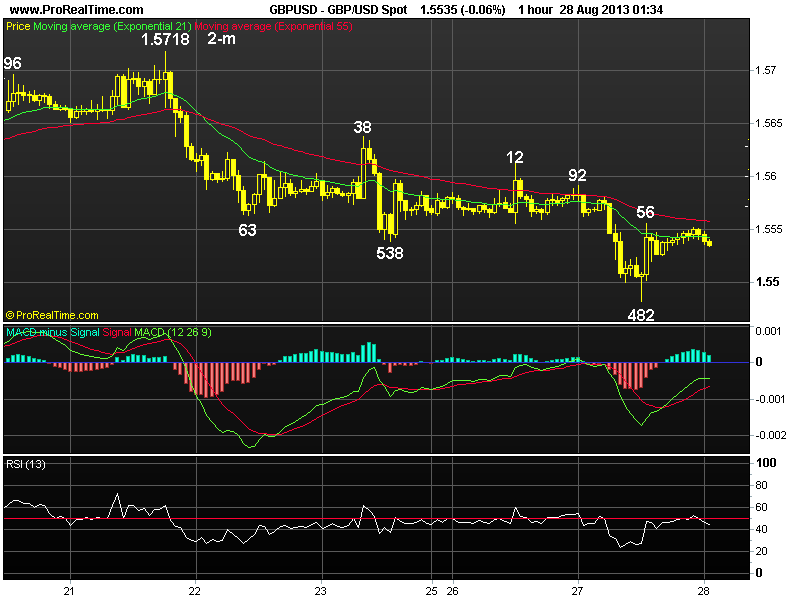
Posted by: acetraderforex Sep 2, 2013, 04:13 AM
 DAILY EUR/USD OUTLOOK - 1.3203
01 Sep 2013 23:14GMT
Despite euro's brief retreat to 1.3193 in Asian
morning, subsequent rebound suggests the pullback
fm Fri's NY res at 1.3224 has possibly ended n
consolidation abv Fri's low at 1.3173 wud continue
with upside bias for gain to 1.3230 n 1.3255.
For st trade, hold long with stop as indicated,
break wud abrt n risk weakness to 1.3173.
STRATEGY : Sell at 1.3240
OBJECTIVE : 1.3160
STOP-LOSS : 1.3280
RES : 1.3224/1.3255/1.3299
SUP : 1.3173/1.3154/1.3128
Posted by: acetraderforex Sep 6, 2013, 07:51 AM
AceTraderfx Sept 6: Daily Market Outlook on Majors EUR/USD DAILY EUR/USD OUTLOOK - 1.3131
06 Sep 2013 02:13GMT
Despite y'day's selloff to a fresh 6-week low at
1.3110 (NY), intra-day rebound suggests initial con
solidation wud be seen b4 decline fm Aug's peak at
1.3453 resumes twd 1.306, 'loss of momentum' shud
keep price abv 1.3015 n yield correction later.
Exit prev. short n sell again on further recovery
as only abv 1.3173 may risk retrace. twd 1.3223/27.
STRATEGY : Exit short n sell at 1.3150
POSITION : Short at 1.3180
OBJECTIVE : 1.3070
STOP-LOSS : 1.3190
RES : 1.3173/1.3223/1.3255
SUP : 1.3110/1.3066/1.3015
Posted by: acetraderforex Sep 9, 2013, 10:09 AM
AceTraderforex Sept 9 : WEEKLY TECHNICAL OUTLOOK ON GBP/USD WEEKLY TECHNICAL OUTLOOK ON GBP/USD
09 Sep 2013 02:00GMT
Trend Daily Chart: Sideways
Daily Indicators: Neutral
21 HR EMA: 1.5620
55 HR EMA: 1.5608
Trend Hourly Chart: Up
Hourly Indicators: Bearish divergences
13 HR RSI: 58
14 HR DMI: +ve
Daily Analysis: Consolidation with upside bias
Resistance
1.5753 - JUn 17 high
1.5718 - Augs' high (21)
1.5681 - Last Fri's high
Support
1.5564 - Last Fri's low
1.5522 - Last Tue's low
1.5462 - Aug 30 low
. GBP/USD - 1.5633... Trading cable proved to be tricky due to its daily large swings last week. Price ratcheted higher fm 1.5507 (Mon) to 1.5681 Fri on dlr's broad-based weakness after U.S. payrolls were less than market forecast.
. Looking at the daily chart, sterling's erratic rise fm 1.5427 signals early retreat fm Aug's peak at 1.5718, although strg, has ended there n abv said res wud extend upmove fm 2013 3-year trough at 1.4814 (Jul) to test chart obj. at 1.5753, abv wud encourage for gain to 1.5781, this is the 'natural' 50% r of the MT fall fm 1.6747 (2011 top), abv needed to extend aforesaid move to 1.5879, being 50% proj. of 1.4814 to 1.5718 measured fm 1.5427. Having said that, as the daily indicators wud display 'bearish divergences' on such move, reckon 1.5986 (61.8% proj. ) wud remain intact. On the downside, only below 1.5522 wud abort abv mildly bullish scenario n may yield re-test of 1.5427 later.
. Today, although sterling's retreat fm said Fri's 1.5681 high in NY sug- gests initial consolidation is in store in Asia, below 1.5564 needed to confirm temp. top is made n yield retrace. twd 1.5522 whilst abv 1.5681 risks 1.5718.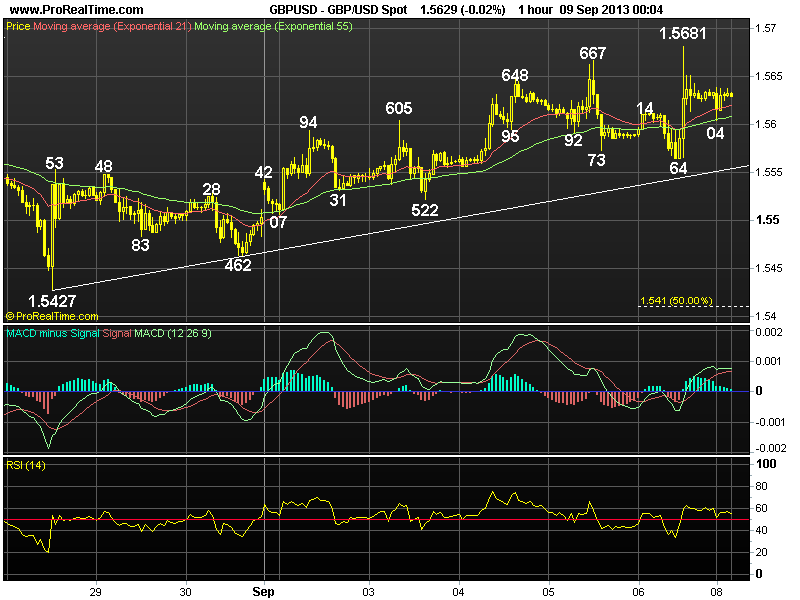
Posted by: acetraderforex Sep 13, 2013, 10:21 AM
AceTraderforex Sept 13, 2013 : DAILY USD/CHF OUTLOOK DAILY USD/CHF OUTLOOK - 0.9324
13 Sep 2013 07:10GMT
Although dlr has recovered after extending fall
fm last Thur's 6-week 0.9455 high to 0.9272 y'day,
as long as 0.9371 holds, aforesaid decline to re-
trace upmove fm Aug's low at 0.9147 shud resume n
extend marginally to 0.9265 (61.8% r).
Trade fm short side for this move with stop abv
0.9371, break risks gain to 0.9395 n 0.9420/30.
STRATEGY : Hold short
POSITION : Short at 0.9340
OBJECTIVE : 0.9270
STOP-LOSS : 0.9375
RES : 0.9335/0.9371/0.9395
SUP : 0.9272/0.9239/0.9206
Posted by: acetraderforex Sep 17, 2013, 08:34 AM
AceTraderForex Sept 17 : DAILY TECHNICAL OUTLOOK ON EUR/USD DAILY TECHNICAL OUTLOOK ON EUR/USD
17 Sep 2013 04:01GMT
Trend Daily Chart
Sideways
Daily Indicators
Neutral
21 HR EMA
1.3341
55 HR EMA
1.3328
Trend Hourly Chart
Sideways
Hourly Indicators
Turning down
13 HR RSI
47
14 HR DMI
0
Daily Analysis
Consolidation b4 upmove resumes
Resistance
1.3453 - Aug 20 high
1.3410 - Aug 23 high
1.3385 - Y'day's high
Support
1.3325 - Sep 11 high
1.3298 - Y'day's low
1.3254 - Last Fri's low
. EUR/USD - 1.3335 ... The single currency jumped to 1.3382 in NZ after WSJ reported that former U.S. Treasury Secretary Lawrence Summers withdrew his nomination for Chairman of the Federal Reserve, euro retreated briefly to 1.3340 b4 rising to 1.3385 but only to fall to 1.3330 near NY close.
. Looking at the hourly & daily charts, although euro's retreat fm y'day's
2-week high at 1.3385 suggests 1-2 days of consolidation wud be seen with initial downside bias, as early rally fm this month's low at 1.3105 signals the
correction fm Aug's 6-month high at 1.3453 has ended there, reckon pullback wud be ltd n as long as 1.3298 sup holds, bullishness remains for aforesaid upmove to resume n extend marginal gain twds 1.3410, however, as 'bearish divergences' wud appear on hourly oscillators on such move, suggesting key daily res at 1.3453 shud hold on 1st testing n yield retreat later.
. Today, buying euro on dips is still favoured in expectation of such rise. On the downside, only a breach of 1.3254 sup (last Fri's low) wud signal top is made n further 'gyration' inside 1.3105-1.3453 wud be seen with downside bias.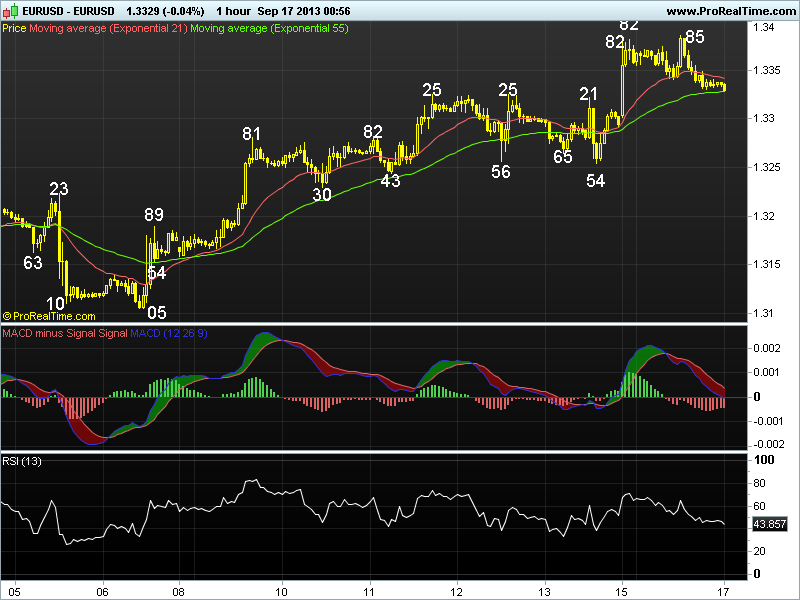
Posted by: acetraderforex Sep 18, 2013, 10:44 AM
AceTraderfx Sept 18 : DAILY TECHNICAL OUTLOOK ON USD/CHF DAILY TECHNICAL OUTLOOK ON USD/CHF
18 Sep 2013 00:11GMT
Trend Daily Chart
Sideways
Daily Indicators
Neutral
21 HR EMA
0.9263
55 HR EMA
0.9276
Trend Hourly Chart
Sideways
Hourly Indicators
Turning up
13 HR RSI
47
14 HR DMI
0
Daily Analysis
Consolidation b4 decline resumes
Resistance
0.9371 - Sep 11 high
0.9341 - Last Fri's high
0.9279 - Y'day's high
Support
0.9225 - Mon's NZ low
0.9171 - Aug 27 low
0.9147 - Aug 20 low
. USD/CHF - 0.9258.. Despite dlr's retreat after extending gain fm Mon's 2-
week low at 0.9225 to 0.9279 in Asia y'day, buying of eur/chf cross lifted price
fm 0.9253 in Europe but failure to penetrate said intra-day high prompted
another round of dlr selling in NY morning n price later dropped to 0.9257.
. Looking at the hourly chart, dlr's rebound fm 0.9225 to 0.9279 suggests
decline fm Aug's 0.9455 high has made a minor low there n another day of choppy
sideways trading abv said sup wud be seen, stronger gain twd 0.9298/01 cannot be
ruled out but as the selloff fm 0.9455 indicates correction fm Aug's low at
0.9147 has 'possibly' ended there earlier, suggesting bias for dlr remains to
the downside n measured res at 0.9313 (38.2% r of 0.9455-0.9225) shud hold n
yield decline later this week. A firm breach of 0.9225 wud extend weakness to
0.9171 (Aug 27 low) but as 'bullish converging signals' shud appear on hourly
oscillators on next decline, reckon 0.9147 low wud remain intact on 1st testing.
. In view of abv analysis, selling dlr on intra-day recovery in anticipa-
tion of another fall is still favoured. Only abv 0.9341 signals low, 0.9367/71. 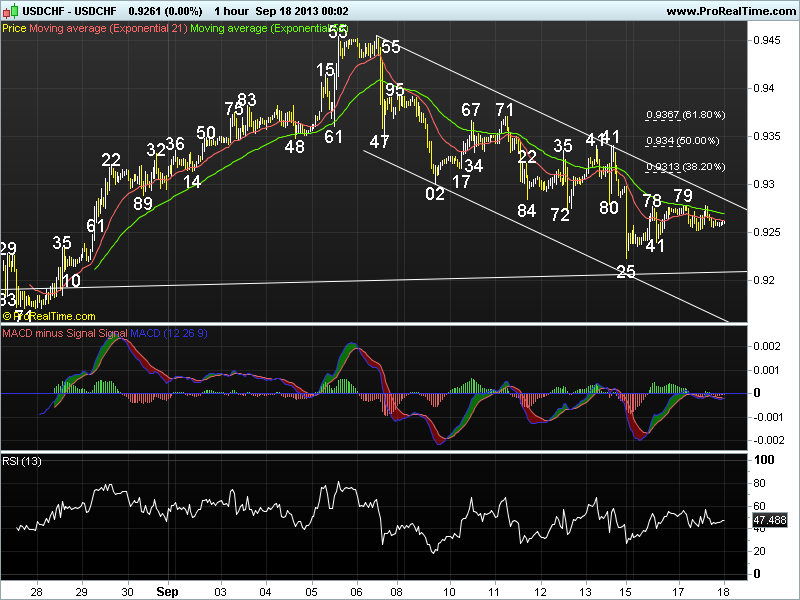
Posted by: acetraderforex Sep 24, 2013, 09:24 AM
AceTraderForex Sept 24 : Daily Market Outlook on Major GBP/USD DAILY GBP/USD OUTLOOK - 1.6029
24 Sep 2013 07:26GMT
Despite sterling's retreat fm 1.6073 to 1.6017 in NY y'day, below said sup needed to signal recovery fm 1.5986 (Fri) has ended n bring resumption of decline fm last Wed's 8-month peak at 1.6163 to 1.5958, 'loss of momentum' wud keep cable abv 1.5920/25.
Sell again on intra-day recovery as only abv 1.6100 indicates pullback is over, risks 1.6142/47.
STRATEGY : Sell at 1.6060
OBJECTIVE : 1.5965
STOP-LOSS : 1.6098
RES : 1.6073/1.6100/1.6163
SUP : 1.6017/1.5986/1.5958
Posted by: acetraderforex Sep 27, 2013, 09:17 AM
AceTraderForex Sept 27 : Daily Outlook on Major GBP/USD DAILY GBP/USD OUTLOOK - 1.6092
27 Sep 2013 07:04GMT
Cable's intra-day spike to 1.6133 after media
report of hawkish comments by BoE's Carney suggests
correction fm last Wed's 8-month peak at 1.6163 has
ended at 1.5955 n abv said res wud extend MT upmove
fm 1.4814 to 1.6188, then twd 1.6255 next week.
Hold long for 1.6160 1st n only below 1.6043 pro
longs choppy consolidation, risks 1.5999/04.
STRATEGY : Hold long
POSITION : Long at 1.6090
OBJECTIVE : 1.6160
STOP-LOSS : 1.6055
RES : 1.6163/1.6188/1.6255
SUP : 1.6043/1.5999/1.5955
Posted by: acetraderforex Oct 3, 2013, 06:05 AM
 AceTraderFx Oct 3: Forex Market Outlook on Majors GBP/USD MEDIUM TERM OUTLOOK on GBP/USD - 1.6175
02 Oct 2013 04:19GMT
Cable's rally abv 1.5753 (Jun) to a fresh 9-month high at 1.6260 confirms MT uptrend fm this year's low at 1.4814 (Apr) has resumed n further gain to 1.6380 res (Jan) is likely, abv wud extend to 1.6500 but 1.6747 res wud hold fm here.
Only below 1.5955 wud signal a temporary top is made n risk stronger retrace- ment to 1.5753 (prev. res, now sup) b4 rebound.
Posted by: acetraderforex Oct 4, 2013, 08:45 AM
AceTraderFx Oct 4 : Daily market outlook on EUR/USD DAILY MARKET OUTLOOK : EUR/USD - 1.3625
04 Oct 2013 00:53 GMT
Yesterday's rise to a fresh near 8-month high at 1.3646 suggests medium term rise from April's low at 1.2745 would extend towards 1.3657/60 after initial consolidation, however, near term loss of momentum would prevent strong rise above there and reckon resistance at 1.3711 would limit upside and bring a much-needed correction later.
On the downside, only below 1.3577 would indicate a temporary top has been made and risk would shift to the downside for a retracement to 1.3505.
Posted by: acetraderforex Oct 7, 2013, 09:38 AM
AceTraderFx Oct 7: Daily Market Outlook on EUR/USD DAILY MARKET OUTLOOK on EUR/USD - 1.3565
07 Oct 2013 00:38 GMT
Euro's strong retreat from last Wednesday's near 8-month high at 1.3646 to 1.3538 on Friday suggests medium-term uptrend has made a temporary top over there and consolidation with downside bias would be seen for a stronger retracement to 1.3505 but good support at 1.3462 would remain intact and yield rebound later.
On the upside, only above 1.3607 would indicate aforesaid pullback has ended and yield re-test of said high, break extends rise to 1.3679/80.
Posted by: acetraderforex Oct 7, 2013, 10:13 AM
AceTraderFx Oct 7 : Daily outlook on Asian Exotic – USD/IDR USD/IDR DAILY OUTLOOK - 11530
07 Oct 2013 07:52GMT
Although usd has retreated fm last Mon's peak at
11660 n consolidation is seen, as long as sup 11505
holds, upside bias remains to re-test said res.
Hold long with stop as indicated, below wud
risk stronger retracement twd 11455 n 11430.
STRATEGY : Long at 11520
POSITION : Long at 11520
OBJECTIVE : 11610
STOP-LOSS : 11480
RES : 11660/11700/11750
SUP : 11505/11455/11430
Posted by: acetraderforex Oct 8, 2013, 08:47 AM
AceTraderFx Oct 8 : Daily Outlook on EUR/USD DAILY MARKET OUTLOOK EUR/USD - 1.3565
08 Oct 2013 06:58 GMT
Although y'day's rebound fm 1.3543 to 1.3585 sug
gests euro's 'choppy' trading abv last Fri's low at
1.3538 wud continue, as long as 1.3607 res holds,
corrective fall fm last Thur's 8-mth peak at 1.3646
wud extend to 1.3500 but 1.3462 shud remain intact.
Hold short for this move with stop abv 1.3607,
break may risk re-test of 1.3646, then 1.3660.
STRATEGY : Hold short
POSITION : Short at 1.3580
OBJECTIVE : 1.3500
STOP-LOSS : 1.3610
RES : 1.3591/1.3607/1.3646
SUP : 1.3538/1.3505/1.3462
Posted by: acetraderforex Oct 10, 2013, 08:56 AM
AceTraderFx Oct 10: DAILY TECHNICAL OUTLOOK ON GBP/USD DAILY TECHNICAL OUTLOOK ON GBP/USD
10 Oct 2013 03:18GMT
Trend Daily Chart : Sideways
Daily Indicators : Turning down
21 HR EMA :1.5977
55 HR EMA :1.6023
Trend Hourly Chart : Down
Hourly Indicators : Rising fm o/s
13 HR RSI : 37
14 HR DMI : -ve
Daily Analysis : Consolidation b4 one more fall
Resistance
1.6070 - Tue's NY low
1.6006 Last Fri's low
1.5968 - Y'day NY res
Support
1.5916 - Y'day's low
1.5886 - Sep 17 low
1.5844 - 50% r of 1.5427-1.6260
. GBP/USD - 1.5960..Cable's traded wildly initially y'day as news of nomin-
ation of Fed Vice Chair Yellen as next Fed Chief led to a bout of dlr-buying in
Aust., price bounced to 1.6122 but quickly fell in Asia. Intra-day fall accele-
rated after weaker-than-expected U.K. prod. data n cable tanked to 1.5916 in NY.
. Y'day's selloff to 1.5916 has justified our weekly bearish view that MT
rise fm Jul's 3-year low at 1.4814 has made a top last week at 1.6260 (Tue) n as
indicated in previous update, cable's aforesaid fall fm 1.6260 is at least cor-
recing MT intermediate rise fm 1.5427, since price has already reached the 'mini
mum' 38.2% r obj. at 1.5942, next downside target is pointing at the 'natural'
50% r obj. at 1.5844, a daily close below there wud turn outlook even more bear-
ish for further selloff to 1.5708 (38.2% r of 1.4814-1.6260).
. Today, the o/n rebound fm y'day's post-FOMC low at 1.5916 suggests the
pound wud gain some respite in Asia n range trading is in store, as price is tra
ding below the 21-hr & 55-hr emas, downside bias remains for decline fm 1.6260
to extend twd next chart obj. at 1.5886 but 1.5844 shud remain intact. 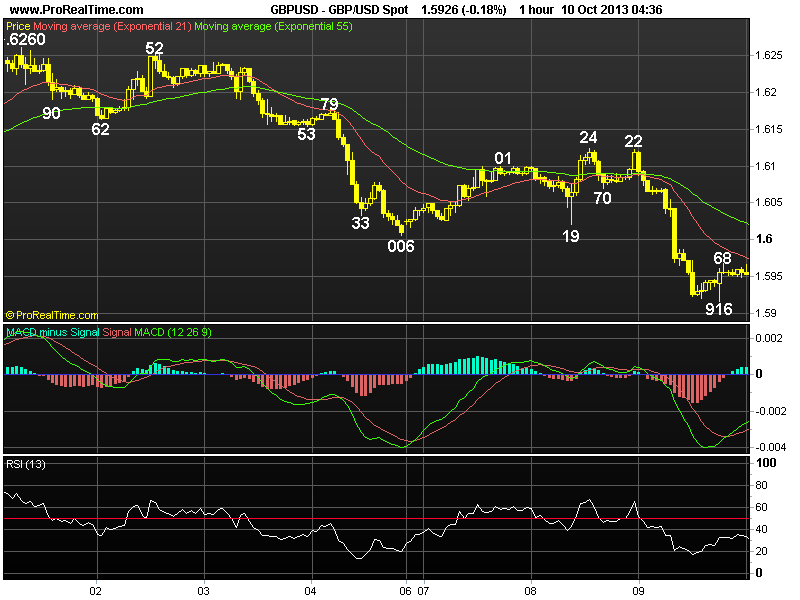
Posted by: acetraderforex Oct 15, 2013, 10:34 AM
AceTraderFx Octr 15 : DAILY TECHNICAL OUTLOOK ON GBP/USD DAILY TECHNICAL OUTLOOK ON GBP/USD
15 Oct 2013 00:51GMT
Trend Daily Chart :Sideways
Daily Indicators :Turning down
21 HR EMA :1.5982
55 HR EMA :1.5980
Trend Hourly Chart :Sideways
Hourly Indicators :Neutral
13 HR RSI :41
14 HR DMI :-ve
Daily Analysis : Consolidation b4 one more fall
Resistance
1.6070 - Last Tue's NY low
1.6046 - 38.2% r of 1.6260-1.5914
1.6018 - Y'day's high
Support
1.5914 - Last Thur's low
1.5886 - Sep 17 low
1.5844 - 50% r of 1.5427-1.6260
. GBP/USD - 1.5968 ... Trading cable proved to be tricky y'day as despite
initial weakness to 1.5955 in European morning, renewed buying lifted the pair n
to a session high at 1.6018 in NY morning. However, the British pound pared its
gains and dropped to 1.5979 in NY afternoon n then 1.5966 ahead of Asian open.
. Despite y'day's rebound to 1.6018, as mentioned in previous updates,
cable's early fall below 1.6006 sup (now res) to 1.5914 last Thur suggests MT
rise fm Jul's 3-year low at 1.4814 has made a top at 1.6260 n as long as 1.6046
(38.2% r of 1.6260-1.5914) holds, downside bias remains for said fall fm 1.6260
to at least correct the MT intermediate upmove fm 1.5427 n yield weakness to 50%
r target at 1.5844, a daily close below there wud retain bearish scenario for
further losses twd 1.5708 (38.2% r of 1.4814-1.6260). On the upside, abv 1.6046
res wud abort bearishness n risk stronger gain to 1.6076 (last Tue's NY low) but
res at 1.6122/24 shud remain intact.
. Today, in view of aforementioned bearish scenario, selling cable on intra-
day recovery for a re-test of sup 1.5914 is favoured. .png)
Posted by: acetraderforex Oct 17, 2013, 08:36 AM
AceTraderFx Oct 17 : DAILY TECHNICAL OUTLOOK ON USD/CHF DAILY TECHNICAL OUTLOOK ON USD/CHF
17 Oct 2013 00:21GMT
Trend Daily Chart : Down
Daily Indicators : Falling
21 HR EMA : 0.9137
55 HR EMA : 0.9129
Trend Hourly Chart : Sideways
Hourly Indicators : Neutral
13 HR RSI : 53
14 HR DMI : 0
Daily Analysis : Choppy trading to continue
Resistance
0.9279 - Sep 17 high
0.9225 - Sep 15 low, now res
0.9178 - Tue's high
Support
0.9093 - Tue's low
0.9064 - Mon's low
0.9016 - Last Mon's n Tue's low
USD/CHF - 0.9140 ... U.S. dollar went through a 'roller-coaster' session
y'day. Despite Tue's rally to a fresh 4-week high at 0.9178, price retreated to
0.9118 in Australian morning y'day n then 0.9098 in NY morning due to U.S. debt
deadlock b4 rebounding to 0.9175 after U.S. Senate reached a bipartisan deal.
. Looking at the hourly n daily charts, as mentioned in our previous
updates, dlr's firmness suggests erratic upmove fm Oct's 19-month low at 0.8968
to at least retrace MT intermediate downtrend fm 0.9455 (Sep's high) remains in
progress n as long as Mon's low at 0.9064 holds, mild upside bias remains for
further gain to 0.9212, (being 50% r of 0.9455-0.8968), however, anticipated
high readings on hourly oscillators wud prevent strg gain abv 0.9225 (Sep 15
low, now res) n reckon 0.9269 (61.8% r) shud cap upside n yield retreat later.
. Today, we're standing aside in the meantime n wud look to buy dlr on dips
as only a breach of 0.9064 sup wud violate recent series of higher lows n higher
highs fm 0.8968 n signal aforesaid corrective rise has made a top there n yield
weakness twds 0.9016 sup (last Mon's n Tue's low).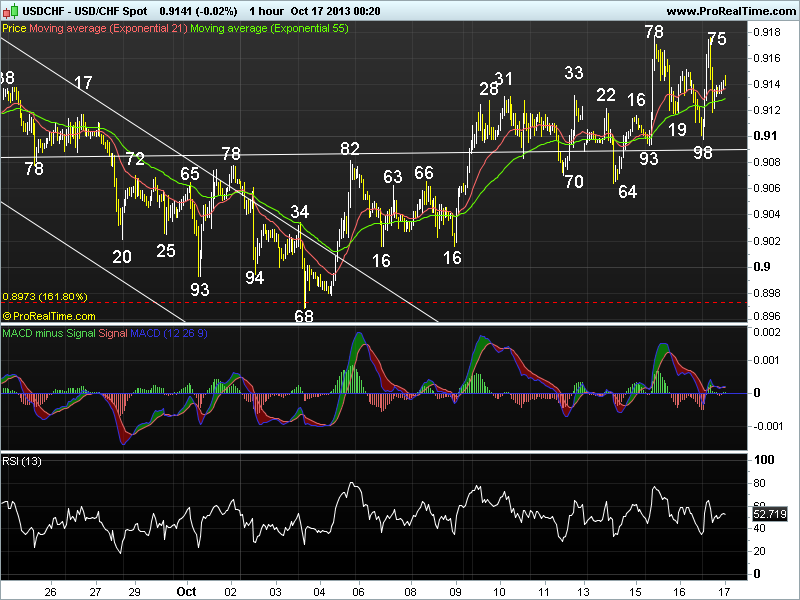
Posted by: acetraderforex Oct 24, 2013, 09:20 AM
AceTraderFx Oct 24 : DAILY TECHNICAL OUTLOOK ON GBP/USD DAILY TECHNICAL OUTLOOK ON GBP/USD
24 Oct 2013 01:03GMT
Trend Daily Chart : Up
Daily Indicators : Neutral
21 HR EMA : 1.6172
55 HR EMA : 1.6172
Trend Hourly Chart : Sideways
Hourly Indicators : Rising fm o/s
13 HR RSI : 43
14 HR DMI : -ve
Daily Analysis : Consolidation b4 marginal fall
Resistance
1.6260 - 01 Oct high
1.6225 - Last Fri's high
1.6181 - Mon's high
Support
1.6119 - Y'day's low
1.6064 - Last Wed's high, now sup
1.6010 - Last Tue's high, now sup
. GBP/USD - 1.6195... Despite edging higher to 1.6258 in Asian morning on
Wed, failure to penetrate Oct's 1.6260 top triggered profit-taking. Cable tanked
in early European morning b4 extending fall to session low of 1.6119 after MPC
minutes. The pound later pared its losses n rebounded to 1.6176 in NY afternoon.
. Looking at the hourly n daily charts, as y'day's rise to 1.6258 was accom-
panied by bearish divergences on the hourly indicators, subsequent selloff to
1.6119, which also happened to be the minimum 38.2% r of 1.5894-1.6258 suggests
price wud consolidate below Oct's 1.6260 top n choppy trading with downside bias
remains. However, as mentioned in our previous update, cable's rally fm 1.5894
signals upmove fm Jul's 3-year trough at 1.4814 has resumed n abv 1.6260 wud
extend to 1.6310/11 (Sep 2012 peak n 50% proj. of 1.5427-1.6260 measured fm
1.5894 respectively) but price wud hold well below 2013 peak at 1.6380.
. Today, we are holding a short position in anticipation of weakness to
1.6100 but 1.6076 (50% r of 1.5894-1.6258) shud hold. Only a daily close abv
1.6225 wud confirm correction fm 1.6258 is over, yields 1.6258/60. .png)
Posted by: acetraderforex Oct 25, 2013, 08:58 AM
AceTraderFx Oct 25 : DAILY TECHNICAL OUTLOOK ON GBP/USD DAILY TECHNICAL OUTLOOK ON GBP/USD
25 Oct 2013 00:47GMT
Trend Daily Chart : Up
Daily Indicators : Neutral
21 HR EMA : 1.6189
55 HR EMA : 1.6182
Trend Hourly Chart : Sideways
Hourly Indicators : Neutral
13 HR RSI : 55
14 HR DMI : -ve
Daily Analysis : Consolidation b4 marginal fall
Resistance
1.6310 - Sep 21 2012 high
1.6260 - 01 Oct high
1.6223 - Y'day's high
Support
1.6119 - Y'day's low
1.6064 - Last Wed's high, now sup
1.6010 - Last Tue's high, now sup
. GBP/USD - 1.6187... The British pound proved to be a little tricky to trade
y'day as despite initial bounce to 1.6223 in European morning, price retreated
sharply to 1.6138 at NY open. However, cable pared its losses n staged a strg
recovery to 1.6213 in NY afternoon b4 falling again at Asian open.
. Y'day's choppy trading suggests price wud be confined inside nr term range
of 1.6119-1.6258 for today n consolidation with mild downside bias wud be seen
but said lower lvl wud hold. Looking at the bigger picture, as mentioned in our
previous update, cable's rally fm 1.5894 to 1.6258 on Wed signals upmove fm
Jul's 3-year trough at 1.4814 wud resume soon n abv Oct's peak at 1.6260 wud
extend gain to 1.6310/11 (Sep 2012 peak n 50% proj. of 1.5427-1.6260 measured fm
1.5894 respectively) next week/early Nov but price wud hold well below 2013 peak
at 1.6380 due to loss of momentum.
. Today, we are holding a short position in anticipation of a re-test of
y'day's low at 1.6138 but sup at 1.6116/19 shud hold n yield rebound. Only a
daily close abv 1.6223 wud abort near term bearish bias on the pound. .png)
Posted by: acetraderforex Oct 28, 2013, 10:38 AM
AceTraderFx Oct 28 : WEEKLY TECHNICAL OUTLOOK ON USD/JPY WEEKLY TECHNICAL OUTLOOK ON USD/JPY
27 Oct 2013 23:44GMT
Trend Daily Chart : Sideways
Daily Indicators : Turning down
21 HR EMA : 97.41
55 HR EMA : 97.42
Trend Hourly Chart : Sideways
Hourly Indicators : Rising
13 HR RSI : 56
14 HR DMI : +ve
Daily Analysis : Choppy trading to continue
Resistance
98.19 - Last Wed's high
97.86 - Last Wed's NY low. now res
97.78 - Intra-day high in Aust.
Support
97.15 - Last Wed's low
96.94 - Last Fri's low
96.55 - Oct 07 low
. USD/JPY - 97.51 ... Despite initial cross-inspired recovery to 98.48 on
Tue due to rebound in the N225, sudden spike in Chinese short-term rates spoofed investors n caused a slide in the N225, traders bot yen broadly as safe-haven currency, pushing the pair to a 2-week low of 96.94 Fri b4 staging a recovery.
. Let's look at the bigger picture 1st, dlr's recent broad sideways move is
set to continue for rest of this week as price wud remain confined recent established range of 95.81-100.62 n only a daily close abv or below either side wud signal a major 'breakout' has taken place, so until then, one shud not too excited when price is approaching twd the upper or lower level of aforesaid range. On the downside, below 95.81 wud be 1st signal downside break has occured n test of 93.75 (reaction fm 2013 4-1/2 year peak at 103.74) wud follow in Nov/Dec. Only abv 99.01 wud shift risk to upside n yield subsequent rebound twd 100.62.
. Today, intra-day gap-up open to 97.78 in Aust. suggests decline fm 99.01 has made a low n 1-2 days of consolidation is seen with upside bias but 98.22 (61.8% r) shud cap present rise n yield another fall later. 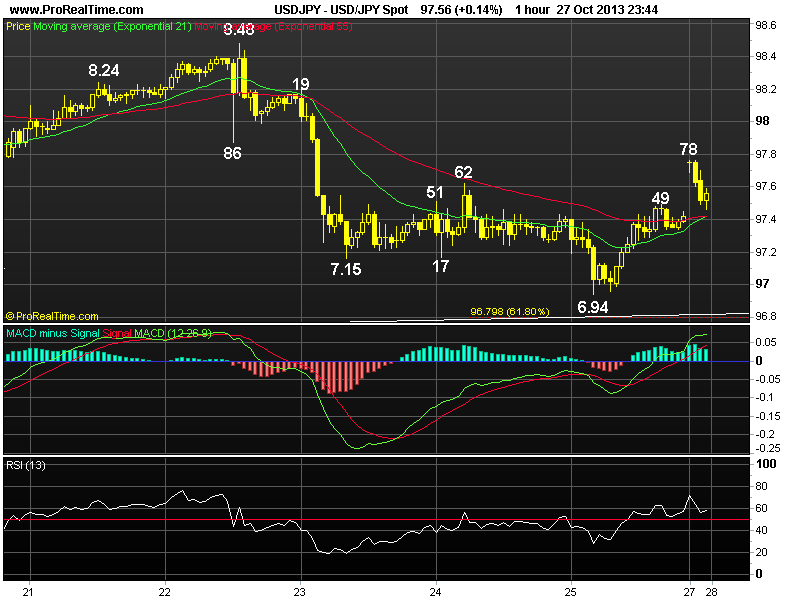
Posted by: acetraderforex Oct 30, 2013, 10:17 AM
AceTraderFx Oct 30 : DAILY TECHNICAL OUTLOOK ON EUR/USD
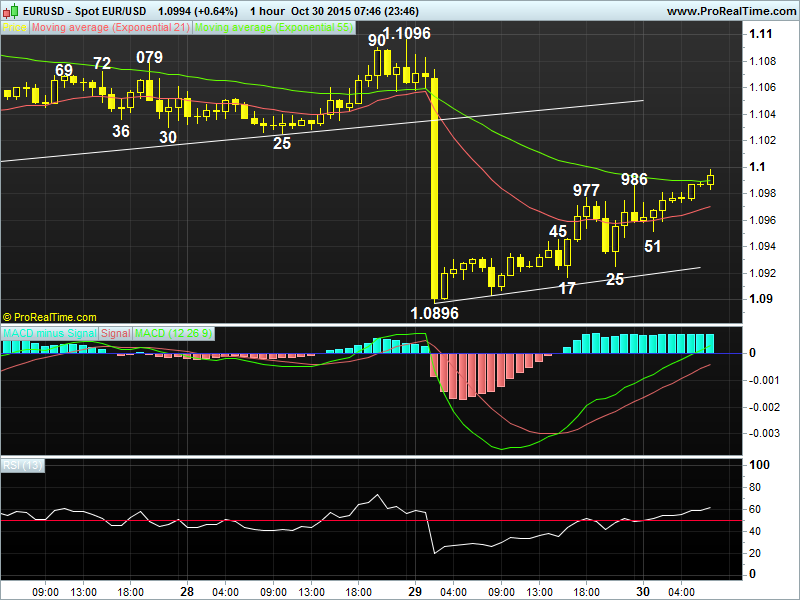
DAILY TECHNICAL OUTLOOK ON EUR/USD
30 Oct 2013 00:16GMT
Trend Daily Chart : Up
Daily Indicators : Overbought
21 HR EMA : 1.3758
55 HR EMA : 1.3774
Trend Hourly Chart :Near term down
Hourly Indicators : Oversold
13 HR RSI : 36
14 HR DMI : -ve
Daily Analysis : Consolidation with downside bias
Resistance
1.3883 - 100% proj. of 1.3472-1.3704 fm 1.3651
1.3833 - Last Fri's near 2-year high
1.3813 - Y'day's high
Support
1.3736 - Y'day's low
1.3711 - Feb 01 high
1.3651 - Oct 21 low
. EUR/USD - 1.3735 ... The single currency ratcheted lower in Asia n Europe y'day n price weakened to 1.3754 near NY open b4 rebounding swiftly but sharply to 1.3813 in NY morning after euro-positive comments fm ECB's Nowotny, then fall to session low at 1.3736 b4 trading sideways.
. Y'day's firm break of previous 1.3741 sup to 1.3736 suggests MT upmove fm 1.2042 (2012 trough) has possibly made a temporary top at 1.3833 (exactly 61.8% r of 1.4940-1.2042) last Fri n as price is currently trading below 21-hr n 55-hr emas (now at 1.3758 n 1.3774 respectively), suggesting as long as res at 1.3813 (y'day's high) holds, consolidation with downside bias remains for weakness to 1.3704/11 (Oct 18 high n Feb high resp.), however, low readings on the hourly oscillators shud keep price abv 1.3651/53 (being Oct 21 low n 50% r of intermediate rise fm 1.3472-1.3833 resp.).
. Today, selling on intra-day recovery in anticipation of a stronger cor-
rection to 1.3695 is favoured. Only abv 1.3833 wud confirm MT uptrend has once again resumed n extend twd 1.3883 (100% proj. of 1.3472-1.3704 fm 1.3651).
Posted by: acetraderforex Nov 1, 2013, 09:51 AM
AceTraderFx Nov 1 : DAILY TECHNICAL OUTLOOK ON GBP/USD DAILY TECHNICAL OUTLOOK ON GBP/USD
01 Nov 2013 01:34GMT
Trend Daily Chart Sideways
Daily Indicators Turning down
21 HR EMA 1.6041
55 HR EMA 1.6053
Trend Hourly Chart Near term down
Hourly Indicators Neutral
13 HR RSI 49
14 HR DMI -ve
Daily Analysis Consolidation with downside bias
Resistance
1.6165 - Hourly res, Oct 28
1.6119 - Last Wed's low, now res
1.6079 - Y'day's high
Support
1.5999 - Y'day's low
1.5940 - Oct 17 low
1.5894 - Oct 16 low
. GBP/USD - 1.6025... Despite initial weakness to 1.6006 ahead of European opening, failure to penetrate Wed's low at 1.5999 prompted active short-covering n price rebounded to 1.6070 due to cross-buying of gbp vs eur in NY morning. However, renewed selling interest pushed cable back down to 1.6031 nr NY close.
. The outlook remains pretty much the same as our prev. update. Looking at the daily n hourly charts, this week's selloff to 1.5999 (Wed) suggests near
term rise fm 1.5894 (Oct 16 low) has ended at 1.6258 last Wed n consolidation below Oct's near 9-month high at 1.6260 wud continue with downside bias. The price action fm 1.6260 cud also be unfolding into a triangle (a-leg at 1.5894, b-leg 1.6258 n present decline is the c-leg), if this view holds true, then then 2-3 more weeks of choppy sideways trading is in store.
. Today, in view of abovementioned scenario, we are holding short for weakness to 1.5975, however, 1.5964 (80.9% r of 1.4894-1.6258) wud hold n yield recovery. On the upside, only abv 1.6119 wud abort bearishness on the pound n risk stronger gain to 1.6165 next week.
*** T.G.I.F. *** .png)
Posted by: acetraderforex Nov 4, 2013, 10:29 AM
AceTraderFx Nov 4: Weekly Technical Outlook on GBP/USD WEEKLY TECHNICAL OUTLOOK ON GBP/USD
03 Nov 2013 23:53GMT
Trend Daily Chart: Sideways
Daily Indicators: Turning down
21 HR EMA :1.5955
55 HR EMA : 1.5998
Trend Hourly Chart : Near term down
Hourly Indicators : Rising fm o/s
13 HR RSI : 27
14 HR DMI : -ve
Daily Analysis : Consolidation with downside bias
Resistance
1.6040 - Last Fri's European high
1.5999 - Last Wed's low
1.5953 - Last Fri's European low
Support
1.5894 - Oct's low (16th)
1.5818 - 38.2% r of 1.5102-1.6260
1.5753 - -Jun 17 high
. GBP/USD - 1.5923 ... Although cable also fell in tandem with eur/usd last week, active selling of eur/gbp cross limited sterling's downside some what, price weakened to a fresh 2-week low of 1.5908 on Fri.
. Looking at the daily chart, despite the recent volatile broad sideways
move inside recent 1.5894-1.6260 range, anticipated selloff in the euro suggests cable wud also come under selling pressure in this week, a breach of 1.5894 wud confirm MT rise fm 2013 3-year trough at 1.4814 (Jul) has indeed formed a top earlier at 1.6260 on the 1st day of Oct n correction of the intermediate rally fm 1.5102 wud knock the pound to 1.5818, being a 'minimum' 38.2% r, a daily close below there wud send price lower twd 1.5681 (50% r) later this month. In view of abv bearish scenario, selling cable on recovery is favoured n only a daily close abv 1.6079 wud prolong consolidation, risk 1.6119/24.
. Today, expect initial sideways trading in Asia as Tokyo market is closed
n reckon 1.5953 wud cap intra-day recovery n yield test of said daily sup at
1.5894, break wud extend recent erratic fall to 1.5840/50. 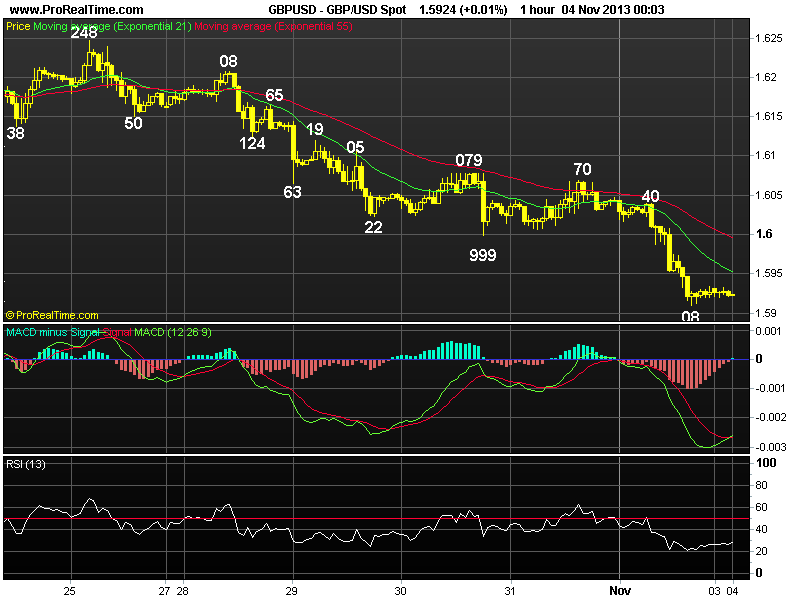
Posted by: acetraderforex Nov 5, 2013, 11:02 AM
AceTraderFx Nov 5 : Daily Technical Outlook on USD/CHF DAILY TECHNICAL OUTLOOK ON USD/CHF
05 Nov 2013 00:04GMT
Trend Daily Chart : Sideways
Daily Indicators :Turning up
21 HR EMA :0.9109
55 HR EMA :0.9085
Trend Hourly Chart : Sideways
Hourly Indicators : Neutral
13 HR RSI : 41
14 HR DMI : -ve
Daily Analysis :Consolidation b4 upmove resumes
Resistance
0.9225 - Sep 16 low
0.9178 - Oct 15 high
0.9152 - Y'day's Asian high
Support
0.9091 - Y'day's NY low
0.9071 - Last Fri's European low
0.9024 -Last Thur's high
USD/CHF - 0.9100 ... The pair also extended recent upmove fm Oct's 23-
month low at 0.8891 to a fresh 2-week high at 0.9152 y'day due to dlr's broad-based strength, however, active profit-taking capped dlr's upside n the pair ratcheted lower to a session low at 0.9091 near NY close.
. Despite y'day's brief rise to 0.9152, subsequent retreat suggests 1-2
days of consolidation wud be seen b4 upmove fm Oct's near 2-year trough of 0.88 91 to retrace MT downtrend to resume, abv 0.9152 wud bring further gain to 0.91 73/78, being 50% r of intermediate fall fm 0.9455-0.8891 n Oct 15 high respectively. Looking at the bigger picture, only a daily close abv 0.9178 res wud encourage for further gain to 0.9240 (61.8% r of 0.9455-0.8891) n possibly twd 0.9253, this is 38.2% r of intermediate decline fm 0.9839 (2013 top in May) n then twd 0.9365 (50% r).
. Today, buying on intra-day retreat in anticipation of subsequent upmove is favoured n only a breach of 0.9024 (Oct 30 high, now sup) wud signal temp. top is made n may risk stronger correction to 0.8991/93 n possibly 0.8952 sup. 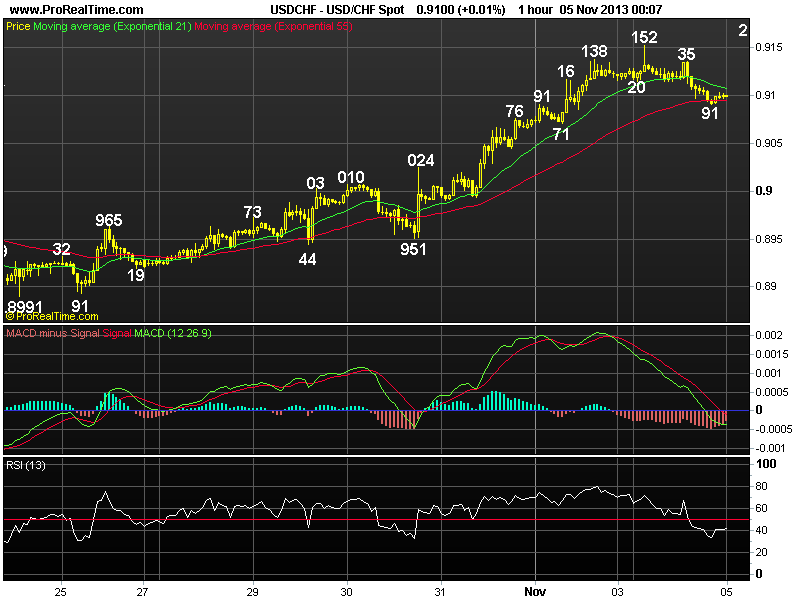
Posted by: acetraderforex Nov 8, 2013, 10:56 AM
AceTraderFx Nov 8 : Daily Technical Outlook on USD/CHF DAILY TECHNICAL OUTLOOK ON USD/CHF
08 Nov 2013 00:25GMT
Trend Daily Chart :Sideways
Daily Indicators : Rising up
21 HR EMA : 0.9157
55 HR EMA : 0.9139
Trend Hourly Chart : Up
Hourly Indicators : Falling fm o/bot
13 HR RSI : 56
14 HR DMI : +ve
Daily Analysis : Choppy consolidation to take place
Resistance
0.9304 - 38.2% r of 0.9972-0.8891
0.9251 - Y'day's high
0.9217 - Y'day's hourly res
Support
0.9134 - Y'day's NY low
0.9098 - Wed's low
0.9024 - Last Thur's high
. USD/CHF - 0.9168 ... The pair tracked eur/usd's movement very closely in inverse manner on Thur. Despite dlr's rally to 0.9251 due to the selloff in euro after ECB's rate cut, profit-taking capped dlr's upside n price fell sharply to 0.9151 on renewed risk aversion due to the selloff in U.S. equities.
. Looking at the hourly n daily charts, despite y'day's resumption of upmove fm Oct's near 2-year trough of 0.8891 to 0.9251 to retrace MT downtrend fm 0.99 72 (July 2012), the subsequent strg retreat strongly suggests a temporary top is in place n sevel days of choppy consolidation is in store b4 prospect of another leg of upmove occurs later next week, below 0.9134 (reaction low fm 0.9251) wud add credence to this view, however, 0.9071, being a 'natural' 50% r of the entire rise fm 0.8891 as well as chart sup, wud contain weakness. Looking ahead, abv 0.9251 wud extend subsequent headway twd 0.9365 (50% r of intermediate fall fm 0.9839-08891).
. Today, we're trading dlr on both sides of the market n will sell on intra
-day recovery or buy on next decline in anticipation of another rebound.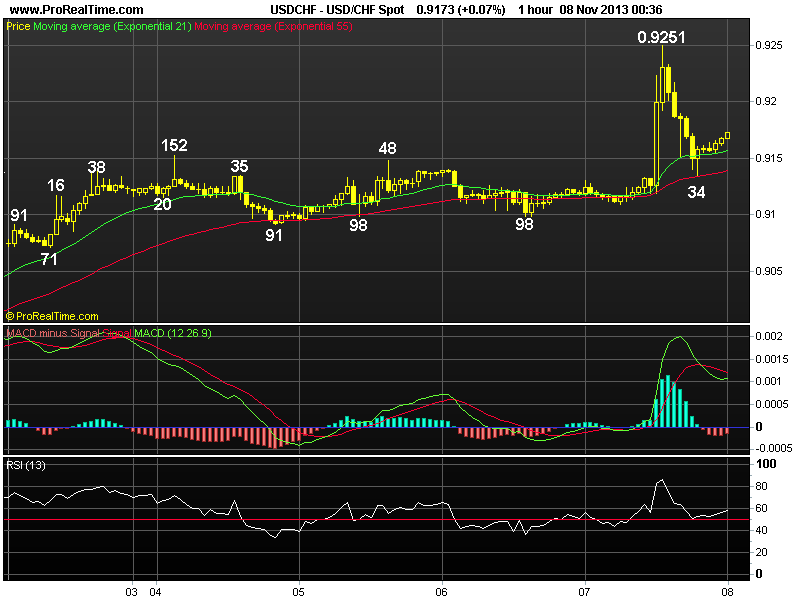
Posted by: acetraderforex Nov 15, 2013, 10:34 AM
AceTraderFx Nov 15 : Daily Technical Outlook on USD/CHF DAILY TECHNICAL OUTLOOK ON USD/CHF
15 Nov 2013
Trend Daily Chart : Up
Daily Indicators : Rising
21 HR EMA : 0.9166
55 HR EMA : 0.9168
Trend Hourly Chart : Sideways
Hourly Indicators : Rising
13 HR RSI : 59
14 HR DMI : +ve
Daily Analysis : Choppy trading to continue
Resistance
0.9251 - Last Thur's 6-week high
0.9226 - Tue's high
0.9201 - Wed's high
Support
0.9123 - Wed's late NY low
0.9091 - Last Mon's low
0.9029 - 61.8% r of 0.8891-0.9251
. USD/CHF - 0.9178 ... Despite staging a brief bounce fm Wed's low at 0.9123 to 0.9189 on Thur, renewed selling interest below Wed's high at 0.9201 pressured price to 0.9137 in NY morning after Thur's testimony by Fed's vice chair Janet Yellen. The pair then rebounded to 0.9172 b4 trading sideways.
. Looking at the daily chart, as mentioned in our previous update, Wed's
breach of 0.9134 to 0.9123 suggests upmove fm Oct's 23-month low at 0.8891 has made a 6-week high at 0.9251 last Thur n marginal weakness twds 0.9113 (38.2% r of 0.8891-0.9251) cannot be ruled out but reckon 0.9091/98 sup area wud contain downside n yield rebound later. On the upside, a breach of res at 0.9201 (Wed's high) wud confirm the correction is over n yield resumption of the Oct's rise fm 0.8891 to retrace MT downtrend fm 2012 peak at 0.9972 (Jul) to re-test 0.9246/51 res area, abv wud extend to 0.9304 (38.2% r of MT fall fm 0.9972-0.8891).
. Today, buying dlr on next decline in anticipation of a rebound is still
favoured. On the downside, only a daily close below 0.9091 wud risk stronger
retracement to 0.9024/29 (prev. res, now sup n 61.8% r fm 0.8891 resp.). 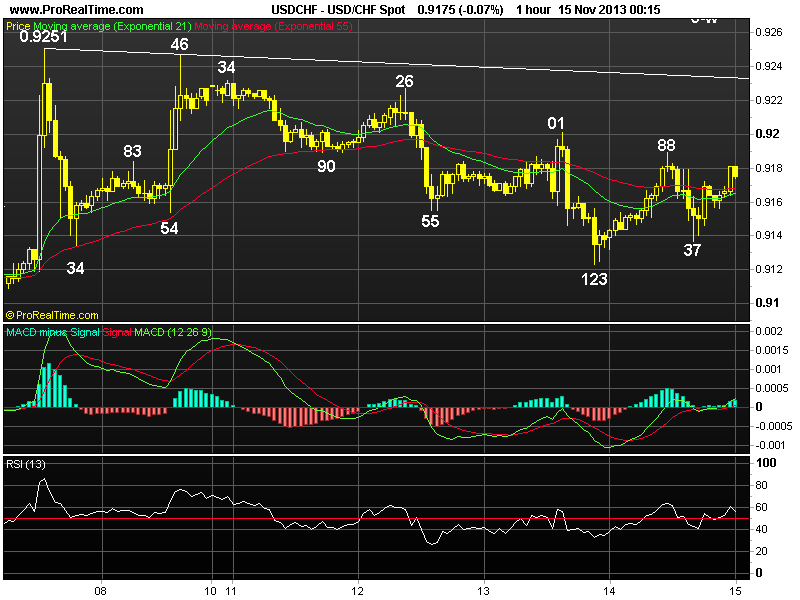
Posted by: acetraderforex Nov 18, 2013, 10:01 AM
AceTraderFx Nov 18 : </b>GBP/USD Elliott Wave analysis (weekly) 'WEEKLY' ELLIOTT WAVE ANALYSIS ON GBP/USD
15 Nov 2013 16:02GMT
. GBP/USD - 1.6091 ... Despite cable's impulsive rally fm Jul's 3-year low at 1.4814 to as high as 1.6260, subsequent retreat to 1.5854 suggests minor consolidation wud be seen b4 rising further to 1.6380 res n possibly twds 1.6491 later, however, key daily res at 1.6747 shud hold on 1st testing.
. Let's recap the previous count, decline fm 2012 Apr's peak at 1.6747
marked the terminus of a triangle C-leg (see the larger degree wave count
below), D-leg:1.6747-1.5234 n E-leg:1.5234-1.6380, subsequent selloff fm there has developed into a 3-legged decline n has ended at 1.4814 in July, current rally fm there is impulsive with wave 1.4814-1.5435: 2:1.5102 n wave 3 is now unfolding n gain to 1.6344/80 (2 times ext. of 1.4814-1.5435 measured fm 1.5102 n chart res), abv wud encourage for further rise to 1.6491 (2.236 times extension) but 1.6728/47 (2.618 times extension n 2012 Apr's peak) wud hold.
On the downside, only below 1.5718/53 (prev. sup, now res) wud signal a temporary top is made n risk stronger retracement twds Sep's low at 1.5427.
------------------- *** LARGER DEGREE WAVE COUNT *** ---------------------------
21 NOV 2011... Cable's 3-legged rise fm 1985 record low of 1.0370 signals an (A) - ( B ) - ( C ) wave has completed at 2.1162 (07'), the subsequent impulsive decline is an x-wave with wave (3) bottom at 1.3500, the choppy consolidation fm there is turning into a triangle with A-1.7044, B-1.4228, C-1.6747, D-leg is either ended at 1.5234 or may extend weakness to 1.4690-1.4781 area.
Posted by: acetraderforex Nov 19, 2013, 10:08 AM
AceTraderFx Nov 19 : Intra-Day Outlook on Major USD/JPY Intra-Day USD/JPY Outlook
19 Nov 2013 08:05 GMT
As dlr has fall again after recovering fm 99.57
to 99.93, suggesting downside bias remains for the
decline fm last Fri's 2-month peak at 100.43 to
resume soon for marginal weakness but nr term loss
of momentum shud keep price abv 99.35.
Lower short entry for 99.50, stop as indicated,
abv wud defer but res at 100.20 shud remain intact.
Rate
99.72
Strategy/Entry Level
Sell at 99.90
Objective
99.50
Stop-Loss
100.10
Range Forecast
99.57 / 99.90
Resistance
R: 99.96 /100.20/100.43
Support
S: 99.57 / 99.35/ 99.10
Posted by: acetraderforex Nov 21, 2013, 10:12 AM
AceTraderFx Nov 21: Daily Technical Outlook on GBP/USD DAILY TECHNICAL OUTLOOK ON GBP/USD
21 Nov 2013 00:22GMT
Trend Daily Chart
Sideways
Daily Indicators
Rising
21 HR EMA
1.6120
55 HR EMA
1.6116
Trend Hourly Chart
Sideways
Hourly Indicators
Falling
13 HR RSI
40
14 HR DMI
-ve
Daily Analysis
Consolidation with downside bias
Resistance
1.6208 - Oct 28 high
1.6178 - Y'day's high
1.63149 - Mon's high
Support
1.6060 - Tue's low
1.6048 - Last Fri's low
1.5988 - Last Thur's low
. GBP/USD - 1.6088.. Despite initial bounce to 1.6143 in Aust. Wed, price
retreated to 1.6104 at European open. However, cable rose after BoE minutes signalled the U.K. economy is recovering n price to climbed a 3-week high of 1.6178 in NY b4 tanking to 1.6087 after release of mildly hawkish FOMC minutes.
. Y'day's decline fm 1.6178 to 1.6087 strongly suggests cable's near term upmove fm Nov's near 2-month low at 1.5854 has made a top there n further choppy trading below 2013 peak at 1.6260 (Oct) wud be seen with downside bias, below 1.6060 sup wud add credence to this view n bring weakness to next chart sup at 1.6048, however, as hourly oscillators' readings wud be in o/sold territory on such move, reckon 1.6016 (this is a 'natural' 50% r of aforesaid rise fm 1.5854- 1.6178) wud contain weakness n bring subsequent rebound.
. Today, anticipated usd's broad-based strength shud weigh on the pound n selling cable on intra-day recovery is therefore recommended, however, profit shud be taken on subsequent decline. On the upside, only abv 1.6149/54 res wud dampen bearishness on cable n may risk re-test of 1.6178 but 1.6208 shud hold. 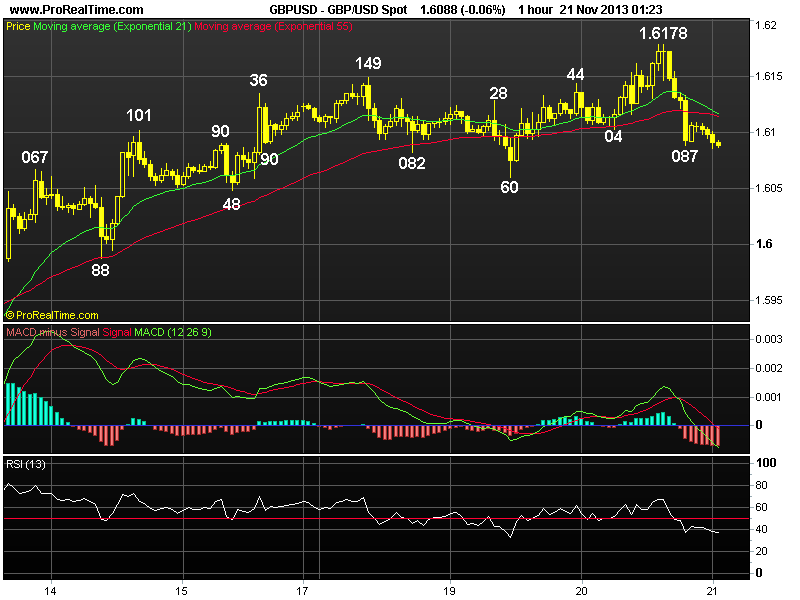
Posted by: acetraderforex Nov 22, 2013, 11:09 AM
AceTraderFx Nov 22 : Daily Technical Outlook on USD/CHF DAILY TECHNICAL OUTLOOK ON USD/CHF
22 Nov 2013 00:34GMT
Trend Daily Chart
Sideways
Daily Indicators
Neutral
21 HR EMA
0.9150
55 HR EMA
0.9146
Trend Hourly Chart
Sideways
Hourly Indicators
Falling
13 HR RSI
44
14 HR DMI
-ve
Daily Analysis
Consolidation with a neutral bias
Resistance
0.9251 - Nov's high (7th)
0.9226 - Last Tue's high
0.9194 - Wed's high
Support
0.9123 - Wed's European high
0.9080 - Wed's low (Aust.)
0.9029 - 61.8% r of 0.8891-0.9251
. USD/CHF - 0.9142 ... Despite initial firmness in Asia y'day following a
strg rally fm 0.9080 to as high as 0.9194 on Wed, dlr failed to re-test 0.9194 n fell in Europe due to intra-day rebound in eur/usd, dlr fell to 0.9128 in NY,
then marginally to 0.9125 in Aust. today b4 staging a recovery at Asian open.
. Looking at the daily chart, although Wed's strg bounce fm 0.9080 to 0.9194 signals correction fm Nov's 6-week peak at 0.9251 has ended n re-test of this res lvl is envisaged next week, abv there wud confirm the MT rise fm 2013 trough at 0.8891 (Oct) has once again resumed, then gain to 0.9304 wud be seen later this month, being a 'minimum' 38.2% r of the MT 3-legged fall fm 0.9972 (2012 peak in Jul)to 0.8891. Having said that, dlr's aforesaid retreat fm 0.9194 to 0.9125 earlier today suggests choppy consolidation wud be seen b4 prospect of subsequent resumption of aforesaid upmove.
. Today, although dlr's rebound fm 0.9125 signals erratic fall fm 0.9194
has made a low, abv NY high at 0.9165 is needed to turn outlook bullish for re
test of 0.9194, then twd 0.9226. Below 0.9123/25 may risk weakness twd 0.9080. 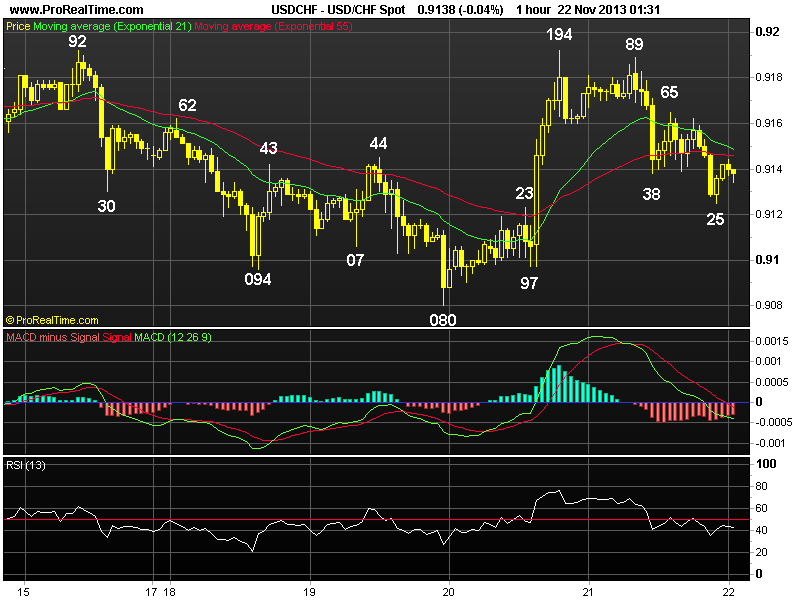
Posted by: acetraderforex Nov 25, 2013, 09:34 AM
AceTraderFx Nov 25: Weekly Outlook on GBP/USD WEEKLY GBP/USD OUTLOOK - 1.6228
25 Nov 2013 03:38GMT
Cable's rally abv res at 1.6178 (now sup) has
turned outlook bullish for a re-test of Oct's high
at 1.6260, abv there wud extend MT rise fm Jul's 3-
year trough at 1.4814 twd 2013 peak at 1.6380 (Jan)
but break there needed to yield further headway twd
next projected target at 1.6433 in Dec.
Turn long on dips in anticipation of such a move
n only below 1.6109 signals temp. top is in place,
risks weakness to 1.6072 n possibly twd 1.6000.
STRATEGY : Buy at 1.6195
OBJECTIVE : 1.6350
STOP-LOSS : 1.6140
RES : 1.6260/1.6380/1.6433
SUP : 1.6178/1.6072/1.5988
Posted by: acetraderforex Nov 28, 2013, 03:32 AM
AceTraderFx Nov 28: ELLIOTT WAVE ANALYSIS- weekly on USD/JPY WEEKLY ELLIOTT WAVE ANALYSIS ON USD/JPY
27 Nov 2013 13:09GMT
. USD/JPY - 101.78 ... U.S. dollar found renewed buying at 96.55 in Oct n rallied abv 100.62 (Sep's high) n 101.53 (Jul's high), suggesting the triangle-like consolidation fm this year's high at 103.74 (May) has possibly ended earlier at 93.78 in Jun n LT rise fm record low at 79.75 shud resume for re-test of aforesaid key daily res at 103.74 later, possibly in Dec.
. Our labelling of the low at 79.75 major wave [3] trough n 147.64 is the
major wave [4] terminus. The decline fm 147.64 is the 'final' wave [5] which has 'possibly' ended at 75.32 in Oct 2011, the subsequent rally is an impulsive wave with 1::75.32-84.18; 2:77.13 n we are taking the view that wave 3 has ended at 103.74 n wave 4, which developed into a triangle with a:103.74-93.78, b:101.53, c:95.79: d:100.62 n e:96.55 n wave 5 is now in progress n a re-test of 103.74 wud be seen soon, abv wud extend gain to 105.00 later.
On the downside, only below 99.00/01 wud suggest wave 4 is still
developing n may bring another drop to 96.55 but renewed buying shud emerge well abv key daily sup at 93.78 (Jun's low).
------------------- *** LARGER DEGREE WAVE COUNT *** ---------------------------
17 NOV 2011..The break of 79.75 (95') signals this was the major wave [3] trough n wave [4] ended at 147.64 (Jul 98), subsequent erratic fall is wave [5] which is unfolding into diagonal A-B-C-D-E : A-101.25, B-124.14, current C-wave is a 3-legged move with (a.) wave trough at 87.10, (b.) wave top at 101.45 n (c.) 75.32 ?
Posted by: acetraderforex Dec 9, 2013, 04:47 AM
AceTraderFx Dec 9: Weekly Technical analysis on Major WEEKLY USD/JPY OUTLOOK
09 Dec 2013 00:16GMT
Trend Daily Chart
Up
Daily Indicators
Rising
21 HR EMA
102.69
55 HR EMA
102.44
Trend Hourly Chart
Up
Hourly Indicators
O/bot
13 HR RSI
76
14 HR DMI
+ve
Daily Analysis
Consolidation with upside bias
Resistance
104.51 50% proj. of 97.60-103.38 fm 101.62
103.74 - 2013 peak (May 2)
103.38 - Last Tue's 6-month high
Support
102.44 - Last Thur's high
102.21 - Last Fri's European morning high
101.62 - Last Thur's low
. USD/JPY - 103.08... Although the greenback ratcheted lower initially last week after climbing to a 6-month high of 103.38 (Tue), decline in the Nikkei fm 6-year highs prompted broad-based buying of yen n pressured price to 101.62 b4 rallying strongly back to 102.97 on Fri, n then 103.22 in Australia today.
. Looking at the daily picture, as indicated in previous update, dlr's close
abv 102.84 res Fri signals correction fm 103.74 is over n the pair is posied to
re-test 2013 4-1/2 year peak at 103.74 (May), break there wud confirm LT uptrend fm 2011 record low at 75.32 (Oct) has finally resumed, then the pair is en route twd 107.96 in Q1 2014, being 50% proj. of 75.32-103.74 measured fm 93.75. This week, abv 103.74 wud extend initial gain to 104.51 (50% proj. of MT intermediate rise fm 97.60-103.38 fm 101.62 but 105.19 (61.8% proj.) wud cap upside. Only below 102.21 wud dampen bullishness n risk retracement twd 101.15.
. Today, as current price is abv the 21-hr n 55-hr emas, suggesting dlr
wud head to 103.38 1st, break wud encourage for subsequent re-test of said 2013
peak n only below 102.41/44 aborts intra-day bullishness on dlr. .png)
Posted by: acetraderforex Dec 20, 2013, 04:32 AM
AceTraderFx 20: WEEKLY ELLIOTT WAVE ANALYSIS ON USD/JPY WEEKLY ELLIOTT WAVE ANALYSIS ON USD/JPY
19 Dec 2013 15:44GMT
. USD/JPY - 104.15 ... Dollar's rally abv this year's high at 103.74 (May)
confirms an upside break of the 'triangle' consolidation fm there has ended
earlier at 93.75 n LT rise fm record low at 75.32 (Oct 2011) has resumed for
further gain to 105.51 n then twds 107.06 in Q1 2014.
. Our labelling of the low at 79.75 major wave [3] trough n 147.64 is the
major wave [4] terminus. The decline fm 147.64 is the 'final' wave [5] which has
'possibly' ended at 75.32 in Oct 2011, the subsequent rally is an impulsive wave
with 1::75.32-84.18; 2:77.13 n we are taking the view that wave 3 has ended at
103.74 n wave 4 ended with a triangle with a:103.74-93.78, b:101.53, c:95.79:
d:100.62 n e:96.55 n wave 5 is now in progress for further gain to 107.06, being
50% projection of 77.13-103.74 measured fm 93.75 later this month or in Q1 2014.
On the downside, only below 101.53 (b-leg top) wud signal a temp. top is
made n risk retrace. to 100.00 but strg buying interest shud emerge well abv
daily sup at 96.55.
Posted by: acetraderforex Dec 27, 2013, 04:30 AM
AceTraderFx Dec 27: Daily Outlook on Major USD/JPY DAILY USD/JPY OUTLOOK - 104.81
26 Dec 2013 23:25GMT
Dlr's firmness after y'day's rise to a fresh 5-
year peak at 104.85 suggests LT uptrend wud extend
gain to 105.00 after initial consolidation, break
there wud bring subsequent headway twds projected
obj. at 105.15/20 but reckon 105.40/50 wud hold.
Buy on dips with stop as indicated, below wud
abort n risk stronger retracement to 103.77.
STRATEGY : Buy at 104.45
OBJECTIVE : 105.20
STOP-LOSS : 104.10
RES : 105.00/105.43/105.91
SUP : 104.64/104.12/103.77
Posted by: acetraderforex Jan 2, 2014, 04:49 AM
AceTraderFx Jan 2, 2013: Weekly market outlook on USD/JPY WEEKLY USD/JPY OUTLOOK - 105.31
31 Dec 2013 05:46GMT
Dlr's intra-day resumption upmove to a fresh 5-
year peak of 105.41 suggests uptrend fm 2011 record
low at 75.32 wud head twd 106.23, however, o/bot
condition shud prevent strg gain this week n reckon
projected res at 107.06 shud cap upside, risk has
increased for a correction to occur in Jan 2014.
Still favour buying dlr on dips for this move n
only below 103.77 confirms temporary top is finally
in place, risks stronger retracement twd 102.50.
STRATEGY : Buy at market
OBJECTIVE : 106.55
STOP-LOSS : 104.60
RES : 105.41/106.23/107.06
SUP : 104.64/103.77/102.50
Posted by: acetraderforex Jan 20, 2014, 04:31 AM
AceTraderFx Jan 20 : Intraday Market Outlook on USD/JPY INTRA-DAY USD/JPY OUTLOOK - 104.04
20 Jan 2014 02:04GMT
Although initial cross-buying of yen pushed dlr
below prev. sup at 104.15 (Thur) to 103.87 in Asia,
present rebound suggests erratic fall fm 104.92
(Thur) has possibly made a temp. low n choppy conso
lidation is seen, abv 104.21 wud yield 104.35/40.
Stand aside n sell dlr on further rise to 104.40
or buy on next decline to 103.80.
Posted by: acetraderforex Jan 21, 2014, 03:22 AM
AceTraderFx Jan 21: Intra-day Recommendations on USD/JPY INTRA-DAY Outlook on USD/JPY - 104.52
21 Jan 2014 01:25 GMT
Dlr's present firm breach of Mon's European top at 104.26 strongly suggests early pullback fm last Thur's high at 104.92 has ended y'day at 103.86 n consolidation with upside bias remains for further gain twd 104.66 but 104.92 shud hold in Asia.
Posted by: acetraderforex Jan 27, 2014, 03:32 AM
AceTraderFx Jan 27: Daily Outlook on Major USD/JPY Daily Recommendations on Major USD/JPY
27 Jan 2014 00:26 GMT
DAILY OUTLOOK ON USD/JPY - 102.27
Intra-day selloff below Fri's low at 102.00 to 101.77 on Monday suggests corrective fall fm Jan's 5-year peak at 105.45 remains in progress n down- side bias remains for weakness to 101.62, then 101. 30/35 but sup 101.14/15 wud hold n yield rebound.
Posted by: acetraderforex Jan 28, 2014, 03:21 AM
AceTraderFx Jan 28: Daily Outlook on Major USD/JPY Daily Recommendations on USD/JPY
28 Jan 2014 00:07 GMT
DAILY OUTLOOK ON USD/JPY - 102.55
Although USD's rebound from Mon's 7-week bottom of 101.77 to 102.93 signals recent fall from Jan's 5-yr peak at 105.45 has made a minor low,
subsequent retreat to 102.20 in NY suggests as long as 102.93 holds, decline would resume to 101.62, then 101.40.
Posted by: acetraderforex Jan 30, 2014, 09:08 AM
AceTraderFx Jan 30 : Daily Technical Outlook on Major EUR/USD DAILY TECHNICAL OUTLOOK ON EUR/USD
30 Jan 2014 01:01GMT
Trend Daily Chart
Sideways
Daily Indicators
Turning up
21 HR EMA
1.3659
55 HR EMA
1.3661
Trend Hourly Chart
Sideways
Hourly Indicators
Neutral
13 HR RSI
50
14 HR DMI
-ve
Daily Analysis
Consolidation with mild upside bias
Resistance
1.3740 - Last Fri's high
1.3716 - Mon's high
1.3688 - Tue's high
Support
1.3603 - Y'day's low
1.3584 - Last Wed's high, now sup
1.3508 - Jan 20 low
. EUR/USD - 1.3662 ... The single currency went through a 'roller-coaster'
session on Wed. Despite a brief bounce to 1.3685 in Europe, euro retreated after
failing to penetrate previous res area at 1.3686/89 n then tumbled to session
low of 1.3603 in NY morning b4 rebounding to 1.3677 ahead of FOMC.
. Despite y'day's brief breach of indicated sup at 1.3625 to 1.3603, subse
quent bounce to 1.3677 suggests further 'choppy' consolidation abv last Mon's 7-
week trough at 1.3508 wud be seen n as long as said y'day's low holds, upside
bias still remains. However, a firm breach of 1.3686/89 is needed to signal the
pullback fm last Fri's high at 1.3740 has ended there n extend upmove to 1.3716
(Mon's high), abv suggesst upmove fm 1.3508 has resumed n yield re-test of 1.37
40 (Fri's high), abv wud bring subsequent headway to 1.3812/33, break confirms
correction fm Dec's 2-year peak at 1.3894 has indeed ended n yield re-test of
said res next week.
. In view of abv analysis, buying euro on dips in anticipation of another
rebound is cautiously favoured. On the downside, only a daily close below 1.3584
(last Wed's high, now sup) signals recovery fm 1.3508 is over, 1.3530, 1.3508..png)
Posted by: acetraderforex Feb 4, 2014, 09:01 AM
AceTraderFx Feb 4: Daily Technical Market Outlook on Major USD/JPY DAILY USD/JPY TECHNICAL OUTLOOK
04 Feb 2014 00:14GMT
Trend Daily Chart
Falling
Daily Indicators
Falling
21 HR EMA
101.47
55 HR EMA
101.91
Trend Hourly Chart
Falling
Hourly Indicators
Rising fm o/s
13 HR RSI
36
14 HR DMI
-ve
Daily Analysis
Resumption of recent decline
Resistance
102.41 - Last Fri's NY high
102.14 - Y'day's NY high
101.77 - Last Mon's low, now res
Support
100.77 - Y'day's NY low
100.62 - Sep 11 2013 high
100.30 - Equality proj. of 104.92-101.77 fm 103.45
. USD/JPY - 101.18... Despite dlr's recovery fm 101.98 (NZ) to 102.41 in
Asia on Mon, broad-based buying of yen on risk aversion pressured price below
last Mon's 7-week low at 101.77 to 101.67 in Europe. Later, dlr tumbled to 100.
77 in NY after release of disappointing U.S. ISM manuf. report b4 recovering.
. Looking at the daily chart, y'day's sharp selloff below 101.77 to 100.77
confirms decline fm Jan's 5-year peak at 105.45 to retrace intermediate MT rise
fm 95.81 (Aug low in 2013) has resumed n despite subsequent recovery, as price
is still trading below both 21-hr n 55-hr emas, suggesting bias for dlr remains
to the downside, a breach of said sup shud send dlr lower to next downside obj.
at 100.30, being equality projection of intermediate fall fm 104.92-101.77 mea-
sured fm 103.45, however, a daily close below there is needed to retain bearish
prospect of further losses twd 99.60 (50% r fm 93.75) later this week.
. In view of abv analysis, selling dlr on intra-day recovery in anticipation
of aforesaid fall is favoured n only abv 102.14 (y'day's NY morning high) wud
indicate a temporary low is made n may risk stronger retracement to 102.41,
being y'day's n as well as last Fri's NY high, b4 down. .png)
Posted by: acetraderforex Feb 5, 2014, 03:19 AM
AceTraderFx Feb 5: Daily Market Outlook on Major EUR/USD DAILY MARKET OUTLOOK EUR/USD - 1.3520
05 Feb 2014 01:06 GMT
The single currency rebounds from Monday's low at 1.3477 to 1.3539 on Tuesday suggests choppy trading would be seen but as long as resistance at 1.3574 holds.
Daily bearishness remains for another sell-off later this week, breach of said support would indicate decline from December's 2-year peak at 1.3894 has once again resumed and then further weakness to 1.3455 and 1.3410/20 would follow.
On the upside, only a daily close above 1.3603/09 would shift risk to upside instead for stronger retracement to 1.3640/50 and possibly 1.3685/88.
Posted by: acetraderforex Feb 6, 2014, 03:48 AM
AceTraderFx Feb 6: Daily Market Outlook on Major – EUR/USD DAILY MARKET OUTLOOK EUR/USD - 1.3531
06 Feb 2014 01:10 GMT
Despite euro's volatile trading on Wednesday, as price has retreated after being capped below yesterday's New York morning high of 1.3555, suggesting recovery from Monday's 2-month low at 1.3477 has ended there and consolidation with downside bias remains, however, breach of said support is needed to confirm decline from December's 2-year peak at 1.3894 has resumed and extend weakness to next retracement objective at 1.3455 and later towards 1.3399.
On the upside, only a firm breach of chart resistance at 1.3574 would confirm a temporary low is in place and turn outlook mildly bullishness instead for gain to 1.3603/09 and then 1.3640
Posted by: acetraderforex Feb 7, 2014, 04:07 AM
AceTraderFx Feb 7: Daily Market Outlook on Major EUR/USD DAILY MARKET OUTLOOK EUR/USD - 1.3590
Update Time: 07 Feb 2014 01:35 GMT
Yesterday rally from 1.3482 to 1.3619 on Thursday after ECB'S President Mario Draghi refraining from any additional stimulus measures announcement signals decline from December's 2-year peak at 1.3894 has made a temporary low earlier at Monday's 2-month trough at 1.3477.
Consolidation with upside bias remains, above said overnight resistance at 1.3619 would bring stronger retracement to 1.3640 and then 1.3665/70, however, near term over bought condition should cap price below chart res sat 1.3686 and yield retreat later.
On the downside, only a daily close below 1.3508 (previous daily support level) would indicate aforesaid correction is over instead and bring re-test of 1.3477, break, 1.3455 and then towards 1.3399.
Posted by: acetraderforex Feb 11, 2014, 03:59 AM
AceTraderFx Feb 11: Daily Market Outlook on Major – USD/EUR DAILY MARKET OUTLOOK EUR/USD - 1.3667
Update Time: 11 Feb 2014 01:40 GMT
Euro's intra-day rally above yesterday's high at 1.3652 to 1.3678 suggests near term rise from last Monday's trough at 1.3477 to retrace decline from December's 2-year peak at 1.3894 remains in progress and further gain to 1.3685/88, then 1.3716 would be seen, however, near term loss of momentum would keep price well below resistance at 1.3740 and yield retreat later.
On the downside, only below 1.3576 would indicate a temporary top has been made and bring stronger correction towards 1.3552.
Posted by: acetraderforex Feb 19, 2014, 09:18 AM
AceTraderFx Feb 19: Daily Technical Outlook on Major – USD/CHF DAILY USD/CHF TECHNICAL OUTLOOK
Last Update At 19 Feb 2014 00:12GMT
Trend Daily Chart
Down
Daily Indicators
Falling
21 HR EMA
0.8891
55 HR EMA
0.8907
Trend Hourly Chart
Down
Hourly Indicators
Bullish convergences
13 HR RSI
29
14 HR DMI
-ve
Daily Analysis
Resumption of recent decline
Resistance
0.9038 - last Wed's high
0.8989 - last Tue's high
0.8949 - last Thur's NY res
Support
0.8870 - Y'day's low
0.8860 - Dec 30 low
0.8800 - Dec 27 low
. USD/CHF - 0.8879... Despite dlr's recovery fm Monday's low at 0.8900 to
0.8929 in Asia on Tuesday, intra-day rally in euro together with selling in
eur/chf cross pressured price lower in Europe n dlr later fell to a fresh 6-week
trough at 0.8870 in NY morning b4 stabilizing.
. Looking at the hourly n daily charts, y'day's fall below Mon's low at
0.8900 to 0.8870 suggests bias for dlr remains to the downside n decline fm
Jan's peak at 0.9156 shud pressure price further to 0.8860 n then 0.8832, being
Dec 30 low n Dec 17 low respectively, after consolidation. However, as hourly
oscillators wud display prominent bullish convergences on such move, sharp fall
below there is unlikely to be seen n reckon Dec's 2-year low at 0.8800 wud hold
on 1st testing n yield minor correction later this week. Looking ahead, a daily
close below 0.8800 wud confirm MT downtrend fm 2012 peak at 0.9972 has 'finally'
resumed n extend weakness twd 0.8700 in late Feb/early Mar.
. In view of abv analysis, selling dlr on intra-day recovery is still
favored today but one shud take profit on next decline. On the upside, only abv
0.8949 wud indicate a temporary low has been made n risk retracement to 0.8989. .png)
Posted by: acetraderforex Feb 20, 2014, 09:41 AM
AceTraderFx Feb 20: Daily Technical Outlook on Major – GBP/USD DAILY TECHNICAL OUTLOOK ON GBP/USD
Update At 20 Feb 2014 00:51GMT
Trend Daily Chart
Up
Daily Indicators
Rising
21 HR EMA
1.6689
55 HR EMA
1.6693
Trend Hourly Chart
Sideways
Hourly Indicators
Neutral
13 HR RSI
44
14 HR DMI
-ve
Daily Analysis
Initial decline b4 rebound
Resistance
1.6823 - Mon's fresh 4-year high
1.6796 - Hourly chart
1.6742 - Tue's high
Support
1.6637 - Y'day's low
1.6600 - Hourly chart
1.6558 - Prev. res, now sup
. GBP/USD - 1.6678... Despite cable's brief rebound to 1.6734 in European
morning y'ay, price tumbled to 1.6660 after higher-than-expected U.K. unemploy-
ment rate n then to 1.6537 ahead of NY open. Later, cable recovered on short-
covering to 1.6725 in NY morning b4 falling again after FOMC minutes.
. Looking at the hourly n daily charts, y'day's firm breach of Tue's low
at 1.6655 to 1.6637 confirms corrective decline fm Mon's 4-year peak at 1.6823
has resumed n as long as res area at 1.6734/42 (y'day's high n Tue's high)
holds, downside bias remains for aforesaid fall to retrace MT uptrend fm 2013
bottom at 1.4814 (Jul) to extend marginally, however, as houly oscillators'
readings wud display 'bullish convergences' on next decline, reckon 1.6600/05,
hourly chart lvl n the 'minimum' 38.2% r of intermediate rise fm 1.6252-1.6823,
wud contain weakness n yield rebound later.
. In view of abv analysis, although selling cable on intra-day recovery is
favoured, day traders shud buy the pound on next decline. On the upside, a daily
close abv the said res area at 1.6724-42 wud be the 1st signal correction is
over n yield further gain twd 1.6796, then re-test of 1.623 next week. 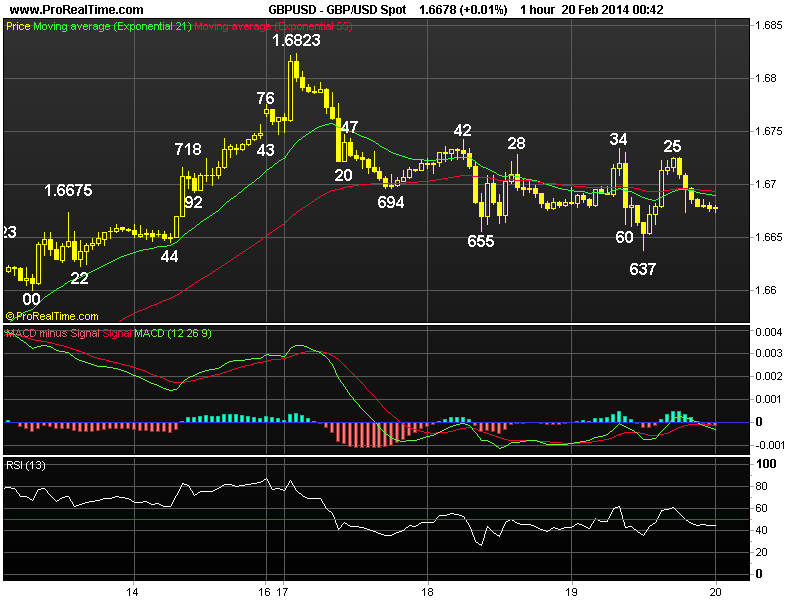
Posted by: acetraderforex Feb 24, 2014, 04:04 AM
AceTraderFx Feb 24: Daily Market Outlook on Major - EUR/USD DAILY MARKET OUTLOOK EUR/USD - 1.3739
Update Time: 24 Feb 2014 00:33 GMT
Despite Friday's brief but sharp rebound to 1.3758, subsequent retreat to 1.3720 suggests initial consolidation would be seen and marginal weakness from here cannot be ruled out, however, support at 1.3702 should contain downside and yield strong rebound later today. Above 1.3758 would retain bullishness for a re-test of last week's high at 1.3773, break would extend gain towards 1.3819/20.
On the downside, only below 1.3685 would abort intra-day bullish view and risk stronger retracement of rise from February's low at 1.3477 towards 1.3619.
Posted by: acetraderforex Feb 26, 2014, 04:13 AM
AceTraderFx Feb 26: Daily Recommendations on Major - USD/JPY DAILY OUTLOOK ON USD/JPY - 102.19
Update Time: 25 Feb 2014 23:27 GMT
Yesterday's weakness to 102.01 suggests erratic rise from Feb's 10-week trough at 100.76 has made a temp. top at 102.83 last Fri and as long as res area 102.63 /68 holds, downside bias remains for a stronger re- tracement to 101.67 but sup 101.38 would hold.
Posted by: acetraderforex Feb 27, 2014, 08:47 AM
AceTraderFx Feb 27: Daily Technical Outlook on Major – USD/CHF DAILY USD/CHF TECHNICAL OUTLOOK
27 Feb 2014 00:28GMT
Trend Daily Chart
Sideways
Daily Indicators
Falling
21 HR EMA
0.8899
55 HR EMA
0.8889
Trend Hourly Chart
Nr term up
Hourly Indicators
Easing fm o/bot
13 HR RSI
63
14 HR DMI
+ve
Daily Analysis
Consolidation with upside bias
Resistance
0.8989 - Feb 11 top
0.8967 - Min. 38.2% r of 0.9156-0.9050
0.8930 - Y'day's low
Support
0.8892 - Tue's high (now sup)
0.8850 - Mon's low
0.8800 - Dec 2-year low (27th)
. USD/CHF - 0.8910... Although dlr traded sideways after finding sup at
0.8867 in Asia on Wed, price started to ratchet higher in Europe due to euro's
intra-day weakness. Later, dlr rallied to 0.8930 in NY morning as U.S. Jan new
home sales rose unexpectedly b4 retreating to 0.8904 near NY close.
. Looking at hourly n daily charts, y'day's breach of indicated res at
0.8910/15 (Mon's high n Feb's 20 high respectively) confirms decline fm Jan's
peak at 0.9156 has formed a temporary bottom at Mon's 8-week trough at 0.8850 n
as long as this sup holds, consolidation with upside bias remains for gain twd
0.8967, being 'minimum' 38.2% r of 0.9156-0.8850, however, as hourly oscillators
wud be in o/bot territory on such a move, measured res at 0.8993/03, 61.8% r of
intermediate fall fm 0.9082-0.8850 n also a 'natural' 50% r of aforesaid entire
decline respectively, shud hold n yield strg retreat later.
. In view of abv analysis, buying dlr on intra-day pullback is favoured but
one shud be prudent to take profit twd 0.8960/70. On the downside, only a break
below 0.8850 sup wud revive early bearishness instead for subsequent weakness
twd Dec's 2-year trough at 0.8800 tom or early next week..png)
Posted by: acetraderforex Feb 28, 2014, 09:37 AM
AceTraderFx Feb 28 : Daily Technical Outlook on Major – GBP/USD DAILY TECHNICAL OUTLOOK ON GBP/USD
Last Update At 28 Feb 2014 01:21GMT
Trend Daily Chart
Up
Daily Indicators
Rising
21 HR EMA
1.6677
55 HR EMA
1.6671
Trend Hourly Chart
Sideways
Hourly Indicators
Rising
13 HR RSI
63
14 HR DMI
+ve
Daily Analysis
Consolidation with upside bias
Resistance
1.6823 - Last Mon's 4-year high
1.6776 - Last Mon's NZ res
1.6728 - Tue's high
Support
1.6617 - Y'day's low
1.6583 - Mon's low
1.6537 - 50% r of 1.6252-1.6823
. GBP/USD - 1.6691 ... The British pound continued to fluctuate wildly on Thur. Although cable weakened fm Asian high at 1.6683 to 1.6617 in European morning, renewed buying interest there lifted price n sterling later rallied back to 1.6699 after dovish remarks by Fed Chair Janet Yellen b4 stabilising.
. Despite y'day's brief drop below Wed's low at 1.6622 to 1.6617, cable's
subsequent rebound after holding well abv Mon's low at 1.6583 suggests further 'choppy' sideways trading inside near term established broad range of 1.6583- 1.6728 wud continue with upside bias for gain to 1.6728 res (Tue's high), however, break is needed to signal the corrective fall fm last Mon's 4-year peak at 1.6823 has indeed ended at 1.6583 (Mon) n a daily close abv 1.6734/42, Feb 19 high n Feb 18 top respectively wud add credence to this view n yield possible resumption of MT uptrend for re-test of 1.6823 later next week.
. Today, we're holding a long position in anticipation of further gain. On
the downside, only below 1.6617 wud shift risk to the downside for a re-test of Mon's low at 1.6583, below wud bring stronger retracement of MT intermediate fm rise 1.6252 twd 1.6537 (being 50% r of 1.6252-1.6823) b4 prospect of recovery. 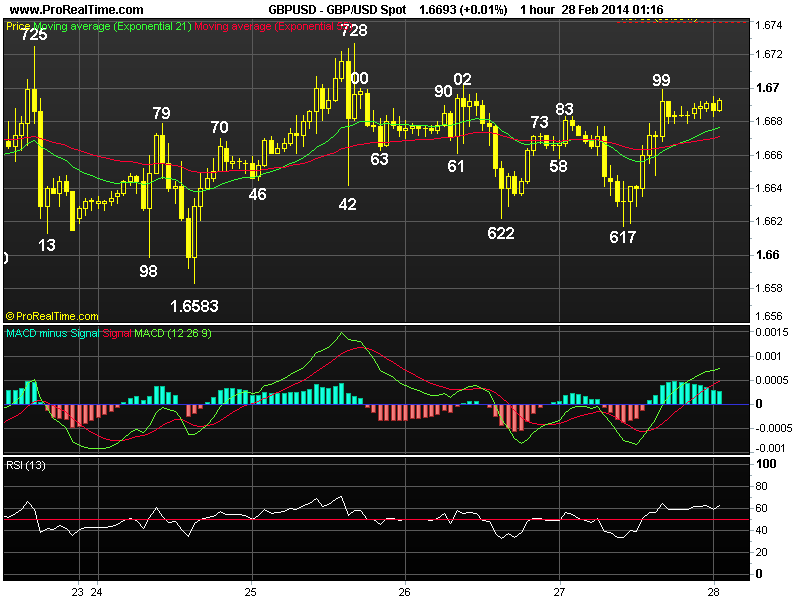
Posted by: acetraderforex Mar 3, 2014, 10:05 AM
AceTraderFx Mar 3: Weekly Technical Outlook on Major - USD/JPY WEEKLY USD/JPY TECHNICAL OUTLOOK
03 Mar 2014 00:47GMT
Trend Daily Chart
Sideways
Daily Indicators
Falling
21 HR EMA
101.76
55 HR EMA
101.95
Trend Hourly Chart
Down
Hourly Indicators
Oversold
13 HR RSI
30
14 HR DMI
-ve
Daily Analysis
Consolidation with downside bias
Resistance
102.83 - Feb 21 high
102.30 - Fri's high
101.72 - Thur's low (now res)
Support
101.27 - Intra-day low
100.76 - Feb 04 low
100.19 - 61.8% r of 96.94-105.45
. USD/JPY - 101.37... Although the greenback traded sideways initially last
Mon, price weakened to 102.01 on Tue b4 staging a rebound to 102.61 Wed. Renewed
selling there on risk aversion pressured the pair lower to 101.55 on Fri, then
to 101.27 in Australia today due heightened political tension in Ukraine.
. Looking at the hourly n daily charts, intra-day break of key sup at 101.38
confirms the correction fm Feb's 10-week low at 100.76 has ended at 102.83 (Feb
21) n as price is trading below 21h n 55h EMAs, consolidation with downside bias
remains for erratic decline fm Jan's 5-year peak at 105.45 to resume n yield re-
test of aforesaid low, break wud retain bearishness for further weakness twds
100.19, being the 'dynamic' 61.8% r of the rise fm 96.94 to 105.45. However, as
hourly oscillators wud be in o/sold territory on such move, sharp fall below
there is unlikely to be seen n psychological sup at 100.00 shud hold n yield strg
rebound later this week.
. Today, in view of abv analysis n continued political tensions in Ukraine,
selling on recovery is the way to go. Only a daily close abv 102.30 wud abort
bearish scenario n risk gain twds 102.61/68 but 102.83 shud hold initially..png)
Posted by: acetraderforex Mar 4, 2014, 09:25 AM
AceTraderFx Mar 4: Daily Technical Outlook on Major USD/CHF DAILY USD/CHF TECHNICAL OUTLOOK
04 Mar 2014 01:08GMT
Trend Daily Chart
Down
Daily Indicators
Falling
21 HR EMA
0.8820
55 HR EMA
0.8829
Trend Hourly Chart
Sideways
Hourly Indicators
Rising
13 HR RSI
60
14 HR DMI
+ve
Daily Analysis
Choppy trading to continue
Resistance
0.8930 - Last Wed's high
0.8889 - Last Fri's high
0.8850 - Last Mon's low (now sup)
Support
0.8777 - Last Fri's fresh 2-year low
0.8742 - 100% proj. of 0.9038-0.8850 fm 0.8930
0.8674 - .618 ext. of 09156-0.8904 fm 0.9082
. USD/CHF - 0.8805... Dlr found support after a brief selloff fm 0.8809 to
0.8783 in Aust. on Mon on short-covering in eur/chf cross n price later edged
higher to 0.8812 in early Europe n continued to strengthen after release of
upbeat U.S. eco. data, posting session high at 0.8836 in NY afternoon.
. Looking at the hourly n daily charts, dlr's rebound to 0.8836 suggests
1-2 days of choppy trading abv last Fri's fresh 2-year bottom at 0.8777 wud be
seen b4 MT downtrend fm 0.9972 (2012 top) resumes for a re-test of said sup. A
stronger recovery twd 0.8854, being the 'natural' 50% r of intermediate fall fm
0.8930-0.8777, cannot be ruled out, however, reckon chart res at 0.8889 (last
Fri's high) wud hold n downside bias remains for another fall later. Looking
ahead, a breach of 0.8777 wud confirm aforesaid decline to correct early LT
uptrend fm 2011 record low at 0.7072 has resumed n price shud en route to 0.86
36, being 50% projection of the intermediate fall fm 0.9839 (2013 peak) to
0.8800 measured fm 0.9156, later this month.
. In view of abv analysis, we're standing aside initially n wud sell on
recovery twd 0.8889 as only abv 0.8930 aborts bearishness, risks gain to 0.8989. .png)
Posted by: acetraderforex Mar 10, 2014, 04:20 AM
AceTraderFx Mar 10: Daily Market Outlook on Major - EUR/USD DAILY MARKET OUTLOOK EUR/USD - 1.3887
Update Time: 10 Mar 2014 01:05 GMT
Although price has rebounded after sharp retreat from last Friday's fresh 2-year peak at 1.3915 to 1.3853 and minor consolidation would be seen in Asia today, as aforesaid move signals a temporary top has been made there, outlook remains mildly bearish for a stronger retracement to 1.3795/00. However, sharp fall below there is unlikely to be seen and support at 1.3776 would hold and yield strong recovery later.
On the upside, only a daily close above 1.3915 would revive bullishness for further gain to 1.3939, then 1.3950/55 before prospect of a correction.
Posted by: acetraderforex Mar 13, 2014, 03:21 AM
AceTraderFx March 13: Daily Recommendations on Major – EUR/USD DAILY MARKET OUTLOOK EUR/USD - 1.3860
Update Time: 12 Mar 2014 01:41 GMT
Despite euro's retreat to 1.3834 yesterday, subsequent rebound to 1.3877 in New York afternoon suggests the correction from last Friday's fresh 2-year high at 1.3915 has possibly ended there and consolidation with upside bias would be seen, however, above Monday's high at 1.3897 is needed to confirm this view and yield resumption of medium-term uptrend for a re-test of said top.
On the downside, only a daily close below 1.3825 (previous resistance, now support) would indicate a temporary top has been made and bring retracement towards 1.3776.
Posted by: acetraderforex Mar 14, 2014, 09:05 AM
AceTraderFx March 14: Daily Technical Outlook on Major – USD/CHF DAILY USD/CHF TECHNICAL OUTLOOK
Last Update At 14 Mar 2014 00:58GMT
Trend Daily Chart
Down
Daily Indicators
Falling
21 HR EMA
0.8739
55 HR EMA
0.8748
Trend Hourly Chart
Sideways
Hourly Indicators
Rising
13 HR RSI
59
14 HR DMI
+ve
Daily Analysis
Consolidation with upside bias
Resistance
0.8859 - Last Wed's low (now res)
0.8816 - Last Fri's high
0.8764 - Y'day's high
Support
0.8698 - Y'day's fresh 2-1/4 year low
0.8674 - 1.618 times ext. of 0.9156-0.8904 fm 0.9082
0.8636 - 50% proj. of 0.9839-0.8800 fm 0.9156
. USD/CHF - 0.8752... Dlr met renewed selling at 0.8749 in Asia on Thur n price easily penetrate Wed's NY low at 0.8734 to a fresh 2-1/4 year trough at 0.8698 in European morning. Later, dlr staged a rally to 0.8764 in NY afternoon, due partly to the selloff in euro b4 trading sideways.
. Looking at the hourly n daily charts, y'day's rally fm a fresh 2-1/4
year trough at 0.8698 together with prominent bullish convergences appearing on hourly indicators suggest MT downtrend fm 2012 peak at 0.9972 has formed a temporary bottom there n as price wud at least retrace the intermediate fall fm 0.9038 (Feb 12 peak), upside bias remains for gain to 0.8828, being the minimum 38.2% r, abv wud extend marginally but res area 0.8859/68 (last Wed's low, now res n 50% r of 0.9038-0.8698 resp.) shud hold today n yield retreat. Looking ahead, a daily close below 0.8698 wud revive bearishness for a resumption of MT fall twds 0.8674 (1.618 times ext. of 0.9156-0.8904 measured fm 0.9082), then 0.8636, being 50% proj. of 0.9839-0.8800 measured fm 0.9156.
. Today, in view of nr term bullish bias, we are holding a long position
entered in NY for gain to 0.8830 n a stop placed at 0.8720. .png)
Posted by: acetraderforex Mar 17, 2014, 10:55 AM
AceTraderFx March 17: Daily Technical Outlook on Major – GBP/USD
WEEKLY TECHNICAL OUTLOOK ON GBP/USD
Last Update At 17 Mar 2014 00:07GMT
Trend Daily Chart
Up
Daily Indicators
Turning down
21 HR EMA
1.6631
55 HR EMA
1.6632
Trend Hourly Chart
Sideways
Hourly Indicators
Rising
13 HR RSI
53
14 HR DMI
+ve
Daily Analysis
Choppy trading to continue
Resistance
1.6745 - Last Mon's high (NZ)
1.6719 - Last Thur's high
1.6686 - Hourly res
Support
1.6605 - Hourly sup
1.6587 - Last Fri's low
1.6568 - Last Wed' 3-week low
. GBP/USD - 1.6635... Although weakness in sterling last week pressured
the pound below previous daily sup at 1.6583 to a 30-week trough of 1.6568,
broad-based short-covering lifted cable to as high s 1.6719 Thur but only to
fall sharply back to as low as 1.6587 Fri b4 staging another bounce.
. Cable's aforesaid strg bounce fm 1.6568 to 1.6719 suggests correction fm
Feb's 4-year peak at 1.6823 has possibly ended there n initial consolidation is
in store this week, abv 1.6719 wud add credence to this view, then price shud
head twd pivotal res at 1.6787, break wud encourage for a re-test of 1.6823 n
later twd 1.6921, this is 61.8% proj. of MT intermediate rise fm 1.6252-1.6823
measured fn 1.6568. On the downside, below 1.6568 wud confirm MT rise fm 2013 3-
year trough at 1.4814 has formed a temporary there, then risk wud shift to the
downside for weakness twd 1.6470, this is 61.8% r of the intermediate rise fm
1.6252-1.6823.
. Today, in view of abv analysis n intra-day neutral outlook on cable, we
are standing aside initially n may trade fm both sides of the market for short
trade. However, as long as Fri's low at 1.6587 holds, price may ratchet higher .png)
Posted by: acetraderforex Mar 21, 2014, 09:53 AM
AceTraderFx March 21: Daily Technical Outlook on Major – USD/JPY DAILY USD/JPY TECHNICAL OUTLOOK
Last Update At 21 Mar 2014 00:50GMT
Trend Daily Chart
Sideways
Daily Indicators
Turning up
21 HR EMA
102.36
55 HR EMA
102.13
Trend Hourly Chart
Near term up
Hourly Indicators
Turning down
13 HR RSI
56
14 HR DMI
+ve
Daily Analysis
Consolidation b4 one more rise
Resistance
103.77 - Mar's high (07)
103.10 - Last Wed's high
102.69 - Wed's high
Support
102.21 - Y'day's low
101.94 - Tue's high, now sup
101.69 - Wed's European morning high
. USD/JPY - 102.38... Despite dlr's rally to 102.69 on Wed after Fed chief Yellen's hawkish comments, dlr retreated to 102.21 ahead of European open as decline in Asian equities led buying of yen. Price rebounded to 102.55 ahead of NY open but later moved sideways inside a narrow range of 102.31-102.54 in NY.
. As mentioned in our previous update, dlr's rally abv Tue's top of 101.94
to as high as 102.69 confirms fall fm Mar's peak at 103.77 has ended at 101.21 last Fri n further 'choppy' trading inside recent established broad range of 100.76-103.77 wud continue. As dlr's rally on Wed suggests consolidation with upside bias remains, stronger gain twd 103.10 (last Wed's high) is envisaged later today or early next week, however, as hourly oscillators wud in o/bot territory on such move, reckon price wud falter below chart res at 103.43 (last Tue's high) n yield strg retreat later.
. Today, we're holding a long dlr position in anticipation of gain to 103.00, however, profit shud be taken on subsequent rise. On the downside, a daily close below 101.94 (previous top, now sup) wud be the 1st signal rebound fm 101.21 has ended, then risk wud shift to the downside for weakness to 101.49/52. .png)
Posted by: acetraderforex Mar 24, 2014, 08:20 AM
AceTraderFx March 24: Weekly Technical Outlook on Major – USD/JPY WEEKLY USD/JPY TECHNICAL OUTLOOK
Last Update At 24 Mar 2014 00:15GMT
Trend Daily Chart
Sideways
Daily Indicators
Turning up
21 HR EMA
102.26
55 HR EMA
102.20
Trend Hourly Chart
Sideways
Hourly Indicators
Turning down
13 HR RSI
45
14 HR DMI
-ve
Daily Analysis
Consolidation b4 one more rise
Resistance
103.77 - Mar's high (07)
103.10 - Mar 12 high
102.69 - Last Wed's high
Support
101.94 - Last Tue's high
101.69 - Last Wed's European morning high
101.21 - Mar 14 low
. USD/JPY - 102.20... Dlr remained under pressure initially last week n retreated fm 101.94 to 101.27 on Tue due to safe-haven buying of yen following the annexation of Crimea by Russia, however, price rallied to 102.69 Wed after Fed's tapering move n hawkish remarks fm Fed chief Yellen b4 dropping back to 102.01.
. Looking at the bigger picture, dlr's nr term rise fm 101.21 (Mar 14 low)
to 102.69 signals the fall fm Mar's peak at 103.77 has ended there earlier n as daily technical indicators are turning up, suggesting further 'volatile' trading abv Feb's bottom at 100.76 wud be seen n with upside bias. Looking ahead, a daily close abv 103.10 (Mar 12 high) wud encourage for a re-test of 103.77 later this month, however, only a firm breach there wud indicate decline fm 105.45 (2013 5-year peak made in Dec) is still being retraced n bring another leg of correction fm 100.76 twd 104.22, bring the equality projection of 100.76-103.77 measured fm 102.21, n then twd 104.50/60.
. Today, as long as 102.01 (reaction low fm 102.69) holds, buying dlr on
dips in anticipation of a re-test of 102.69 is favoured, abv, 103.00/10. Only
below 101.94 (prev. res) wud abort this bullish scenario, risk 101.77, 101.49..png)
Posted by: acetraderforex Mar 26, 2014, 09:43 AM
AceTraderFx March 26: Dailly Technical Outlook on Major –USD/CHF DAILY USD/CHF TECHNICAL OUTLOOK
Last Update At 26 Mar 2014 02:16GMT
Trend Daily Chart
Sideways
Daily Indicators
Turning up
21 HR EMA
0.8830
55 HR EMA
0.8827
Trend Hourly Chart
Sideways
Hourly Indicators
Neutral
13 HR RSI
53
14 HR DMI
+ve
Daily Analysis
Consolidation with downside bias
Resistance
0.8930 - Feb 26 high
0.8895 - Mar 05 high
0.8880 - Y'day's high
Support
0.8788 - Mon's low
0.8769 - Last Tue's high, now sup
0.8729 - Last Wed's Aust. low
. USD/CHF - 0.8845... The greenback swung fm gains to losses in choppy trading
on Tuesday. Despite rising steadily in Europe n a brief break above last week's
high of 0.8869 to 0.8880 in NY due to weakness in eur/usd, intra-day rebound in
euro led to long liquidation in dlr n price retreated strongly to 0.8813.
. Despite dlr's aforesaid rise to a 2-week high of 0.8880, as this lvl was
accompanied by prominent 'bearish divergences' on the hourly oscillators, subse-
quent decline to 0.8813 suggests recent erratic upmove fm Mar's fresh 2-year
trough at 0.8698 has possibly made a temporary top there n 1-2 days of consolida
tion with downside bias is in store, breach of 0.8788 sup wud add credence to
this view, then further weakness to 0.8768 (61.8% r of 0.8698-0.8880) wud follow
, however, below 0.8733 (80.9% r) needed to signal correction is over n yield
re-test of 0.8698 later next week.
. In view of abv analysis, we're turning short on dlr on intra-day recovery
in anticipation of initial weakness twd 0.8788 with stop abv said Tue's high, as
break there wud risk marginal gain to 0.8890/95, however, loss of upward momen-
tum shud prevent strg gain today n daily res at 0.8930 shud remain intact. .png)
Posted by: acetraderforex Mar 28, 2014, 08:50 AM
AceTraderFx March 28: Dailly Technical Outlook on Major –GBP/USD DAILY TECHNICAL OUTLOOK ON GBP/USD
Last Update At 28 Mar 2014 00:10GMT
Trend Daily Chart
Sideways
Daily Indicators
Turning up
21 HR EMA
1.6604
55 HR EMA
1.6578
Trend Hourly Chart
Near term up
Hourly Indicators
Tuning down
13 HR RSI
55
14 HR DMI
+ve
Daily Analysis
Consolidation b4 one more rise
Resistance
1.6719 - Mar 13 high
1.6667 - Mar 17 high
1.6647 - Y'day's high
Support
1.6555 - Y'day's low
1.6509 - Wed's low
1.6460 - Mon's low in NZ
. GBP/USD - 1.6611...Cable continued its recent winning streak Thur n rose
for a 4th day as 'upbeat' U.K. retails sales triggered broad-based buying of
sterling, price jumped fm session low of 1.6555 after the data n climbed to a
1-week high of 1.6647 in NY b4 retreating to 1.6500 in Aust. on profit taking.
. Although y'day's anticipated rally to 1.6647 confirms cable's 1st leg of
correction fm Feb's 4-year peak at 1.6823 has ended earlier at 1.6460 on Mon n
as long as y'day's low at 1.6555 holds, consolidation with mild upside bias
still remains for gain twd 'dynamic' obj. at 1.6684, this is 61.8% r of said dec
line fm 1.6823-1.6460, however, as hourly oscillators wud display 'bearish diver
ging signals' on sch move, reckon upside wud falter well below res at 1.6719 n
risk has increased for a strg retreat to occur later today or Mon. Looking ahead
, only a daily close abv 1.6719 wud retain bullish prospect of further headway
to 'pivotal res at 1.6787 next week.
. Today, we're holding a long position in anticipation of one more rise n
profit sud be taken on next upmove. On the downside, a daily close below 1.6555
anytime wud signal correction fm 1.6460 ha ended n yield weakness twd 1.6509. .png)
Posted by: acetraderforex Apr 11, 2014, 09:42 AM
AceTraderFx Apr 11: Daily Technical Outlook on Major - USD/JPY DAILY USD/JPY TECHNICAL OUTLOOK
Last Update At 10 Apr 2014 23:51GMT
Trend Daily Chart
Sideways
Daily Indicators
Falling
21 HR EMA
101.59
55 HR EMA
101.88
Trend Hourly Chart
Down
Hourly Indicators
Falling
13 HR RSI
36
14 HR DMI
-ve
Daily Analysis
Consolidation with downside bias
Resistance
102.74 - Tue's Asian morning low
102.16 - Wed's high
101.97 - Y'day's NY morning high
Support
101.33 - Y'day's low
101.21 - Mar 14 low
100.76 - Feb 04 low
. USD/JPY - 101.38... Wed's dovish FOMC minutes had kept dlr under pressure on Thur n price retreated fm 102.14 at Asian open to 101.42 in European morning. Later, dlr recovered to 101.97 after solid U.S. jobless claims but only to fall to a fresh 3-wk low at 101.33 on risk aversion due to selloff in U.S. equities.
. As mentioned in previous update, dlr's decline fm last Fri's high at 104.13 (post-NFP peak) to as low as 101.55 on Tue n then 101.33 y'day signals 'choppy' trading below 2013 Dec's 5-year peak at 105.45 wud continue n as daily oscillators are falling, suggesting price is en route twd key sup at 100.76 (reaction low in Feb) where a break there wud indicate LT uptrend fm 2011 record bottom at 75.32 is still being retraced n further weakness to 99.60 wud be seen later this month, being a 'natural' 50% r of the intermediate MT rise fm 93.75-105.45. On the upside, only a daily close abv 103.00 wud suggest price remains confined inside recent 100.76-104.13 broad range n yields gain to 103.45/55.
. Today, as price is still trading below the 21-hr n 55-hr emas, selling dlr on recovery for further weakness to 101.00 is favoured n only a daily close abv 102.16 (Wed's high) wud indicate a temporary low is made, risk 102.50/60. .png)
Posted by: acetraderforex Apr 22, 2014, 03:46 AM
AceTraderFx Apr 22: Daily Market Outllook on Major -EUR/USD DAILY MARKET OUTLOOK on Major -EUR/USD
Update Time: 22 Apr 2014 00:52 GMT
EUR/USD - 1.3791
Yesterday's anticipated breach of last week's low at 1.3790 to 1.3787 in holiday-thinned New York session confirms recent decline from April's high at 1.3906 has resumed and expect initial consolidation before aforesaid fall pressures euro to 1.3761 (being 61.8% r of the early rise from 1.3672-1.3906), however, loss of downward momentum is likely to keep price above 1.3748 (previous res, now sup).
On the upside, only a firm rise back above Monday's high at 1.3831 would signal temporary low is in place, however, reckon res at 1.3865 would remain intact.
Posted by: acetraderforex Apr 25, 2014, 03:29 AM
AceTraderFx April 25: Daily Market Outlook on USD/JPY DAILY MARKET OUTLOOK USD/JPY - 102.40
Update Time: 25 Apr 2014 01:44 GMT
Despite yesterday's retreat to 102.09, subsequent rebound in Asian morning suggests dollar's choppy consolidation below Wednesday's high at 102.73 is likely to continue with neutral bias. A breach of 102.73 would confirm erratic up move from April's low at 101.32 has once again resumed and extend gain to 103.06, however, loss of momentum should cap price at 103.39/40 today.
On the downside, a breach of 101.86 would indicate the recovery from 101.32 is over instead and weakness to 101.50 and 101.32 would follow.
Posted by: acetraderforex Apr 29, 2014, 07:35 AM
AceTraderFx Apr 29: Daily Outlook on USD/JPY DAILY MARKET OUTLOOK USD/JPY - 102.49
Update Time: 29 Apr 2014 00:42 GMT
As U.S. dollar rebounded after finding renewed buying at 102.04 on Monday in part due to renewed cross selling in Japanese yen, suggesting the pullback from last Tuesday's high at 102.73 has possibly ended at 101.96 last Friday and a breach of aforesaid resistance would confirm up move from April's low at 101.32 to retrace decline from April's 2-1/2 month peak at 104.13 has resumed, yield further gain to 103.06 (61.8% r).
On the downside, only a breach of 101.86/91 support area would prolong recent choppy consolidation and may risk weakness to 101.50 but 101.32 support would hold initially.
Posted by: acetraderforex May 2, 2014, 03:47 AM
AceTraderFx May 2: Daily Outlook on Major USD/JPY DAILY MARKET OUTLOOK USD/JPY - 102.28
Update Time: 02 May 2014 00:13 GMT
The greenback traded narrowly on Thursday after Wednesday's strong retreat from 102.67 to 102.03, however, as aforesaid sell off suggests recent up move from April's low at 101.32 has formed a temporary top at 102.79 on Tuesday 102.79, choppy consolidation with downside bias would be seen and weakness towards 101.96 support (last Friday's low) is likely, below would bring stronger pullback to 101.60/70, however, as broad outlook remains consolidative, April's low at 101.32 should hold from here and yield further choppy gyrations.
On the upside, only a breach of 102.67 would turn outlook bullish for another corrective rise to 103.06, being 61.8% retracement of 104.13-101.32, however, reckon upside would be limited to 103.30/40.
Posted by: acetraderforex May 7, 2014, 03:33 AM
Acetraderfx May 7: Daily Recommendations on Major USD/JPY DAILY OUTLOOK ON USD/JPY - 101.75
Update Time: 07 May 2014 00:02 GMT
Yesterday's sell off below Monday's low at 101.86 to 101. 50 suggests erratic decline from Apr's high at 104.13 has possibly resumed n a re-test of Apr's low at 101.32 is envisaged.
Below would extend weakness to 101.00 but key daily sup at 100.76 (Feb) would hold.
Sell on pull back with stop as indicated and only above yesterday's 102.19 high would risk gain to 102.56.
Posted by: acetraderforex May 13, 2014, 10:31 AM
AceTraderFx May 13: Daily Technical Outlook on GBP/USD DAILY TECHNICAL OUTLOOK ON GBP/USD
Last Update At 13 May 2014 00:30GMT
Trend Daily Chart
Up
Daily Indicators
Turning down
21 HR EMA
1.6872
55 HR EMA
1.6885
Trend Hourly Chart
Sideways
Hourly Indicators
Neutral
13 HR RSI
50
14 HR DMI
0
Daily Analysis
Consolidation b4 one more fall
Resistance
1.6975 - Last Thur's high
1.6938 - Last Fri's high
1.6916 - Last Fri's Asian low (now res)
Support
1.6832 - Last Fri's low
1.6821 - May 03 low
1.6792 - Apr 29 low
. GBP/USD - 1.6873.. Although cable found support at 1.6840 in NZ on Mon n then ratcheted higher to 1.6903 in European morning due partly to cross-buying in sterling. Renewed dlr's broad-based firmness checked intra-day gain n cable later retreated to 1.6863 in NY session.
. Looking at the hourly n daily charts, cable's rebound fm 1.6840 to 1.6903
y'day suggests choppy trading abv last Fri's low at 1.6832 wud be seen but as sell off fm last Tue's near 5-year peak at 1.6996 indicates MT uptrend fm 2013 trough (Jul) at 1.4814 has possibly made a temporary top there, 1.6916 (prev. sup, now res) shud hold n downside bias remains for re-test of said sup. Below 1.6821 (May 3 low) anytime wud add credence to this view n further decline to 1.6791/92, being the 'minimum' 38.2% r of intermediate rise of 1.6460-1.6996 n Apr 29 low respectively, wud follow but prominent 'bullish convergences' on the hourly oscillators on such a move shud keep price abv 1.6762 (Apr 23 low).
. In view of abv analysis, trading cable is cautiously favoured n only abv
1.6938 (last Fri's high) wud dampen present mildly bearish scenario on cable n risk stronger retracement to 1.6970/75 b4 prospect of retreat. 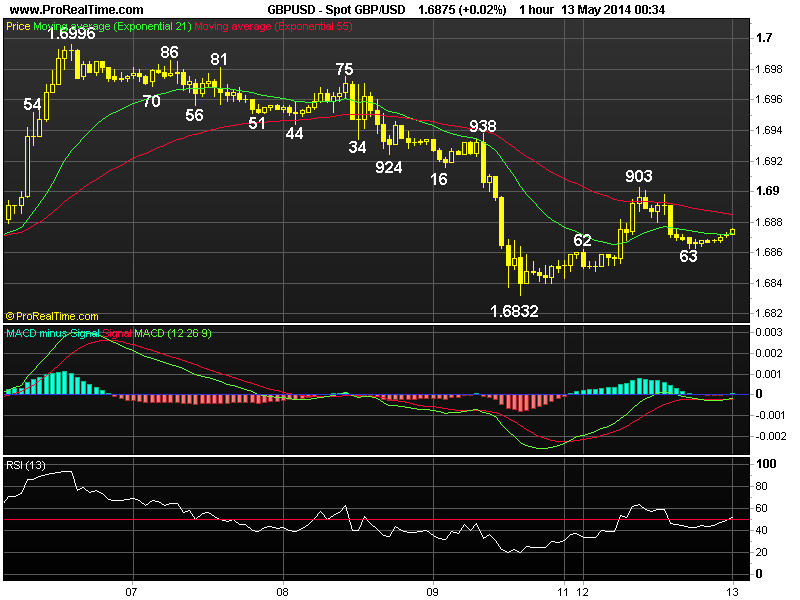
Posted by: acetraderforex May 14, 2014, 09:00 AM
AceTraderFx May 14: Daily Technical Outlook on USD/CHF DAILY USD/CHF TECHNICAL OUTLOOK
Last Update At 14 May 2014 00:13GMT
Trend Daily Chart
Sideways
Daily Indicators
Rising
21 HR EMA
0.8893
55 HR EMA
0.8874
Trend Hourly Chart
Up
Hourly Indicators
Bearish divergences
13 HR RSI
60
14 HR DMI
+ve
Daily Analysis
Marginal rise b4 retreat
Resistance
0.8953 - Apr 04 high
0.8927 - Apr 03 high
0.8909 - Y'day's high
Support
0.8859 - Mon's low
0.8802 - Last Fri's European ow
0.8766 - Last Thur's Asian high (now sup)
. USD/CHF - 0.8899... Although the greenback traded sideways in Asia y'day n briefly edged lower to 0.8866 in early European morning, price rose to session high at 0.8907 on euro's weakness, dlr retreated to 0.8882 in NY morning after weaker-than-expected U.S. retail sales b4 climbing to a 1-month high of 0.8909.
. Looking at the hourly n daily charts, dlr's rally fm last Thur's low at
0.8703 n y'day's breach of Mon's high at 0.8881 suggests further choppy trading abv Mar's 2-year low at 0.8698 wud continue with upside bias n gain twds res at 0.8927 wud be seen, however, 'bearish divergences' onthe hourly indicators shud prevent strg gain n reckon key res at 0.8953 (reaction high fm 0.8698) wud cap upside this week n bring another fall later. On the downside, only a daily close below 0.8802 (Fri's Asian low) wud defer bullishness n signal the corrective rise fm 0.8703 has formed a temporary top instead n risk subsequent weakness to 0.8766 (previous res, now sup).
. Today, in view of abv analysis, we're buying dlr on dips for one more
rise or sell if price climbs to 0.8920/30 1st for a long-overdue retracement to
0.8860 but sup 0.8802 shud remain intact n yield another upmove next week.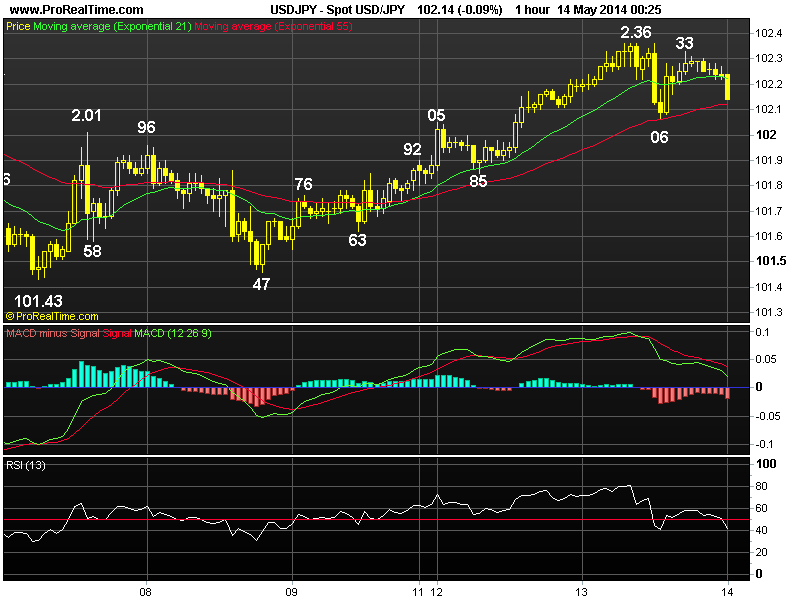
Posted by: acetraderforex May 19, 2014, 08:22 AM
AceTraderFx May 19: Weekly Technical Outlook on USD/JPY WEEKLY USD/JPY TECHNICAL OUTLOOK
Last Update At 18 May 2014 23:15GMT
Trend Daily Chart
Sideways
Daily Indicators
Falling
21 HR EMA
101.53
55 HR EMA
101.64
Trend Hourly Chart
Down
Hourly Indicators
Turning up
13 HR RSI
51
14 HR DMI
+VE
Daily Analysis
Consolidation b4 one more fall
Resistance
102.36 - Mon's high
102.12 - Last Thur's high
101.68 - Last Fri's high
Support
101.31 - Last Thur's low
101.20 - Mar 03 low
100.76 - Feb 04 low
. USD/JPY - 101.55.. Despite dlr's initial gain to 102.36 last Tue, weakness in the Nikkei n falling U.S. treasury yields triggered broad-based buying of yen, the pair fell to a near 2-month trough of 101.31 b4 staging a recovery.
. On the daily picture, dlr's brief drop to 101.31 suggests the broad side-ways move inside recent established broad range of 101.32-103.02 has possibly ended with a downside break, a firm breach of 101.31/32 sup wud add credence to this bearish view, then decline fm 104.13 (Apr's high) wud pressure dlr twd 2014 bottom at 100.76 in Feb., below there anytime wud confirm MT decline fm Jan's 5-year peak at 105.45 has finally resumed n yield weakness twd 99.60 in Jun, this is a 'natural' 50% r of the LT intermediate uptrend fm 93.75-105.45. So selling dlr on recovery is the way to go (our weekly strategy is currently holding a short position). Only abv 102.36 prolongs consolidation, risks gain twd 103.02.
. Today, although Fri's rebound fm 101.36 to 101.36 suggests choppy trading abv said last Thu's 101.31 low wud continue, as long as 101.84 (50% r fm 102.36) holds, one more fall to 101.00/10 is likely. Only abv 102.12 aborts, 102.36.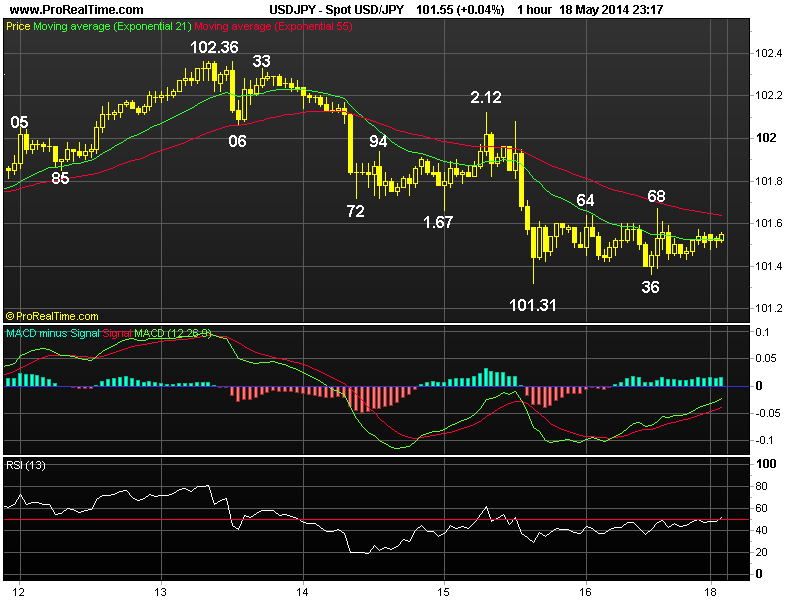
Posted by: acetraderforex May 21, 2014, 03:00 AM
AceTraderFx May 21: Daily Market Outlook on USD/JPY DAILY MARKET OUTLOOK on USD/JPY - 101.27
Update Time: 21 May 2014 01:24 GMT
Dollar retreated after meeting renewed selling at 101.60 in Asian morning on Tuesday suggests the recovery from Monday's fresh 3-1/2 month high at 101.10 has possibly ended and erratic decline from April's high at 104.13 should resume for weakness to said level, below would encourage for a re-test of this year's low at 100.76 (February).
On the upside, only above 101.83 (being 38.2% are of intermediate decline from 103.02) would signal temporary low is made and risk stronger bounce to 102.12 and 102.36 resistance.
Posted by: acetraderforex May 22, 2014, 10:14 AM
AceTraderFx May 22: Daily Technical Outlook on USD/JPY
DAILY USD/JPY TECHNICAL OUTLOOK
Last Update At 22 May 2014 00:45GMT
Trend Daily Chart
Sideways
Daily Indicators
Rising
21 HR EMA
101.34
55 HR EMA
101.34
Trend Hourly Chart
Sideways
Hourly Indicators
Rising
13 HR RSI
60
14 HR DMI
+ve
Daily Analysis
Consolidation b4 decline resumes
Resistance
102.36 - Last Tue's high
102.12 - Last Thur's high
101.63 - Y'day's high
Support
101.10 - Mon's low
100.81 - Y'day's fresh 3-1/2 month low
100.76 - Feb 04 low
. USD/JPY - 101.45 ... Although dlr fell fm Tue's Asian 101.60 high to a
fresh 3-1/2 month low at 100.81 in European morning on Wed after BoJ refrained
fm adding further stimulus measures, usd's broad-based rebound in NY lifted
price to 101.55 n then climbed to 101.63 after FOMC minutes b4 easing.
. Looking at the hourly n daily charts, dlr's rebound after y'day's exten-
sion of decline fm Apr's peak at 104.13 to 100.81 suggests a temporary low has
been made n a few days of choppy trading abv 2014 bottom at 100.76 (Feb 04 low)
is in store, however, reckon res at 102.12 wud cap present rebound n another dec
line is still envisaged after consolidation. Below 100.76/81 anytime wud confirm
MT decline fm Jan's 5-year peak at 105.45 has finally resumed n yield weakness
twd 99.60 in Jun, this is a 'natural' 50% r of the LT intermediate uptrend fm
93.75-105.45.
. In view of abv analysis, we're turning long on dips today in anticipation
of further gain to 101.90/00 but aforesaid res at 101.12 shud remain intact. On
the downside, only below 100.76/81 wud abort near term bullish bias on the dlr n
risk weakness to 100.20/30 b4 correction occurs.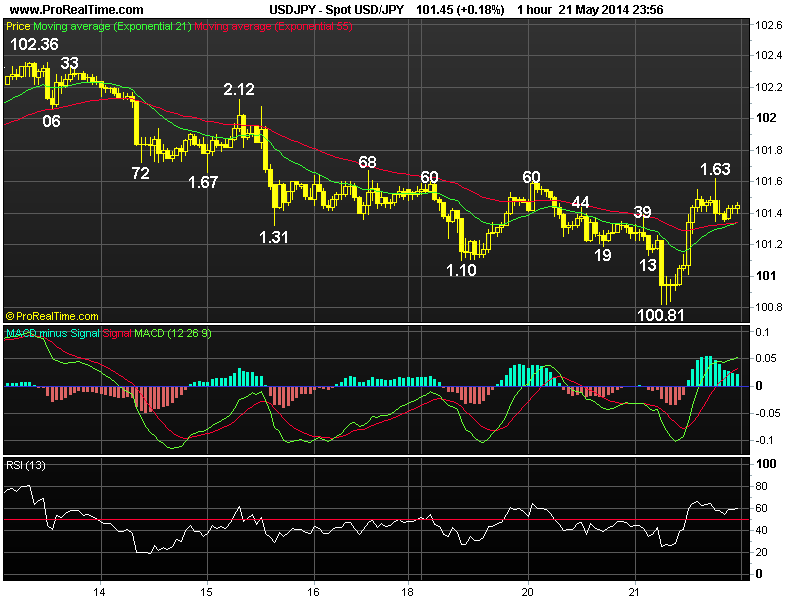
Posted by: acetraderforex May 26, 2014, 10:48 AM
AceTraderFx May 26: Weekly Technical Outlook on EUR/USD WEEKLY TECHNICAL OUTLOOK ON EUR/USD
Last Update At 25 May 2014 23:26GMT
Trend Daily Chart
Sideways
Daily Indicators
Falling
21 HR EMA
1.3634
55 HR EMA
1.3650
Trend Hourly Chart
Down
Hourly Indicators
Rising fm o/s
13 HR RSI
41
14 HR DMI
-ve
Daily Analysis
Consolidation b4 decline resumes
Resistance
1.3734 - Last Tue's high
1.3688 - Last Wed's NY res n Y'day's high
1.3653 - Last Fri's Asian high
Support
1.3615 - Intra-day fresh 3-month low in NZ
1.3563 - Feb 27 low
1.3518 - 38.2% r 1.2745-1.3995
. EUR/USD - 1.3628... Although euro gained respite initially last week b4 falling again on renewed cross-selling in euro, price penetrated previous 1.3648 low to 1.3635 Wed. Despite a brief recovery, euro tanked on downbeat German & EZ mfg & services PMIs, price weakened to a fresh 3-year trough of 1.3616 on Fri.
. Looking at the daily picture, last week's breach of 1.3648 to 1.3616 confirms decline fm May's 2-1/2 year peak at 1.3995 has once again resumed n this move signals uptrend fm 2012 bottom (Jul) has made a top there, the single currency is en route to 1.3518, this is a 'minimum' 38.% r of the intermediate rise fm 1.2745 to 1.3995, then next daily chart obj. at 1.3477 (2014 low in Feb), having said that, as daily indicators wud be in oversold territory on such move, reckon 1.3370 (50% r fm 1.2745) wud contain weakness. So selling on recovery in anticipation of decline to aforesaid downside targets is recommended n only a daily close abv 1.3734 wud dampen present bearish scenario on euro.
. Today, euro briefly weakened to 1.3615 in NZ after preliminary European Parliament elections were announced n with price currently trading below 21-hr n 55-emas, selling on recovery is recommended n only abv 1.3653/59 risks 1.3688. 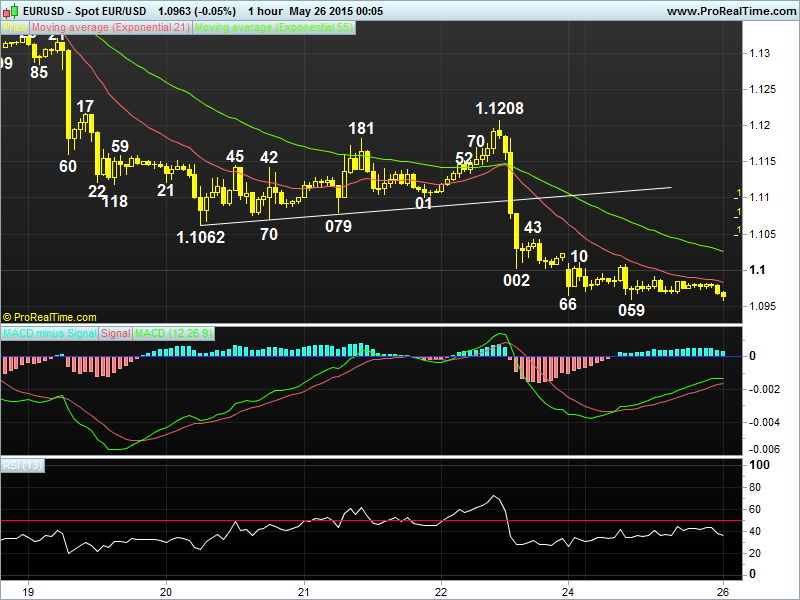
Posted by: acetraderforex May 27, 2014, 10:25 AM
AceTraderFx May 27: Daily Technical Outlook on USD/JPY DAILY USD/JPY TECHNICAL OUTLOOK
Last Update At 26 May 2014 23:22GMT
Trend Daily Chart
Sideways
Daily Indicators
Turning up
21 HR EMA
101.91
55 HR EMA
101.84
Trend Hourly Chart
Near term up
Hourly Indicators
Neutral
13 HR RSI
53
14 HR DMI
+ve
Daily Analysis
Consolidation with upside bias
Resistance
102.86 - 61.8% r of 104.13-100.81
102.36 - May 13 high
102.12 - May 15 high
Support
101.60 - Last Fri's low
101.35 - Hourly sup
101.10 - Mon's low
. USD/JPY - 101.92 ... Although the greenback climbed marginally abv Fri's 102.01 high to 102.05 shortly after Asian open on Mon due to initial gain in the Nikkei, cross-unwinding in yen quickly pushed price lower, dlr retreated to 101.87 n later to 101.84 in holiday-thinned North American session.
. Let's look at daily picture, as mentioned in prev. update, dlr's rebound fm last Wed's fresh 3-1/2 month trough at 100.81 to as high as 102.02 signals decline fm Apr's peak at 104.13 has indeed formed a temporary trough there n further choppy trading abv 2014 bottom at 100.76 (Feb 04 low) is in store with upside bias for gain to next chart obj. at 102.36, n then perhaps twd 102.86, being a 'dynamic' 61.8% r of the entire fall fm 104.13 to 100.81, however, as hourly oscillators wud display 'bearish divergences' on such a move, price shud falter below daily res at 103.02 (May's high) this week n yield strg retreat.
. Today, y'day's narrow movement shud spill into Asian morning session n consolidation below 102.05 wud continue, reckon Fri's low at 101.60 wud contain pullback n yield resumption of said near term upmove fm 100.81, bearish divergences on hourly indicators shud cap price below 102.47 (50% r fm 104.13-100.81).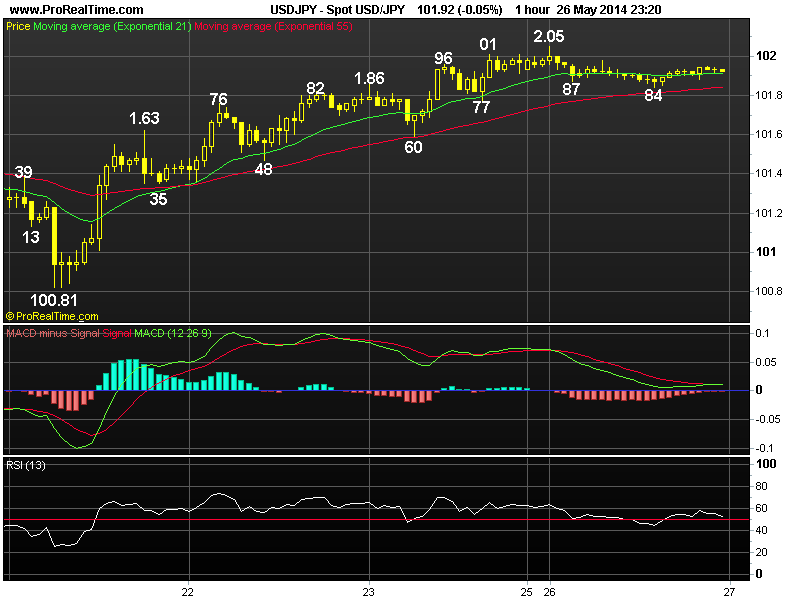
Posted by: acetraderforex May 28, 2014, 04:50 AM
AceTraderFx May 28: Daily Market outlook on USD/JPY DAILY MARKET OUTLOOK USD/JPY - 101.93
Update Time: 28 May 2014 01:33GMT
The greenback extended up move from last Wednesday's 3-1/2 month low at 100.81 to 102.14 on improved risk appetite due to dollar's broad-based strength after the release of robust U.S. economic data, suggesting a stronger retracement of decline from April's high at 104.13 would be seen and further gain to 102.36 resistance is envisaged, however, reckon 102.86 should cap upside and yield retreat later.
On the downside, only a breach of 101.60 support would signal the recovery is over instead and may bring weakness to 101.35 support level.
Posted by: acetraderforex May 29, 2014, 10:09 AM
AceTraderFx May 29: Daily Technical Outlook on GBP/USD
DAILY TECHNICAL OUTLOOK ON GBP/USD
Last Update At 29 May 2014 00:30GMT
Trend Daily Chart
Sideways
Daily Indicators
Falling
21 HR EMA
Rising fm o/s
55 HR EMA
29
Trend Hourly Chart
Down
Hourly Indicators
Rising fm o/s
13 HR RSI
1.6736
14 HR DMI
1.67
Daily Analysis
Resumption of recent decline
Resistance
1.6816 - Y'day's high
1.6782 - Tue's low, now res
1.6732 - May 16 low, now res
Support
1.6697 - Y'day's 5-week low
1.6657 - Apr 15 low
1.6624 - 50% r of 1.6252-1.6997
. GBP/USD - 1.6717... Cable came under renewed selling in Asia at 1.6816 Wed n fell to 1.6761 at European open. Intra-day decline continued after data showed growth in U.K. retail slowed in May n price subsequently tumbled to a 6-week low of 1.6697 in NY morning b4 staging a minor rebound on short covering.
. Looking at the daily chart, y'day's breach of previous May's low at 1.6732 n daily close below there confirms a major top has been formed at May's near 5-year peak at 1.6997 (Reuters) n price is en route to 1.6560 in June, this is a 'minimum' 38.2% r of the intermediate MT rise fm 1.5854-1.6997. Having said that , as daily oscillators wud be o/sold territory on such a move, daily sup at 1.6460 (Mar 24 low in NZ) shud contain weakness. Therefore, trading cable fm short side is favoured, however, one shud look to take profit on next decline as the hourly oscillators wud display bullish convergences on next decline, suggesting sharp fall is unlikely to be seen n reckon 1.6624, this is the 'natural' 50% r of intermediate rise of 1.6252-1.6997, wud hold n yield rebound later.
. Today, expect weakness to 1.6555 n only abv 1.6782 wud indicate temporary low is made, risk stronger retracement twd 1.6813/16 b4 another fall next week.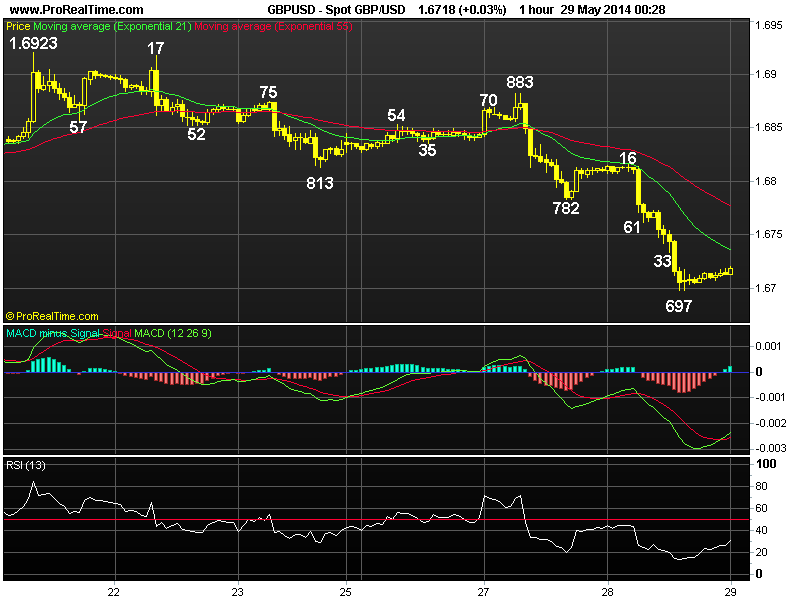
Posted by: acetraderforex May 30, 2014, 03:30 AM
wrong thread
Posted by: acetraderforex May 30, 2014, 09:47 AM
AceTraderFx May 30: Daily Technical Outlook & Trading Ideals on USD/JPY DAILY USD/JPY TECHNICAL OUTLOOK
Last Update At 29 May 2014 23:47GMT
Trend Daily Chart
Sideways
Daily Indicators
Turning up
21 HR EMA
101.70
55 HR EMA
101.76
Trend Hourly Chart
Sideways
Hourly Indicators
Turning up
13 HR RSI
53
14 HR DMI
+ve
Daily Analysis
Consolidation b4 one more rise
Resistance
102.36 - May 13 high
102.14 - Tue's high
101.89 - Hourly res
Support
101.43 - Y'day's low
101.10 - May 19 low
100.81 - Last Wed's fresh 3-1/2 month low
. USD/JPY - 101.74... The greenback weakened on Thur n ratcheted lower fm Australian high of 101.87 to 101.47 in European morning due to broad-based buying of yen. Price briefly fell to a fresh session low of 101.43 in NY morning after mixed U.S. economic data b4 staging a rebound to 101.79.
. Looking at the hourly n daily charts, although y'day's breach of 101.64 sup signals recent upmove fm last Wed's fresh 3-1/2 month trough at 100.81 has formed a temporary top there, subsequent rebound signals pullback has possibly ended n as long as 101.43 sup holds, upside bias remains for aforesaid upmove to resume, abv 101.98 wud add credence to this view as hourly macd wud have cut abv zero line on such move, then dlr will be en route to next daily chart obj. at 102.36.(May 13 high), n later to 102.86 next week, this is the 'dynamic' 61.8% r of the entire fall fm 104.13 to 100.81, in early Jun, however, as broad outlook remains consolidative, daily res at 103.02 (May's high) wud hold.
. In view of abv analysis, trading dlr fm long side is still the favoured strategy today n only a daily close below 101.30 wud abort present bullish scenario n risk stronger retreat to 101.00.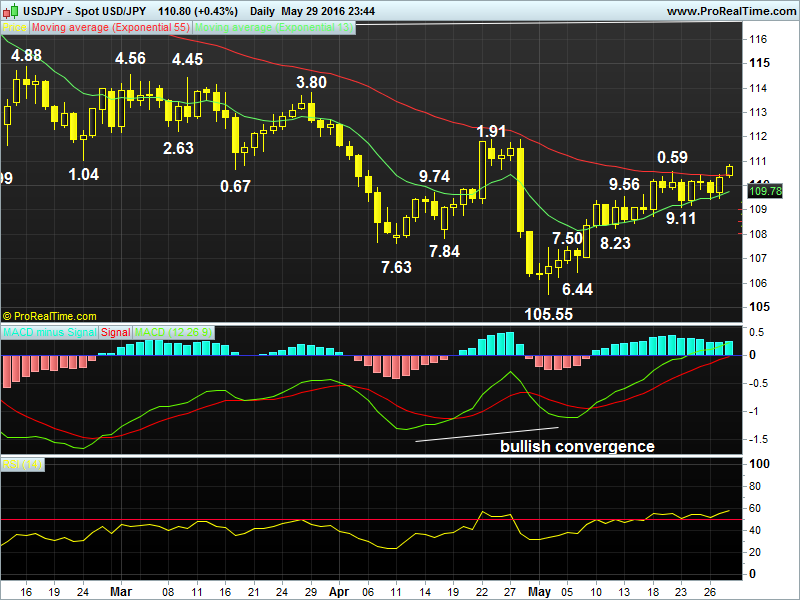
Posted by: acetraderforex Jun 3, 2014, 09:08 AM
AceTraderFx Jun 3: Daily Technical Outlook & Trading Ideals on EUR/USD DAILY TECHNICAL OUTLOOK ON EUR/USD
Last Update At 03 Jun 2014 00:14GMT
Trend Daily Chart
Down
Daily Indicators
Falling
21 HR EMA
1.3605
55 HR EMA
1.3612
Trend Hourly Chart
Sideways
Hourly Indicators
Falling
13 HR RSI
38
14 HR DMI
-ve
Daily Analysis
Consolidation b4 decline resumes
Resistance
1.3688 - May 22 high
1.3669 - Last Tue's high
1.3650 - Last Fri's high
Support
1.3586 - Last Thur's 3-1/2 month low
1.3563 - Feb 27 low
1.3518 - 38.2% r 1.2745-1.3995
. EUR/USD - 1.3594... Euro remained under pressure on Mon due to growing speculation ECB will loosen policy at its meeting Thur, price retreated fm 1.3643 (AUS) to 1.3594 in European morning n then further to 1.3588 in NY afternoon after Germany showed that the annual inflation slowed in May b4 recovering.
. Looking at the hourly n daily charts, y'day's decline fm 1.3643 to 1.3588 confirms the recovery fm last Thur's 3-1/2 month bottom at 1.3586 has ended earlier at 1.3650 last Fri n re-test of said sup is seen, break wud indicate MT uptrend fm 1.2042 (2012 low) has formed a top at May's 2-1/2 year peak at 1.3995 n as daily indicators are falling, price is en route to 1.3249 later this month, this is the 'minimum' 38.2% r of aforesaid entire rise fm 1.2042. However, euro shud hold well abv 1.3105 (Sep 13') n yield strg rebound later.
. Today, as long as 1.3650 holds, selling euro on recovery for resumption of decline to 1.3540/50 is favoured, however, as hourly oscillators' readings wud display 'bullish convergences' on next decline, reckon 1.3518 (38.2% r of intermediate rise of 1.2745-1.3995) shud remain intact. Only abv 1.3650wud indicate a temporary low is in place n risk retracement to 1.3384/88 b4 down.
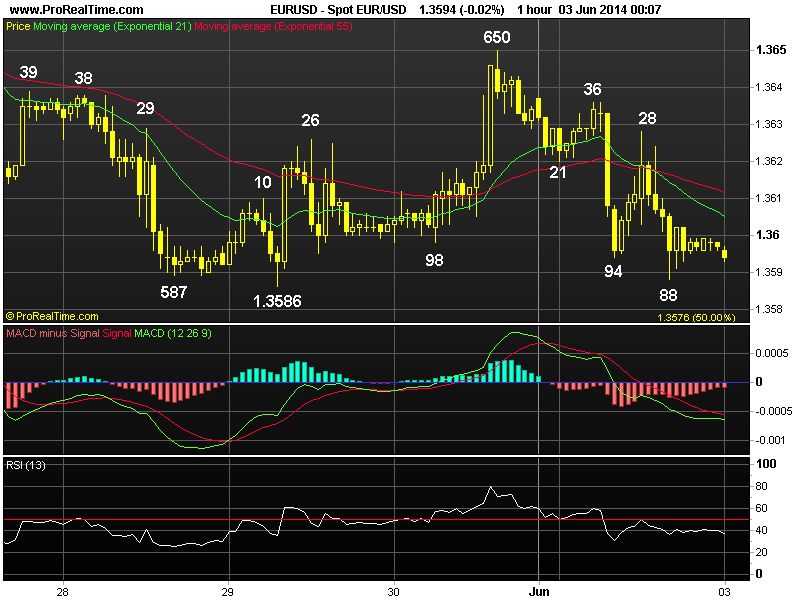
Posted by: acetraderforex Jun 5, 2014, 08:28 AM
AceTraderFx Jun 5: Daily Technical Outlook & Trading Ideals on USD/JPY DAILY USD/JPY TECHNICAL OUTLOOK
Last Update At 04 Jun 2014 23:38GMT
Trend Daily Chart
Sideways
Daily Indicators
Turning up
21 HR EMA
102.65
55 HR EMA
102.50
Trend Hourly Chart
Near term up
Hourly Indicators
Bearish divergecnes
13 HR RSI
55
14 HR DMI
+ve
Daily Analysis
Consolidation b4 marginal rise
Resistance
103.58 - 1.618 times extn of 100.81-102.14 fm 101.43
103.02 - May 02 high
102.80 - Y'day's 1-month high
Support
102.27 - Tue's low
102.14 - Last Tue's high, now sup
101.79 - Prev. res, now sup
. USD/JPY - 102.68... Although dlr retreated fm Asian fresh 1-month peak at 102.80 on Wed n then dropped to 102.44 in NY morning due to downbeat U.S. ADP private payrolls report, price rebounded to 102.75 as release of upbeat U.S. Service ISM boosted demand for the greenback b4 moving sideways in NY session.
. Looking at the hourly n daily charts, dlr's rebound after meeting renewed buying at 102.44 suggests pullback fm y'day's high of 102.80 has ended there n upside bias remains for upmove fm May's 3-1/2 month low at 100.81 to retrace erratic fall fm 104.13 (Apr) to resume n extend to 103.02, being May's high, how ever, as prominent 'bearish diverging signals' wud appear on hourly indicators on such move, strg gain unlikely to be seen n reckon price shud falter well below 103.58, this is the 1.618 times extension of 100.81-102.14 measured fm 101.43, n risk has increased for a much-needed correction to occur later.
. In view of abv mildly bullish outlook, we are holding our daily long position in anticipation of one more rise twd 103.15/20 today n only below 102.14 (prev. res, now sup) wud signal temporary top is made n risk a long-overdue retracement twd 101.79 b4 prospect of another rise next week.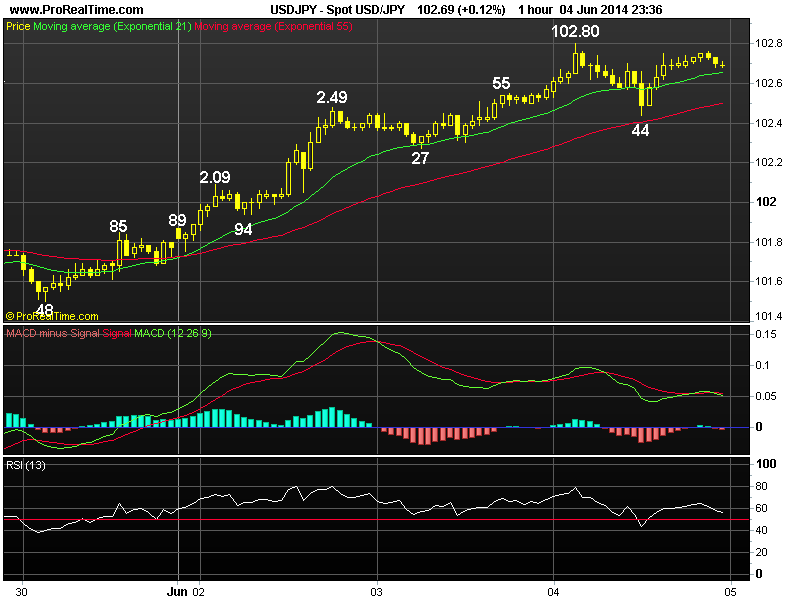
Posted by: acetraderforex Jun 6, 2014, 03:24 AM
AceTraderFx Jun 6: Daily Market Outlook on EUR/USD Daily Market Outlook on EUR/USD - 1.3659
Update Time: 06 Jun 2014 01:01GMT
Despite Thursday's sell off to a near 4-month trough of 1.3503 after ECB's bold stimulus measures, intra-day swift rally due to active short-covering and subsequent strong gain above 1.3650 res to 1.3670 confirms euro's decline from May's near 2-1/2 year peak at 1.3995 has formed a temporary low there and several days of choppy consolidation with upside bias is envisaged.
As long as 1.3586 (previous sup) holds, further gain to 1.3690/00 is expected later today, however, near term overbought condition should cap euro's upside below res at 1.3734 today.
Posted by: acetraderforex Jun 9, 2014, 08:09 AM
AceTraderFx Jun 9: Weeky Technical Outlook & Trading Ideals on EUR/USD WEEKLY TECHNICAL OUTLOOK ON EUR/USD
Last Update At 08 Jun 2014 23:54GMT
Trend Daily Chart
Down
Daily Indicators
Turning up
21 HR EMA
1.3643
55 HR EMA
1.3634
Trend Hourly Chart
Near term up
Hourly Indicators
Neutral
13 HR RSI
54
14 HR DMI
+ve
Daily Analysis
Consolidation with downside bias
Resistance
1.3734 - May 19 high
1.3691 - 38.2% r of 1.3995-1.3503
1.3677 - Last Fri's 2-week high
Support
1.3622 - Last Fri's low
1.3586 - May 29 low
1.3569 - 61.8% r of 1.3503-1.3677
. EUR/USD - 1.3647... The single currency remained under pressure initially last week due to mounting speculation of 'bold' stimulus measures fm the ECB. Although euro briefly tumbled to a near 4-month trough of 1.3503 after anticipated ECB's action, short-covering lifted price to 1.3670, then 1.3677 on Fri.
. Let's look at the daily picture 1st, although euro's aforesaid rally fm last Thur's 1.3503 low confirms the decline fm May's 2-1/2 year peak at 1.3995 has finally formed a temporary low there n several days of choppy consolidation is expected this week, as long as 1.3586 (previous low n also good sup) holds, mild upside bias remains for price to stage a corrective rise to 1.3691, this is the 'minimum' 38.2% r of the entire fall fm 1.3995-1.3503, however, as hourly oscillators' readings wud display 'bearish divergences' on such a move, strg gain beyond there is not envisaged n reckon euro wud hold below below previous daily res at 1.3734 (May 19 high) n bring another decline later this week.
. Today, Fri's retreat fm 1.3677 signals 1st leg of correction fm 1.3503 has ended n as many European centres are closed for Whit Monday holiday, consolidation is in store, so trading euro on both sides of the market is favoured.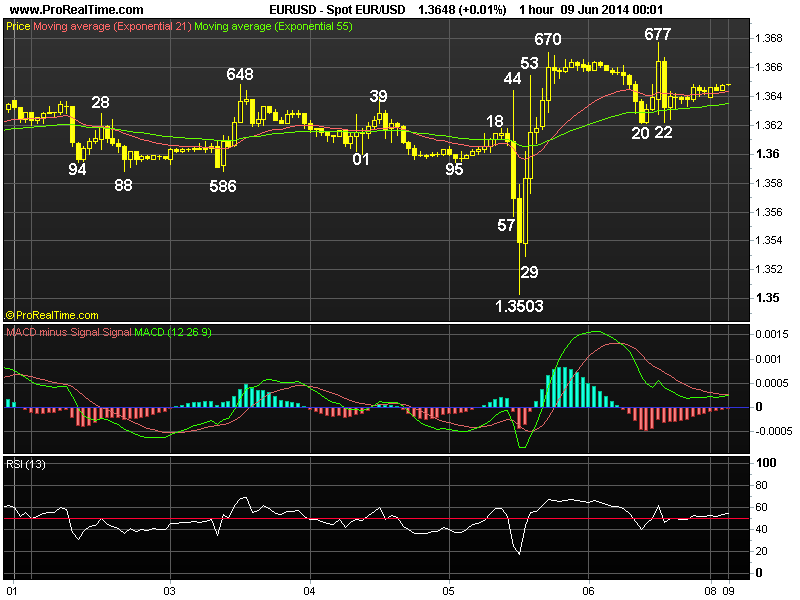
Posted by: acetraderforex Jun 10, 2014, 09:03 AM
AceTraderFx Jun 10: Daily Technical Outlook & Trading Ideals on USD/JPY DAILY USD/JPY TECHNICAL OUTLOOK
Last Update At 09 Jun 2014 23:57GMT
Trend Daily Chart
Sideways
Daily Indicators
Rising
21 HR EMA
102.51
55 HR EMA
102.48
Trend Hourly Chart
Sideways
Hourly Indicators
Neutral
13 HR RSI
48
14 HR DMI
-ve
Daily Analysis
Consolidation b4 one more rise
Resistance
103.58 - 1.618 times extn of 100.81-102.14 fm 101.43
103.02 - May 02 high
102.80 - Last Wed's 1-month high
Support
102.38 - Y'day's low
102.11 - Last Fri's low
101.94 - Last Mon's European low
. USD/JPY - 102.49... Although dlr retreated after an initial marginal gain to 102.65 in Asian morning, price retreated as the release of upbeat Japan GDP boosted demand for yen. Later, dollar weakened to 102.38 in European morning n then rebounded to 102.59 in NY morning b4 moving sideways in quiet NY afternoon.
. Looking at the hourly n daily charts, dlr's strg rebound fm Fri's low at 102.11 to 102.65 y'day signals pullback fm last Wed's fresh 1-month peak at 102.80 has ended there n as the daily technical indicators are rising, suggesting upside bias remains for recent erratic upmove fm May's 3-1/2 month low at 100.81 to resume n extend to 102.86 n then 103.02, being the 'dynamic' 61.8% r of the early fall fm 104.13-100.81 n May 02 high. Looking ahead, a daily close abv there wud encourage for subsequent headway twd 103.50 (being 80.9% r) but as mentioned in previous updates, we're holding our view the broad sideways move fm 2014 5-year peak at 105.45 (Jan) is unfolding into a 'triangle' n pivotal res at 104.13 (possible B-leg top) wud continue to hold this month.
. Today, trading dlr fm long side for gain twd 103.02 is recommended n only below 102.11 wud confirm temporary is made n risk 101.57 (61.8% r fm 100.81).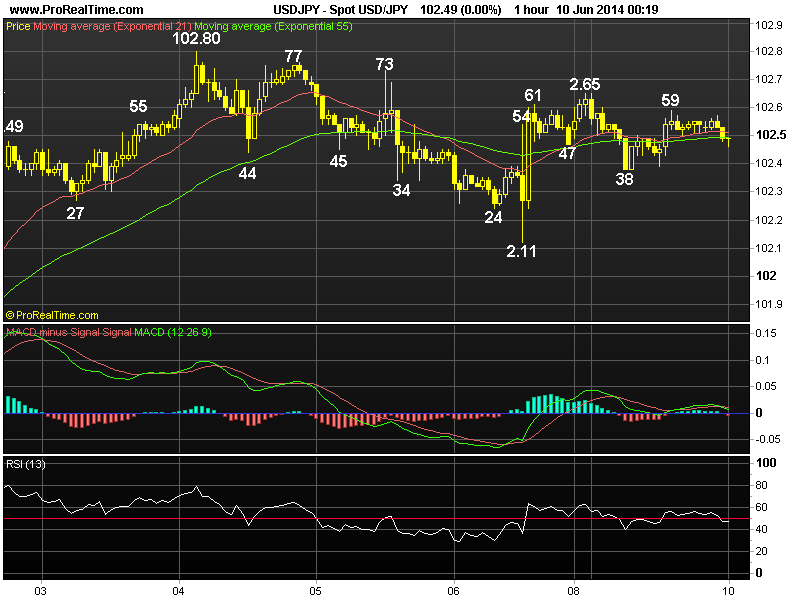
Posted by: acetraderforex Jun 11, 2014, 09:14 AM
AceTraderFx Jun 11: Daily Technical Outlook & Trading Ideals on USD/CHF DAILY USD/CHF TECHNICAL OUTLOOK
Last Update At 11 Jun 2014 00:06GMT
Trend Daily Chart
Sideways
Daily Indicators
Bearish divergences
21 HR EMA
0.8990
55 HR EMA
0.8975
Trend Hourly Chart
Near term up
Hourly Indicators
Turning down
13 HR RSI
62
14 HR DMI
+ve
Daily Analysis
Consolidation with upside bias
Resistance
0.9082 - Feb 03 high
0.9037 - Last Thur's high
0.9008 - Y'day's high
Support
0.8965 - Y'day's low
0.8920 - Mon's low
0.8908 - Last Thur's low
. USD/CHF - 0.8997 ... Although the greenback traded in a narrow range in Asia y'day, renewed buying emerged at 0.8964 at European open n price rallied to session high of 0.9008 at European midday. However, dlr pared some of its gains n retreated to 0.8989 at NY open b4 moving sideways in subdued NY session.
. Looking at the hourly chart, y'day's rebound to 0.9008 suggests pullback fm last Thur's 3-1/2 month high at 0.9037 has ended at 0.8908 (Thur NY low) n consolidation with upside bias remains for erratic rise fm Mar's 2-year trough at 0.8698 to resume n yield re-test of aforesaid top. Abv wud retain bullishness for further gain to 0.9076/82, being the 'natural' 50% r of MT decline fm 0.9455 (2013 Sep peak) n Feb 03 high respectively, however, as hourly oscillators wud display 'bearish divergences' on such move, strg gain abv there is unlikely to be seen n risk wud increase for a much-needed correction later this week.
. Today, in view of abv analysis, we are buying dlr on intra-day retreat for a re-test of 0.9037 1st n only below Mon's low at 0.8920 wud indicate a temporary top has been made n turn outlook bearish for a stronger correction to 0.8908 but sup 0.8883 shud remain intact n yield subsequent rebound.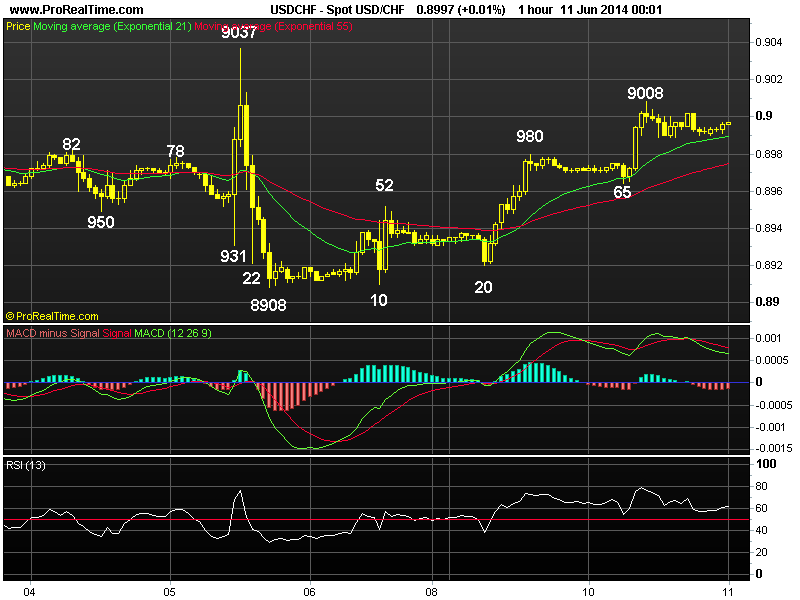
Posted by: acetraderforex Jun 12, 2014, 09:36 AM
AceTraderFx Jun 12: Daily Technical Outlook & Trading Ideals on USD/GBP DAILY TECHNICAL OUTLOOK ON GBP/USD
Last Update At 12 Jun 2014 00:23GMT
Trend Daily Chart
Sideways
Daily Indicators
Turning up
21 HR EMA
1.6784
55 HR EMA
1.6782
Trend Hourly Chart
Sideways
Hourly Indicators
Rising
13 HR RSI
58
14 HR DMI
+ve
Daily Analysis
Choppy trading to continue
Resistance
1.6883 - May 27 high
1.6845 - Last Fri's high
1.6817 - Tue's high
Support
1.6838 - Y'day's low
1.6723 - Last Thur's low
1.6693 - May's 5-week low
. GBP/USD - 1.6791... Despite cable dropped to 1.6738 shortly after Asian open on Wed. Price rallied to 1.6797 in European morning after jobs data showed U.K. unemployment fell to its lowest lvl since early 2009. Later, cable extended intra-day gain to session high of 1.6812 in NY b4 retreating.
. Looking at the hourly n daily charts, despite y'day's rebound fm 1.6838, as mentioned in previous update, the early selloff fm last Fri's high of 1.6845 signals correction fm May's 5-week trough at 1.6693 has ended there n as long as 1.6833 (Mon's high) holds, downside bias remains for another decline twd 1.6723 (last Thur's low) after consolidation, below wud yield re-test of aforesaid low at 1.6693 but break there needed to confirm early fall fm May's near 5-year peak at 1.6997 (Reuters) to retrace MT uptrend has finally resumed n yield weakness to 1.6657 n then 1.6595, being the Apr 15 low n 1.23 times extension of 1.6997-1.6732 measured fm 1.6923.
. Today, as cable is currently trading abv the 21-hr n 55-hr emas, suggesting near term upside bias remains, abv 1.6812 may yield gain to 1.6833 but only break of 1.6845 bring stronger retracement twd 1.6881 (61.8% r of 1.6997-1.6693). 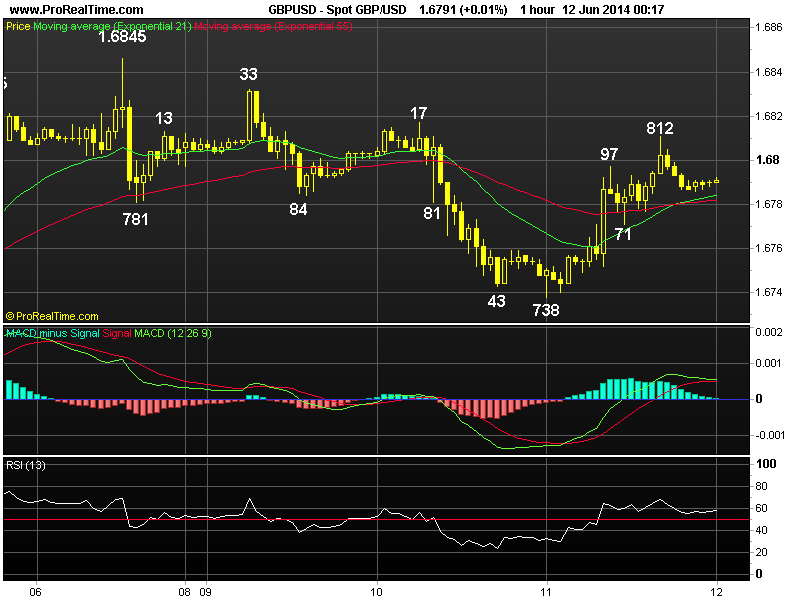
Posted by: acetraderforex Jun 16, 2014, 10:02 AM
AceTraderFx Jun 16: Weekly Technical Outlook & Trading Ideals on EUR/USD WEEKLY TECHNICAL OUTLOOK ON EUR/USD
Last Update At 15 Jun 2014 23:25GMT
Trend Daily Chart
Down
Daily Indicators
Falling
21 HR EMA
1.3541
55 HR EMA
1.3546
Trend Hourly Chart
Sideways
Hourly Indicators
Falling
13 HR RSI
44
14 HR DMI
-ve
Daily Analysis
Consolidation with downside bias
Resistance
1.3620 - Jun 06 low (now res)
1.3602 - Last Tue's high
1.3579 - Last Fri's high
Support
1.3512 - Last Thur's low
1.3503 - Hyn 05 4-month low
1.3477 - Feb 3 low
. EUR/USD - 1.3533... Despite rallying fm a near 4-month low of 1.3503 to 1.3677 in the previous week, euro came under renewed broad-based selling at the start of the week n fell back to 1.3512, however, profit-taking abv 1.3503 lifted price n euro recovered to 1.3579 on Fri b4 retreating to 1.3521 in NY.
. Looking at the hourly n daily charts, euro's weakness to 1.3512 strongly suggests the correction fm 1.3503 has ended at 1.3677 n as long as this reaction high holds, bearishness remains for decline fm May's 2-1/2 year peak at 1.3995 to retrace MT uptrend to resume n yield subsequent weakness to 1.3477 (Feb 03 low). Having said that, as prominent 'bullish convergences' wud appear on the hourly oscillators on such a move, sharp fall below there is unlikely to be seen this week n reckon 1.3445, this is the 'dynamic' 61.8% r of intermediate rise of 1.3105-1.3995, wud hold n bring a much-needed correction.
. Today, although euro may come under pressure on Mon initially, unless euro bears are able to take out 1.3503 sup, odds still favour further choppy sideways move abv there b4 prospect of a downside break later. Below 1.3503 wud encourage for weakness twd next daily obj. at 1.3477 (Feb low). 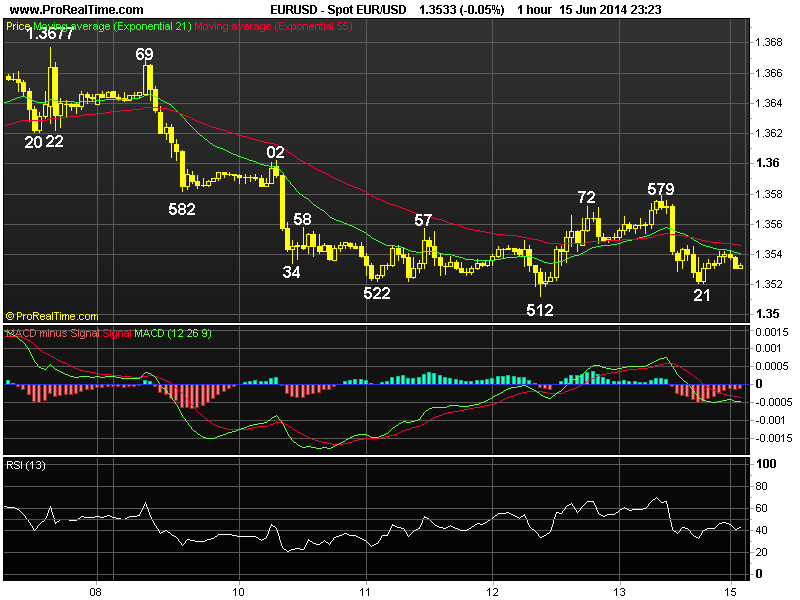
Posted by: acetraderforex Jun 17, 2014, 09:20 AM
AceTraderFx Jun 17: Daily Technical Outlook & Trading Ideals on USD/CHF DAILY USD/CHF TECHNICAL OUTLOOK
Last Update At 17 Jun 2014 00:26GMT
Trend Daily Chart
Sideways
Daily Indicators
Bearish divergences
21 HR EMA
0.8980
55 HR EMA
0.8986
Trend Hourly Chart
Sideways
Hourly Indicators
Falling
13 HR RSI
36
14 HR DMI
-ve
Daily Analysis
Consolidation with mild upside bias
Resistance
0.9082 - Feb 03 high
0.9037 - Jun 05 3-1/2 month high
0.9013 - Y'day's high
Support
0.8960- Last Fri's low
0.8620 - Last Mon's low
0.8908 - Jun 05 low
. USD/CHF - 0.8971... The greenback remained under pressure in Asia y'day n retreated to 0.8987 at European open. Despite a one-tick break of prev. 0.9012 res, dlr met renewed selling n fell sharply to an intra-day low at 0.8966 in NY morning on risk aversion due to escalating tensions in Iraq.
. Looking at the hourly chart, although dlr's retreat fm 0.9013 suggests recent rise fm Mar's 2-year low at 0.8698 is not yet ready to resume n further choppy trading below Jun's 3-1/2 month wud continue with mild downside bias, reckon last Mon's low at 0.8620 shud remain intact n yield recovery. Abv 0.9037 wud extend aforesaid upmove twds 0.9076/82, this is a 'natural' 50% r of the MT decline fm 0.9455 (2013 Sep peak) n Feb 03 high respectively. Having said that, as the hourly oscillators wud display 'bearish divergences' on such move, strg gain abv there is unlikely to be seen n risk has increased for a much-needed correction to take place later this week.
. Today, in view of abv analysis, we are buying dlr on intra-day decline n only below 0.8920 wud abort bullishness on euro n risk stronger retracement twd 0.8908 (Jun 05 low) b4 prospect of another rebound. 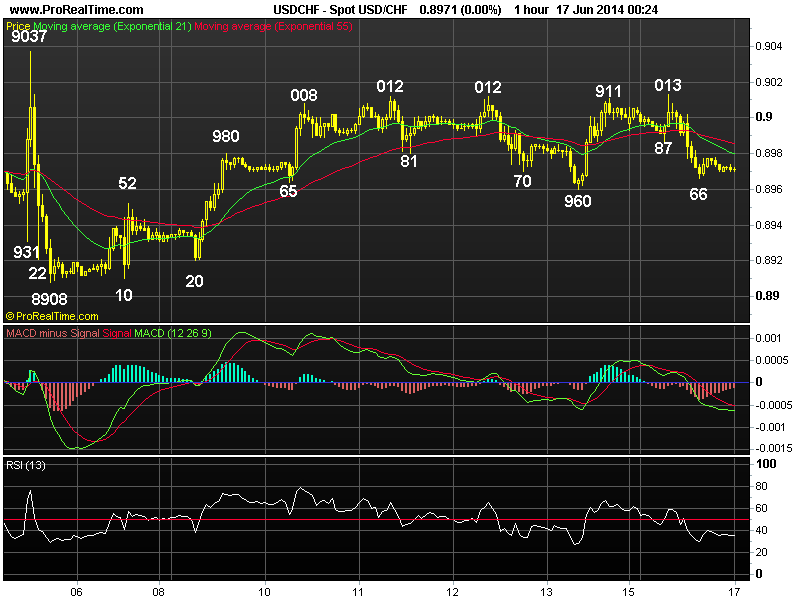
Posted by: acetraderforex Jun 23, 2014, 10:35 AM
AceTraderFx Jun 23: Weekly Technical Outlook & Trading Ideals on USD/JPY WEEKLY USD/JPY TECHNICAL OUTLOOK
Last Update At 23 Jun 2014 00:04GMT
Trend Daily Chart
Sideways
Daily Indicators
Neutral
21 HR EMA
102.06
55 HR EMA
102.02
Trend Hourly Chart
Sideways
Hourly Indicators
Easing fm o/bot
13 HR RSI
61
14 HR DMI
+ve
Daily Analysis
Choppy trading to continue
Resistance
102.80 - Jun 04 high
102.65 - Mon's high
102.35 - Wed's high
Support
101.61 - Last Fri's low
101.43 - May 29 low
101.19 - 80.9% r of 100.81-102.80
. USD/JPY - 102.12... The greenback spent a lackluster week gyrating inside a fairly narrow range of 101.73-102.35. Price ratcheted higher abv previous sup at 101.61 on Mon n then climbed to 102.35 b4 retreating back to 101.74 (Thur) on cross-buying of yen but dlr's broad-based strength lifted price to 102.20 Fri.
. Looking at the daily picture, although dlr's erratic fall fm Jun's high at 102.80 to 101.61 signals early 3-legged upmove fm May's 3-1/2 month bottom at 100.81 has formed a top there, as long as 101.19/21 holds, consolidation with upside bias remains, however, abv 102.80 is needed to retain bullish prospect of extending aforesaid rise fm 100.81 to next daily chart obj. at 103.02 but as broad outlook on dlr remains 'consolidative' (as evidenced by the horizontal movement in 13-day & 55-day emas), 103.50 (80.9% r of 104.13-100.81) shud cap upside n yield another retreat in Jul. In view of this analysis, buying dlr on dips or selling on upmove is the appropriate trading strategy this week.
. Today, despite Fri's rise fm 101.82 to 102.20 to 102.20 due to renewed cross-selling in yen, as long as 102.35 res holds, subsequent decline to 101.45 is still likely. Abv 102.35 res may risk stronger gain twd 102.80 b4 retreat. 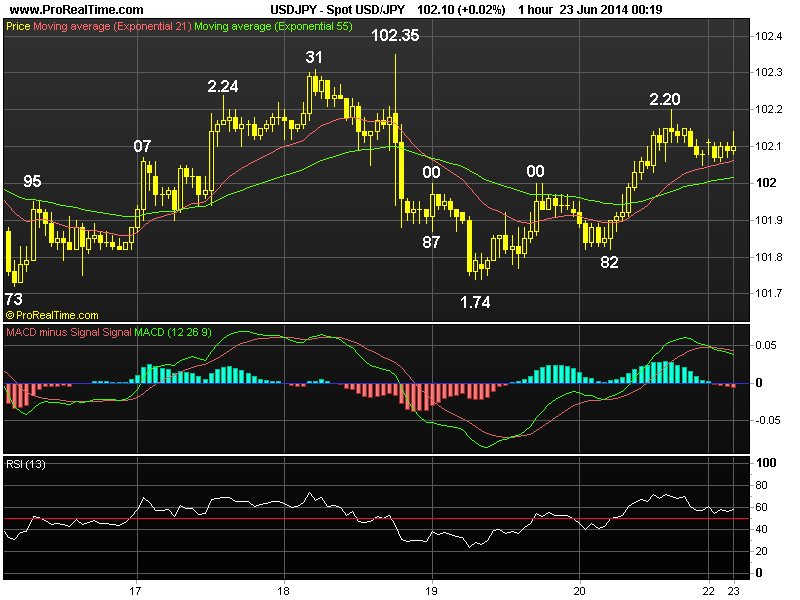
Posted by: acetraderforex Jun 25, 2014, 10:01 AM
AceTraderFx Jun 25: Daily Technical Outlook & Trading Ideals on GBP/USD DAILY TECHNICAL OUTLOOK ON GBP/USD
Last Update At 25 Jun 2014 00:16GMT
Trend Daily Chart
Up
Daily Indicators
Rising
21 HR EMA
1.6991
55 HR EMA
1.7004
Trend Hourly Chart
Nr term down
Hourly Indicators
Rising fm o/s
13 HR RSI
38
14 HR DMI
-ve
Daily Analysis
Consolidation with downside bias
Resistance
1.7091 - 61.8% proj. of 1.6738-1.7011 fm 1.6922
1.7064 - Last Thur's fresh 5-1/2 year peak
1.7034 - Y'day's high
Support
1.6966 - Y'day's low
1.6920 - Last Wed's low
1.6878 - 50% r of 1.6693-1.7064
. GBP/USD - 1.6980... Despite cable's sideways move after retreating fm Australian high of 1.7034 to 1.7017 in Asia, price tumbled to 1.6973 in European morning after dovish remarks fm BoE Governor Mark Carney. Later, cable fell further to 1.6966 in NY session due to upbeat U.S. economic data b4 recovering.
. Looking at the hourly n daily charts, although cable's brief breach of
key res at 1.7044 (2009 Aug's reaction high fm Jan's 24-year trough at 1.3500) last week to a 5-1/2 year peak at 1.7064 on Thur confirms the near 5-year long broad sideways consolidation has ended n aforesaid rise to correct LT downtrend fm 2.1162 (2007 multi-decade peak) is expected to head to 1.7136 in early July, y'day's breach of Mon's low at 1.7002 suggest a long-awaited correction has occured n consolidation with downside bias is seen for a retracement twd 1.6920 (last week's low). Having said that, as hourly oscillators wud display minor bullish convergences on such a move, reckon 1.6878, this is the 'natural' 50% r of 1.6993-1.7064, wud hold n yield strg rebound later this week.
. Today, selling cable on recovery for weakness to 1.6920 is recommended. Only abv 1.7064 aborts this mildly bearish scenario n extends gain twd 1.7095. 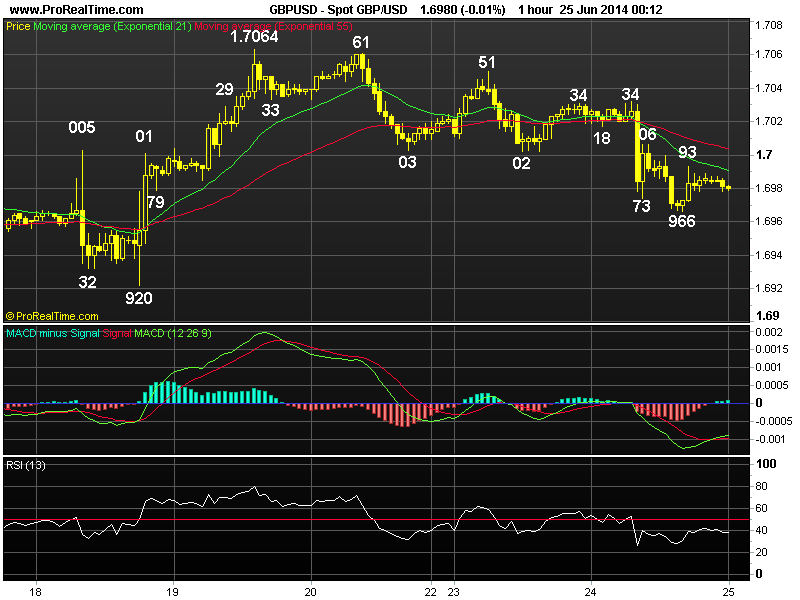
Posted by: acetraderforex Jun 27, 2014, 08:46 AM
AceTraderFx Jun 27: Daily Technical Outlook & Trading Ideals on USD/CHF
DAILY USD/CHF TECHNICAL OUTLOOK
Last Update At 27 Jun 2014 00:18GMT
Trend Daily Chart
Sideways
Daily Indicators
Turning down
21 HR EMA
0.8935
55 HR EMA
0.8935
Trend Hourly Chart
Sideways
Hourly Indicators
Neutral
13 HR RSI
49
14 HR DMI
+ve
Daily Analysis
Consolidation with mild upside bias
Resistance
0.9037 - Jun 05 3-1/2 month high
0.9013 - Last Mon's high
0.8975 - Last Fri's high
Support
0.8908 - Wed's n Jun 05 low
0.8867 - 50% r of 0.8698-0.9037
0.8821 - 06 May low
. USD/CHF - 0.8934... Although the greenback traded sideways in Asia y'day n edged lower to session low at 0.8922 at European open, renewed buying emerged there n price rose to an intra-day high at 0.8957 in NY morning on dlr's broadbased strength. Later, price retreated to 0.8941 b4 moving narrowly in NY.
. Looking at the hourly n daily charts, despite Wed's re-test of 0.8908 (reaction low fm 0.9037), failure to penetrate this near term key sup suggests further choppy 'sideways trading' inside the near 3-week range of 0.8908-0.9037 wud continue with mild upside bias n abv last Fri's high at 0.8975 wud extend marginally but res 0.9013 shud remain intact n yield another fall later. On the downside, below 0.8908 wud confirm the 3-legged rise fm Mar's near 2-1/2 year trough at 0.8698 has formed a temp. top at Jun's 3-1/2 month peak at 0.9037 n risk stronger retracement twds 0.8867, being the 'natural' 50% r of said move, however, sup at 0.8821/27 (May 06 low n 61.8% r resp.) shud hold.
. Today, we are holding a long position entered y'day for gain to 0.9000 n although below 0.8908 wud extend weakness, prominent 'bullish convergences' on hourly oscillators wud prevent steep fall n yield rebound. 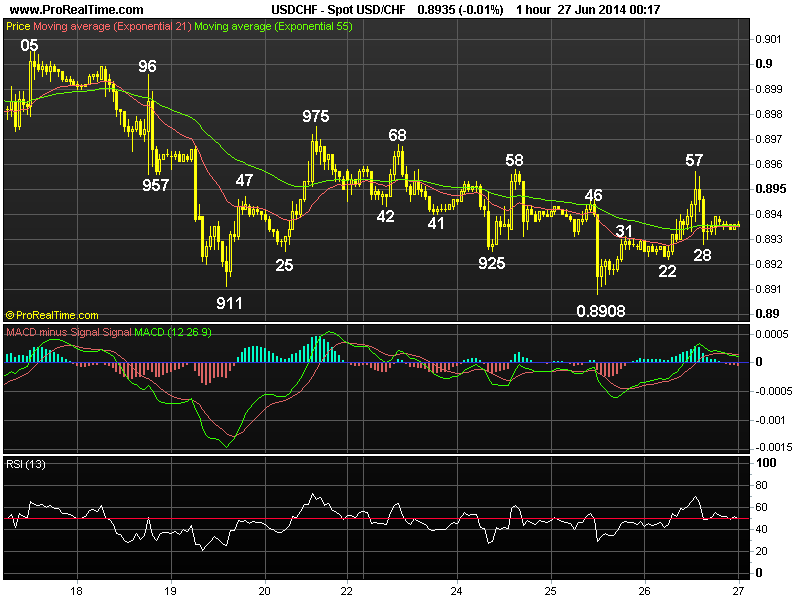
Posted by: acetraderforex Jun 30, 2014, 07:40 AM
AceTraderFx Jun 30: Daily Market Outlook USD/JPY DAILY MARKET OUTLOOK USD/JPY - 101.32
Update Time: 30 Jun 2014 05:58 GMT
The greenback remained under pressure after penetrating 101.61 support last week, suggesting the erratic decline from June's high at 102.80 has resumed and further weakness to 101.00/10 is envisaged, however, previous key daily support area at 100.76/81 should hold on 1st testing and yield rebound later.
On the upside, only a rise above 102.00 would prolong choppy consolidation and may risk gain to 102.35 resistance again.
Posted by: tixonowa Jul 1, 2014, 01:57 PM
I can not understand anything on this schedule! Who can explain? 
Posted by: acetraderforex Jul 4, 2014, 10:43 AM
AceTraderFx Jul 4: Daily Technical Outlook & Trading Ideals on USD/JPY DAILY USD/JPY TECHNICAL OUTLOOK
Last Update At 03 Jul 2014 23:31GMT
Trend Daily Chart
Sideways
Daily Indicators
Turning up
21 HR EMA
102.09
55 HR EMA
101.88
Trend Hourly Chart
Up
Hourly Indicators
Easing fm o/bot
13 HR RSI
72
14 HR DMI
+ve
Daily Analysis
Consolidation b4 upmove resumes
Resistance
103.02 - May 02 high
102.80 - Jun 4 high
102.35 - Jun 18 high
Support
101.96 - Thur's European morning high
101.65 - Wed's high, now sup
101.41 - Wed's low
. USD/JPY - 102.21... Dlr strengthened after finding support at 101.76 in Aust. on Thur n price edged higher to 101.94 in Asia, then 101.96 in European morning. Later, release of upbeat U.S. payrolls data triggered broad-based buying in greenback n the pair surged to 102.27 in NY morning b4 easing.
. Looking at the daily picture, y'day's rally abv Wed's 101.84 high to 102.27 signals Jun's 3-legged decline 102.80 has ended at Mon's 5-week trough at 101.24 n as price is currently trading abv both 21-hr n 55-hr emas, suggesting bias to dlr remains to the upside, abv daily res at 102.35 (Jun 9 high) anytime wud confirm this view n bring re-test of 103.02 (May high), abv wud encourage for further headway to 103.23 (100% proj. of 100.81-102.80 measured fm 101.24) next week. Therefore, position players shud buy dlr on dips for this move.
. In view of abv analysis, trading dlr fm long side for gain twd 103.02 is recommended. On the downside, only below 101.41 (Wed's low) wud dampen current mildly bullish scenario n risk one more fall twd 101.00 but present 'horizontal' movement in the daily 13-day & 55-day emas suggests the near 6-month long side-ways range of 100.76-104.13 is set to continue, key sup 100.76 shud hold. 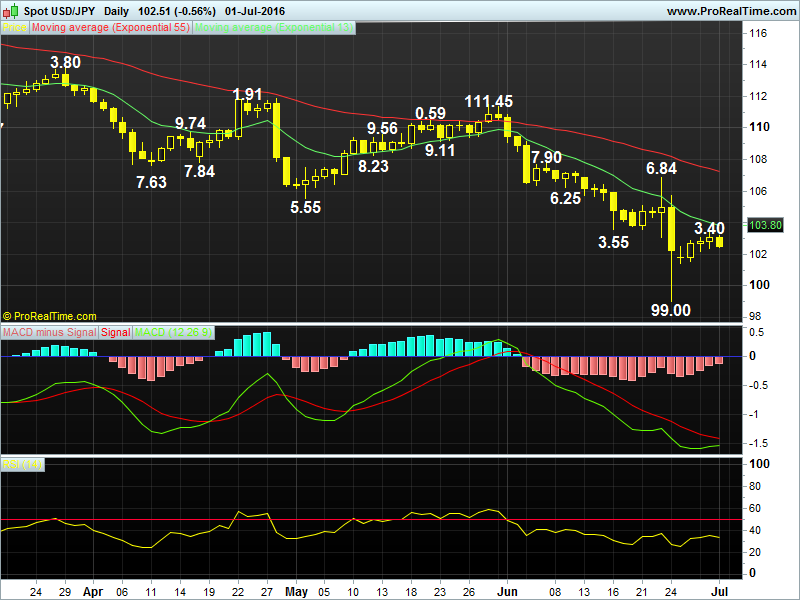
Posted by: acetraderforex Jul 8, 2014, 09:44 AM
AceTraderFx Jul 8: Daily Technical Outlook & Trading Ideals on USD/CHF DAILY USD/CHF TECHNICAL OUTLOOK
Last Update At 08 Jul 2014 00:00GMT
Trend Daily Chart
Sideways
Daily Indicators
Turn up
21 HR EMA
0.8938
55 HR EMA
0.8935
Trend Hourly Chart
Sideways
Hourly Indicators
Falling
13 HR RSI
41
14 HR DMI
-ve
Daily Analysis
Initial weakness b4 one more rise
Resistance
0.9013 - Jun 16 high
0.8975 - Jun 20 high
0.8959 - Y'day's high
Support
0.8899 - Last Wed's high (now sup)
0.8857 - Last Tue's low
0.8821 - May 06 low
. USD/CHF - 0.8934... The greenback traded with a firm bias in Asia y'day n rose to session high at 0.8959 at European open, however, dlr pared intra-day gains n retreated to 0.8938 in European morning, then marginally lower to 0.8930 in NY due to dlr's broad-based retreat b4 stabilizing ahead of NY close.
. Looking at the daily chart, dlr's strg rebound fm last Tue's 6-week low at 0.8857 suggests the early fall fm Jun's 3-1/2 month high at 0.9037 has ended there n consolidation with upside bias wud be seen. A daily close abv 0.8968/75, this is the 'dynamic' 61.8% r of aforesaid decline n Jun 20 top respectively, wud add credence to this view n extend gain twds res 0.9013 (Jun 16 peak). However, reckon said 0.9037 res shud hold this week n yield retreat later. On the downside, only below 0.8857 wud revive bearishness of a stronger retracement of upmove fm Mar's 2-1/2 year trough at 0.8698 twds 0.8821/27 (May 06 low n 61.8% r of 0.8698-0.9037 respectively).
. Today, in view of abv analysis, we are buying dlr on intra-day decline in
anticipation for one more rise to 0.8895 n only below 0.8899 (prev. res, now
sup) wud abort n risk weakness to 0.8873 but sup at 0.8857 shud remain intact. 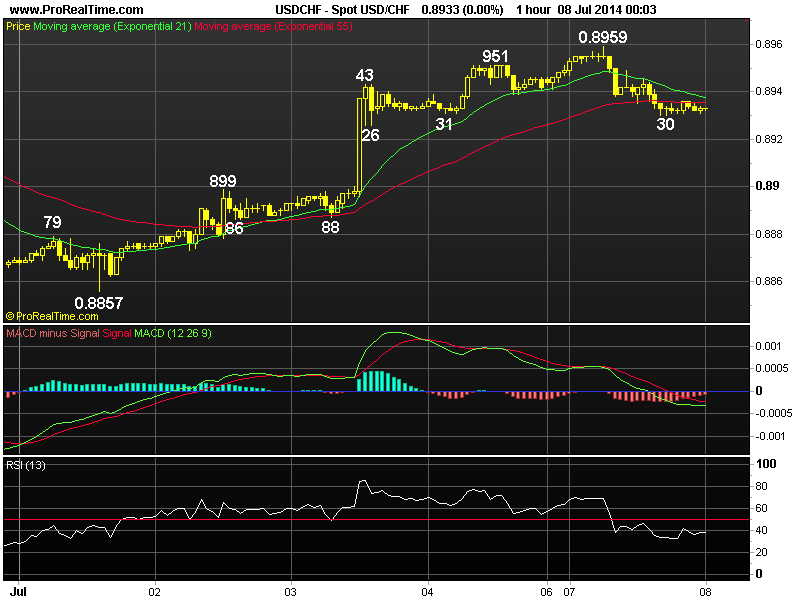
Posted by: acetraderforex Jul 14, 2014, 10:00 AM
AceTraderFx Jul 14: Weekly Technical Outlook & Trading Ideals on USD/JPY WEEKLY USD/JPY TECHNICAL OUTLOOK
Last Update At 13 Jul 2014 23:45GMT
Trend Daily Chart
Sideways
Daily Indicators
Falling
21 HR EMA
101.33
55 HR EMA
101.39
Trend Hourly Chart
Down
Hourly Indicators
Turning up
13 HR RSI
56
14 HR DMI
0
Daily Analysis
Marginal fall b4 recovery
Resistance
102.80 - Jun 4 high
102.27 - Jun 18 high
101.85 - Last Wed's high (NY)
Support
101.07 - Last Thur's low
100.76 - Feb 04 low
100.22 - 2 times extn of 102.27-101.45 fm 101.85
. USD/JPY - 101.37... Despite last week's initial sideways trading, failure to re-test previous Jul's 102.27 high n decline in the Nikkei due to retreat in the Dow & S&P 500 fm their record highs triggered broad-based buying of yen, the pair fell to a 6-week trough of 101.07 on Thur b4 staging as minor recovery.
. Let's look at the bigger picture 1st, although dlr's break of Jun's 101.24
low confirms erratic fall fm Jun's peak at 102.80 has resumed n further weakness is likely after consolidation, as stated in the previous updates, we are still holding on to our broad consolidative outlook that dlr shud continue to trade inside the 6-month long broad range of 105.45-100.76, current bullish convergences on the hourly oscillators shud keep price well abv the key sup area at 100.76/81 n yield a 'much-needed' rebound later this this week. On the upside, a daily close abv 101.85 wud be the 1st signal low has been formed, then further gain twd 102.27 wud follow. A breach of 2014 trough at 100.76 wud extend MT fall fm 105.45 to 100.00, then later twd 99.60 (50% r of 93.75-105.45).
. Today, we're trading dlr on both sides of the market n will sell on intra
-day recovery or buy on next decline twd 100.76. 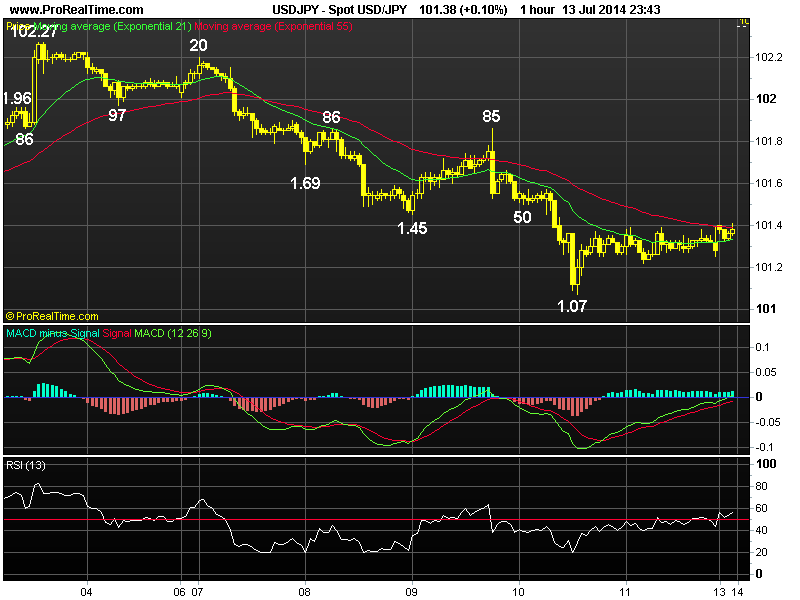
Posted by: acetraderforex Jul 15, 2014, 12:15 PM
AceTraderFx Jul 15: Daily Technical Outlook & Trading Ideals on USD/CHF DAILY USD/CHF TECHNICAL OUTLOOK
Last Update At 14 Jul 2014 23:58GMT
Trend Daily Chart
Sideways
Daily Indicators
Neutral
21 HR EMA
0.8919
55 HR EMA
0.8921
Trend Hourly Chart
Sideways
Hourly Indicators
Neutral
13 HR RSI
48
14 HR DMI
-ve
Daily Analysis
Consolidation with a neutral bias
Resistance
0.9013 - Jun 16 high
0.8975 - Jun 20 high
0.8959 - Last Mon's high
Support
0.8899 - Y'day's low
0.8857 - Jul low (1st)
0.8821 - May 06 low
. USD/CHF - 0.8918.. Although the greenback traded sideways in Asia y'day n edged up to session high at 0.8932 at European open, price fell sharply to an intra-day low at 0.8899 on euro's brief rally. However, dlr pared its losses n recovered to 0.8926 in NY session b4 stabilising.
. Looking at the hourly n daily charts, although y'day's retreat to 0.8899 suggests choppy trading below last Mon's high at 0.8959 has ended there n marginal weakness fm here can't be ruled out, as the early strg rebound fm Jul's low at 0.8857 signals the pullback fm Jun's 3-1/2 month peak at 0.9037 has possibly ended there, upside bias remains for a re-test of 0.8959. Abv wud add credence to this view n extend gain twds 0.8975 (Jun 20 peak) later this week, however, res 0.9013 (Jun 16 top) shud limit upside. On the downside, only below 0.8857 wud signal the decline fm 0.9037 has resumed instead n yield stronger retrace. of rise fm Mar's 0.8698 trough twds 0.8821 (May 06 low).
. Today, in view of abv analysis, we are trading dlr on both sides of the market n will sell on intra-day recovery for one more fall or buy the greenback on next decline in an anticipation of subsequent rebound. 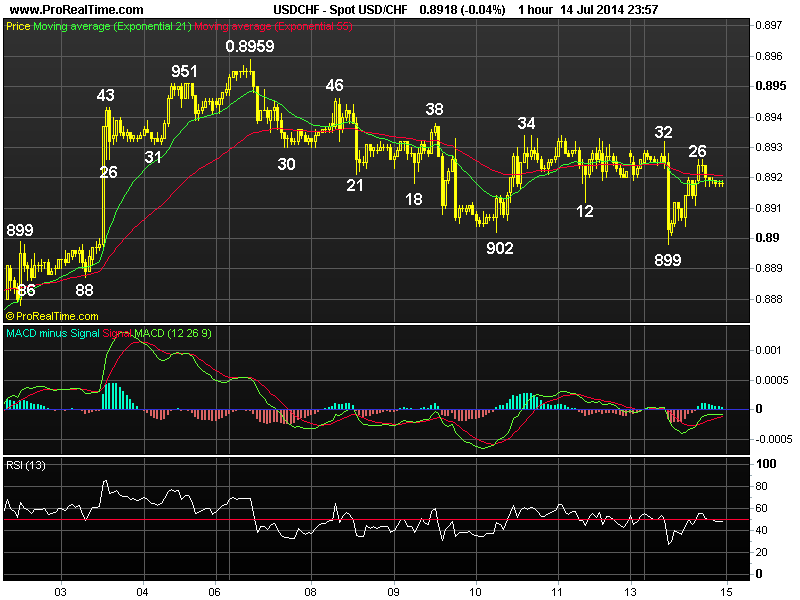
Posted by: acetraderforex Jul 17, 2014, 10:08 AM
AceTraderFx Jul 17: Daily Technical Outlook & Trading Ideals on GBP/USD DAILY GBP/USD TECHNICAL OUTLOOK
Last Update At 17 Jul 2014 00:10GMT
Trend Daily Chart
Up
Daily Indicators
Bearish divergences
21 HR EMA
1.7136
55 HR EMA
1.7130
Trend Hourly Chart
Up
Hourly Indicators
Neutral
13 HR RSI
52
14 HR DMI
+ve
Daily Analysis
One more rise b4 correction
Resistance
1.7287 - 100% proj. of 1.6952-1.7180 fm 1.7059
1.7230 - 100% proj. of 1.6460-1.6997 fm 1.6693
1.7192 - Tue's fresh near 6-year high
Support
1.7113 - Y'day's low
1.7085 - Last week's low (Jul 08)
1.7059 - Y'day's low
. GBP/USD - 1.7138 ... The British pound chopped around in a tight range as eur/usd took centre stage in Wed's session. Despite edging higher to intra-day top at 1.7151 in Europe, price briefly dipped to session low of 1.7113 after UK wage rise came in lower than forecast, cable later moved narrowly in NY trading.
. Looking at the hourly & daily charts, Tue's rally to a fresh near 6-year peak of 1.7192 confirms long-term uptrend has once again resumed n as long as 1.7059 sup holds, gain twd 1.7230 is envisaged (being 100% projection of 1.6460-1.6997 measured fm 1.6693). Having said that, as both hourly & daily technical indicators wud display prominent 'bearish divergences' on such move, reckon 1.7303, this is 50% proj. of intermediate rise fm 1.6693-1.7180 measured fm 1.7059 shud cap upside n risk has increased for a long-overdue strg correction to take place later this month, so die-hard sterling bulls shud book profit on upmove. A daily close below 1.7059 wud confirm temporary top is in place n risk wud shift to the downside for subsequent weakness twd 1.6942 (50% r of 1.6693-1.7180).
. Today, as long as said y'day's 1.7113 low holds, resumption of uptrend to 1.7200 is envisaged but 1.7225/30 shud remain intact. Below 1.7113, 1.7085. 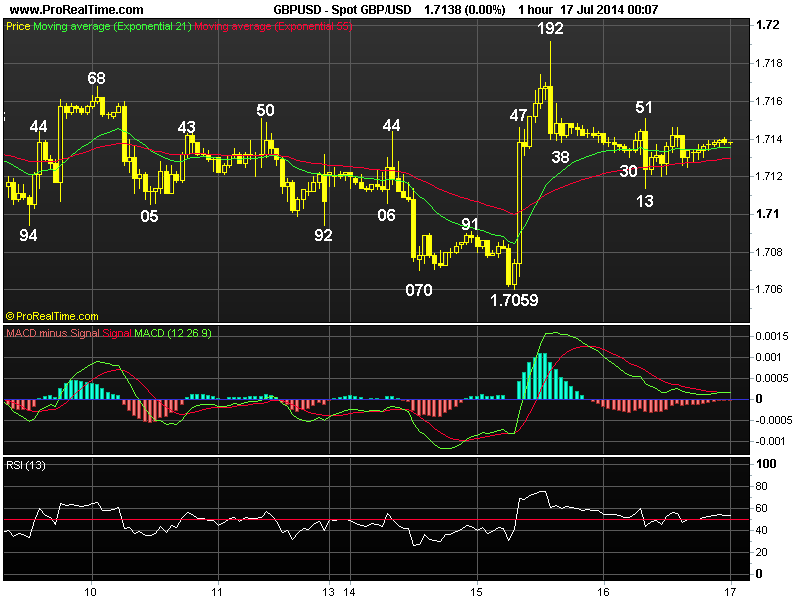
Posted by: acetraderforex Jul 18, 2014, 10:37 AM
AceTraderFx Jul 18: Daily Technical Outlook & Trading Ideals on USD/JPY DAILY USD/JPY TECHNICAL OUTLOOK
Last Update At 18 Jul 2014 00:14GMT
Trend Daily Chart
Sideways
Daily Indicators
Falling
21 HR EMA
101.35
55 HR EMA
101.48
Trend Hourly Chart
Down
Hourly Indicators
Rising fm o/s
13 HR RSI
44
14 HR DMI
-ve
Daily Analysis
Possible resumption of recent fall
Resistance
102.27 - Jun 18 high
101.79 - Wed's high
101.44 - Wed's low
Support
101.07 - Last Thur's low
100.76 - 2014 low (Feb 04)
100.00 - Psychological
. USD/JPY - 101.21... Despite extending early upmove fm last Thur's 6-week low of 101.07 to 101.79 on Wed, dlr came under pressure at Asian open due to broad-based buying of yen. News of downing of a Malaysian aircraft in Ukriane knocked the greenback to 101.17 in NY afternoon, the to 101.09 in Australia.
. On the daily picture, as dlr has fallen again after staging a strg rebound fm last Thur's 6-week low of 101.07 to 101.79 on Wed, subsequent cross-inspired weakness suggests re-test of 101.07 wud be forthcoming soon, a break there wud pressure dlr twd 2014 trough at 100.76 (Feb low), a daily close below there wud signal a 'downside break' of the near 7-month long broad sideways trading has taken place, then further weakness to 100.00 n 99.60 (50% r of 93.75-105.45) wud follow later this month. Failure to penetrate 100.76 n subsequent rise abv 101.79 wud retain previous broad consolidative view, dlr will later ratchet higher twd 102.27 later next week.
. Today, as yen remains firm across the board due to safe-haven demand, selling dlr on intra-day recovery for 100.80 is cautiously favoured n only abv 101.79 aborts bearishness, risks subsequent headway twd 102.00/05. 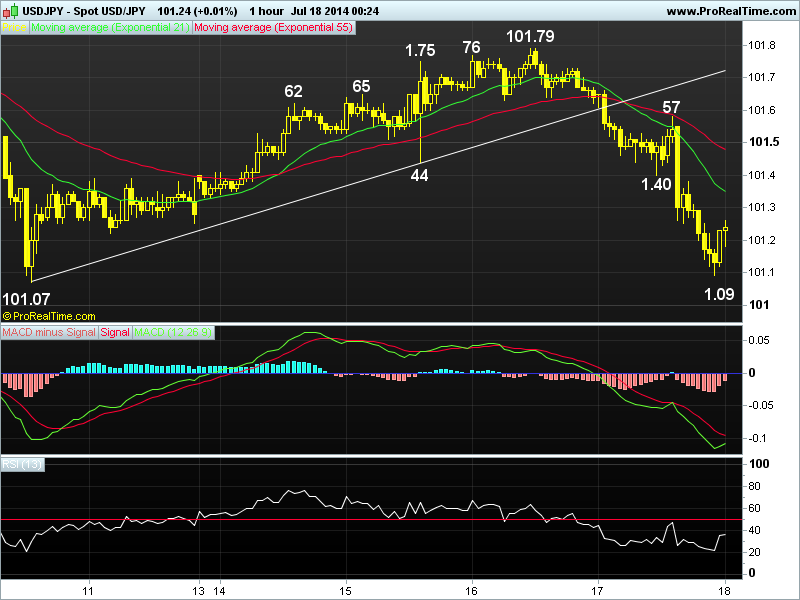
Posted by: acetraderforex Jul 21, 2014, 11:26 AM
AceTraderFx Jul 21: Weekly Technical Outlook & Trading Ideals on USD/CHF WEEKLY USD/CHF TECHNICAL OUTLOOK
Last Update At 20 Jul 2014 23:45GMT
Trend Daily Chart
Sideways
Daily Indicators
Rising
21 HR EMA
0.8981
55 HR EMA
0.8976
Trend Hourly Chart
Up
Hourly Indicators
Bearish divergences
13 HR RSI
49
14 HR DMI
+ve
Daily Analysis
Consolidation with upside bias
Resistance
0.9082 - Feb 03 high
0.9037 - Jun 05 3-1/2 month high
0.9004 - Last Fri's high
Support
0.8967 - Last Thur's low
0.8959 - Jul 10 high
0.8899 - Last Mon's low
. USD/CHF - 0.8980... Despite dlr's brief retreat to last week's low of 0.8899 on Mon, renewed buying quickly emerged n lifted the pair, price then climbed to 0.8989 on Wed n later to a 1-month high of 0.9004 b4 easing in NY afternoon.
. Let's look at bigger picture 1st, dlr's strg rise fm Jul's 0.8857 low n breach of 0.8859 res (now sup) to 0.9004 confirms the early correction fm Jun's 3-1/2 month peak at 0.9037 has ended there n consolidation with upside bias remains for re-test of said res, abv wud extend MT the 3-legged rise fm Mar's 2-1/2 year trough at 0.8698 to next chart obj. at 0.9082. Having said that, as daily technical indicators wud display prominent 'bearish divergences' on such move, risk has increased for a major correction to take place later this month or in early Aug. On the downside, only below 0.8924/38 (prev. res) wud signal top is made n may risk possible weakness twd 0.8899.
. Today, although Fri's retreat fm 0.9004 suggests initial sideways move is in store, as long as 0.8963/67 sup area holds, marginal gain is likely but as hourly oscillators' readings have displayed 'bearish divergences', reckon 0.9037 shwud cap upside. Below 0.8938 aborts bullishness on dlr, risks 0.8900/10. 
Posted by: acetraderforex Jul 22, 2014, 10:02 AM
AceTraderFx Jul 22: Daily Technical Outlook & Trading Ideals on EUR/USD DAILY EUR/USD TECHNICAL OUTLOOK
Last Update At 22 Jul 2014 00:03GMT
Trend Daily Chart
Down
Daily Indicators
Bullish convergences
21 HR EMA
1.3524
55 HR EMA
1.3527
Trend Hourly Chart
Down
Hourly Indicators
Bullish convergences
13 HR RSI
48
14 HR DMI
-ve
Daily Analysis
Consolidation b4 marginal fall
Resistance
1.3650 - Last Thur's high
1.3589 - Last Thur's low
1.3549 - Y'day's high
Support
1.3492 - Last Fri's 5-month low
1.3477 - 2014 low (Feb 03)
1.3454 - 50% proj. of 1.3995 to 1.3503 fm 1.3700
. EUR/USD - 1.3523... Euro extended recovery fm last Fri's fresh 5-month trough of 1.3491 to 1.3549 on Mon after triggering stops abv 1.3540 in Asia, how ever, offers at 1.3550/60 capped intra-day gain n selling emerged at European open due to weakness in European shares n price dropped to 1.3513 in NY morning.
. Looking at the daily chart, despite euro's rebound fm 1.3491 to 1.3549, last week's breach of Jun's low at 1.3503 confirms the MT downtrend fm May's 2-1/2 year peak at 1.3995 has once again resumed n weakness to next daily chart obj. at 1.3477 (2014 low) wud be forthcoming soon this week n later twds 1.3454 (this is 50% proj. of 1.3995-1.3503 measured fm 1.3700), however, as the hourly indicators have already displayed 'bullish convergences', reckon 1.3396/99 (61.8% projection of 1.3991.3995-1.3503 n daily sup respectively) wud hold on 1st testing. On the upside, only a daily close abv 1.3589 (prev. sup, now res) wud be the 1st signal temporary low is in place, then stronger correction to 1.3640/50 wud be seen but res at 1.3700 shud remain intact.
. Today, we're holding a short position in anticipation of marginal fall with stop now abv 1.3549 res, break may risk retracement twd 1.3589. 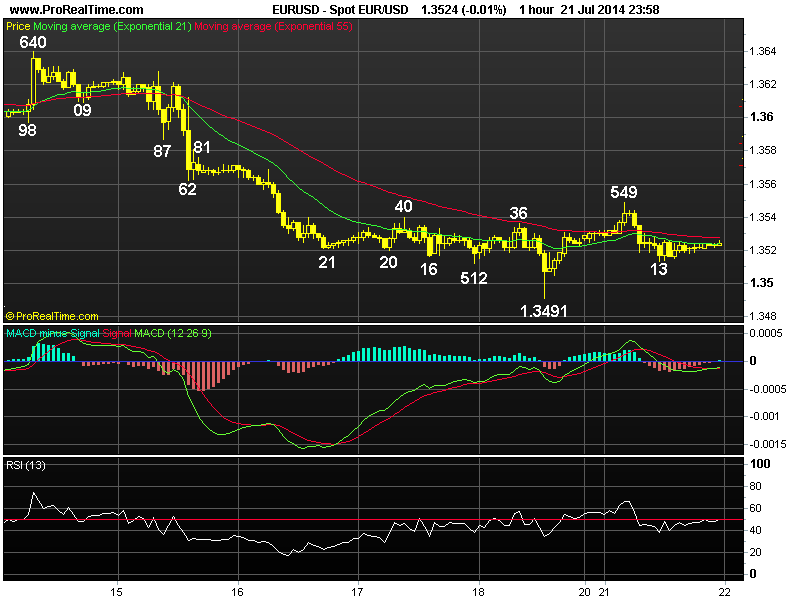
Posted by: acetraderforex Jul 23, 2014, 10:49 AM
AceTraderFx Jul 23: Daily Technical Outlook & Trading Ideals on USD/JPY DAILY USD/JPY TECHNICAL OUTLOOK
Last Update At 23 Jul 2014 02:09GMT
Trend Daily Chart
Sideways
Daily Indicators
Falling
21 HR EMA
101.47
55 HR EMA
101.44
Trend Hourly Chart
Sideways
Hourly Indicators
Turning down
13 HR RSI
54
14 HR DMI
+ve
Daily Analysis
Marginal rise b4 one more fall
Resistance
102.27 - July 03 high
101.79 - Last Wed's high
101.60 - Y'day's high
Support
101.20 - Mon's low
101.07 - Jul 10 low
100.76 - 2014 low (Feb 04)
. USD/JPY - 101.48... Dlr ratcheted higher on Tue as the rise in global stocks boosted risk sentiment. The pair climbed to 101.60 in NY morning after the release of U.S. CPI data n then retreated briefly to 101.34 but buying interest quickly emerged n lifted price to 101.57 b4 trading sideways.
. Looking at the hourly and daily charts, y'day's gain to 101.60 suggests the choppy consolidation abv Jul's 6-trough of 101.07 wud continue n although another rise twd 101.79 res cannot be ruled out, as long as this month's high at 102.27 holds, downside bias remains for recent decline fm Jun's peak at 102.80 to resume for a re-test of previous good sup area at 101.07/09, a break there wud pressure dlr twd 2014 bottom at 100.76 (Feb low) where a daily close below there wud confirm a 'downside break' of the near 7-month long broad sideways trading has finally taken place, then further losses to 100.00 n 99.60 (50% r of 93.75-105.45) wud follow later this month.
. Today, as long as 101.79 holds, selling dlr on recovery in anticipation of one more fall is still favoured n below 101.20 wud yield weakness to 101.07/09, then 100.95/00 but prev. strg sup at 100.76/81 shud hold. 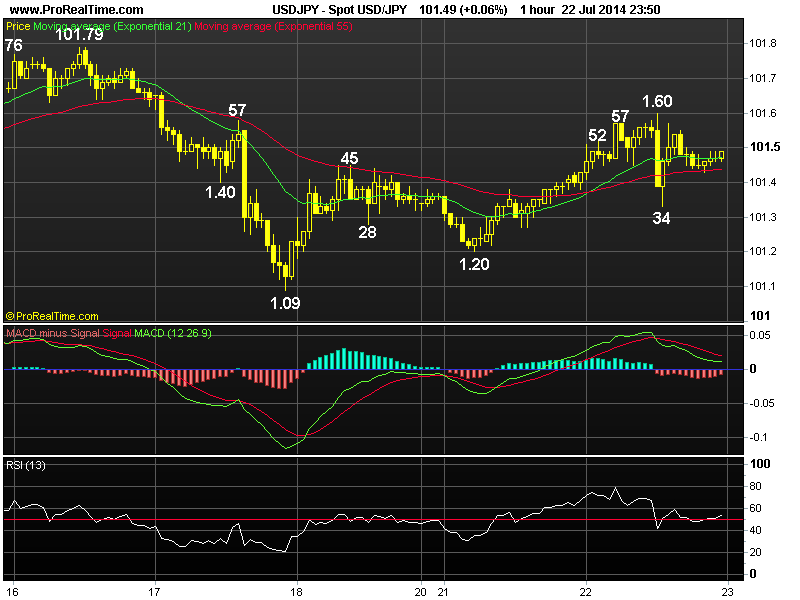
Posted by: acetraderforex Jul 28, 2014, 10:27 AM
AceTraderFx Jul 28: Weekly Technical Outlook & Trading Ideals on USD/CHF WEEKLY USD/CHF TECHNICAL OUTLOOK
Last Update At 27 Jul 2014 23:30GMT
Trend Daily Chart
Sideways
Daily Indicators
Rising
21 HR EMA
0.9041
55 HR EMA
0.9031
Trend Hourly Chart
Up
Hourly Indicators
Bearish divergences
13 HR RSI
66
14 HR DMI
+ve
Daily Analysis
Consolidation b4 upmove resumes
Resistance
0.9157 - Jan 21 high
0.9082 - Feb 03 high
0.9052 - Lst Fri's 5-1/2 mth high
Support
0.9038 - Last Thur's high
0.9008 - Last Thur's low
0.8972 - Mon's low
. USD/CHF - 0.9048... The pair moved in exact opposite direction to eur/usd last week. Price met renewed buying at 0.8972 on Mon n rallied to a 5-1/2 month peak of 0.9038 Thur. Despite a brief pullback to 0.9008, the pair later climbed to 0.9052 due to usd's broad-based strength in NY session on Fri.
. Let's look at the bigger picture 1st, dlr's break of Jun's 0.9037 high to 0.9052 Fri confirms the 3-legged MT upmove fm 2014 near 2-1/2 year bottom at 0.8698 (Mar) has resumed. As long as 0.9004/08 holds, aforesaid rise shud head to next daily obj. at 0.9082 (Feb's top), abv wud bode well for dlr to extend twd 2014 peak at 0.9156 (Jan high). Having said that, as the daily oscillators' readings wud be in o/bot territory on such move, upside wud be ltd to 0.9196, this is equality proj. of 0.8698-0.9037 measured fm 0.8857 n chart res at 0.9251 (Nov 2013 top) shud remain intact. On the downside, only a daily close below 0.8972 (last week's low) signals dlr's uptrend fm 0.8698 has made a temp. top.
. Today, as current price is trading abv 21-hr n 55-hr emas, buying on dips is favoured but 'bearish divergences' on the hourly indicators shud cap price at 0.9100/03 n risk has increased for a minor correction to take place later. 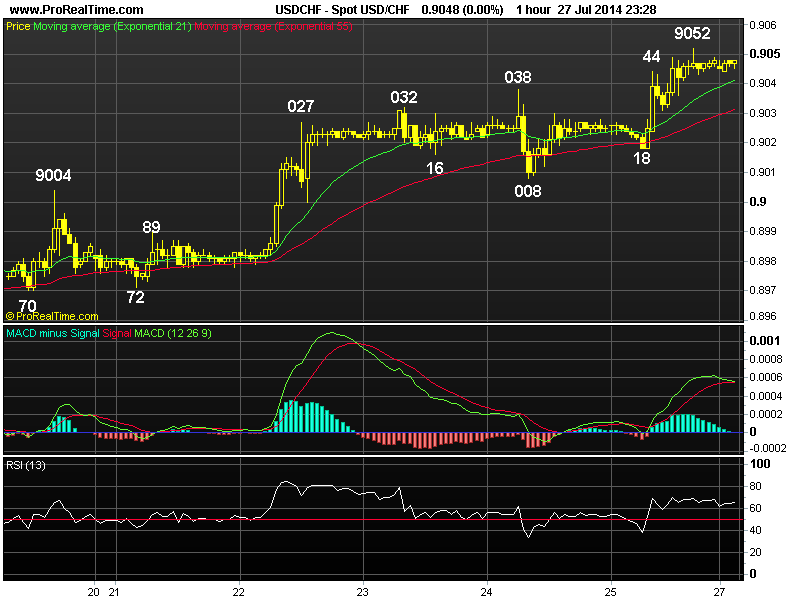
Posted by: acetraderforex Aug 1, 2014, 11:16 AM
AceTraderFx Aug 1: Daily Technical Outlook & Trading Ideals on USD/CHF DAILY USD/CHF TECHNICAL OUTLOOK
Last Update At 01 Aug 2014 00:15GMT
Trend Daily Chart
Sideways
Daily Indicators
Rising
21 HR EMA
0.9088
55 HR EMA
0.9081
Trend Hourly Chart
Up
Hourly Indicators
Turning down
13 HR RSI
52
14 HR DMI
-ve
Daily Analysis
Consolidation b4 uptrend resumes
Resistance
0.9194 - eq. proj. of 0.8698-0.9037 fm 0.8857
0.9157 - Jan 21 high
0.9110 - Wed's 6-month high
Support
0.9035 - Mon's low
0.9008 - Last Thur's low
0.8972 - Last Mon's low
. USD/CHF - 0.9088... Although dlr traded narrowly in tandem with eur/usd in Asia y'day n briefly edged lower to 0.9078 in European morning, the pair pared intra-day losses n rose to session high at 0.9103 at NY open. However, offers below 0.9110 top pressured price lower n dlr fell to 0.9076 in NY morning.
. The outlook remains similar to prev's update, where dlr's rally to a fresh 6-month high at 0.9110 on Wed confirms the 3-legged upmove fm Mar's 2-1/2 year trough at 0.8698 wud resume after consolidation b4 extending gain twds 2014 top at 0.9157 (Jan 21), abv wud yield marginal headway, however, as 'bearish divergences' on the hourly indicators wud appear on such a move, strg gain abv there is unlikely to be seen n reckon 0.9194 (equality proj. of 0.8698-0.9037 measured fm 0.8857) shud remain intact this week n bring a much-needed correction next week. On the downside, only below last Thur's low at 0.9008 wud confirm a temporary top has been made n risk stronger retracement twd 0.8972 (last Mon's low) in the early part of Aug.
. Today, we are holding a long position entered on Wed for gain to 0.9150 n only below Mon's 0.9035 wud risk stronger retracement twd 0.9008. 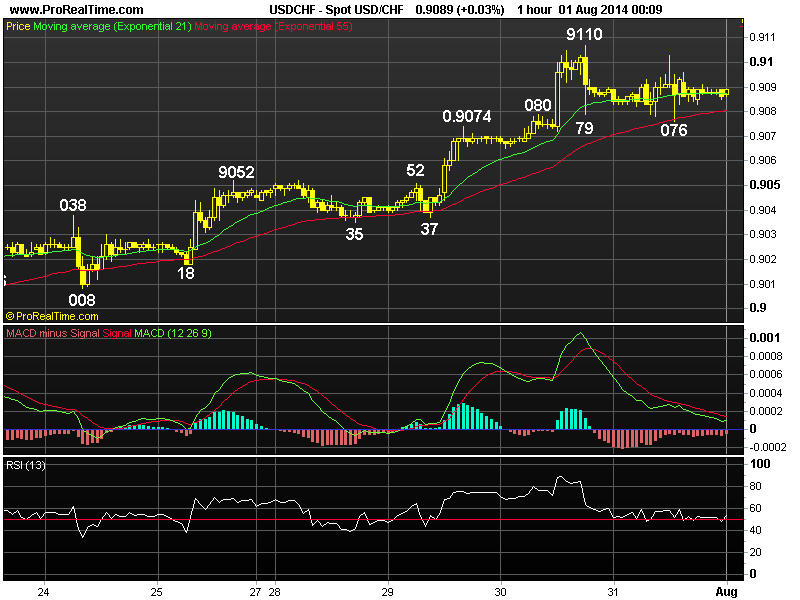
Posted by: acetraderforex Aug 5, 2014, 08:58 AM
AceTraderFx Aug 5: Daily Technical Outlook & Trading Ideals on USD/GBP
DAILY GBP/USD TECHNICAL OUTLOOK
Last Update At 05 Aug 2014 00:32GMT
Trend Daily Chart
Down
Daily Indicators
Falling
21 HR EMA
1.6848
55 HR EMA
1.6854
Trend Hourly Chart
Sideways
Hourly Indicators
Rising
13 HR RSI
68
14 HR DMI
+ve
Daily Analysis
Marginal recovery b4 strg retreat
Resistance
1.6956 - Last Wed's high
1.6928 - Last Wed's NY high
1.6893 - Last Thur's NY high
Support
1.6812 - Last Fri's 6-week low
1.6785 - Jun 12 low
1.6738 - Jun 11 low
. GBP/USD - 1.6864... Despite cable's brief drop to 1.6813 in Europe Mon after last Fri's brief bounce fm a fresh 6-week low of 1.6812 to 1.6862, renewed buying emerged n lifted price higher. Cable ratcheted higher on cross buying in sterling to 1.6864 in late NY, then 1.6867 ahead of Asian open today.
. Y'day's cross-inspired strg rebound after holding abv last Fri's low at 1.6812 suggests choppy consolidation wud be seen n as hourly indicators are rising, suggesting as long as 1.6812/13 sup area holds, upside bias remains for a stronger retracement of erratic decline fm Jul's near 6-year peak at 1.7192 n gain to 1.6884 may be seen but 1.6907 wud hold (being 38.2% n 50% r of intermediate fall fm 1.7001) n yield strg retreat. On the upside, only a daily close abv 1.6933 wud confirm temp. low is in place, then stronger gain twd 1.7001 (last week's high on Mon) wud be seen b4 down. Looking ahead, cable's early sell off fm 1.7192 to 1.6995 confirms a major top has been made n price is en route twd next daily chart obj. at 1.6738 later.
. Today, we're selling cable on intra-day rise for one more fall or buy if price briefly drops below 1.6812 in anticipation of another corrective bounce.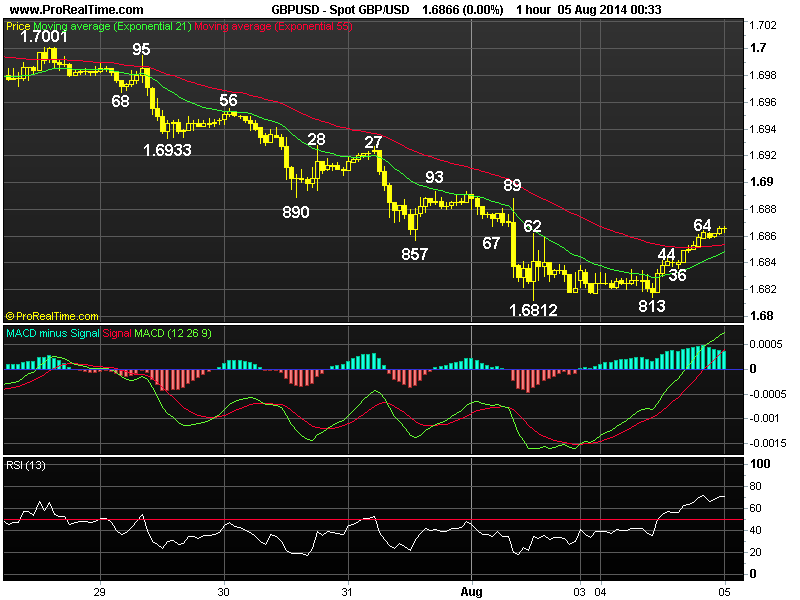
Posted by: acetraderforex Aug 6, 2014, 09:49 AM
AceTraderFx Aug 6: Daily Technical Outlook & Trading Ideals on EUR/USD
DAILY EUR/USD TECHNICAL OUTLOOK
Last Update At 06 Aug 2014 00:12GMT
Trend Daily Chart
Down
Daily Indicators
Falling
21 HR EMA
1.3383
55 HR EMA
1.3397
Trend Hourly Chart
Down
Hourly Indicators
Rising fm o/s
13 HR RSI
33
14 HR DMI
-ve
Daily Analysis
Resumption of MT downtrend
Resistance
1.3485 - Jul 24 high
1.3445 - Last Fri's high
1.3425 - Y'day's high
Support
1.3358 - Y'day's low
1.3332 - 61.8% proj. of 1.3549-1.3366 fm 1.3445
1.3295 - Nov 2013 low
. EUR/USD - 1.3372 ... Despite staging a brief bounce to 1.3425 at European open on Tue, the single currency came under renewed selling pressure after the release of weaker-than-expected Italy's Markit services PMI. Euro later tumbled to a near 9-mth low at 1.3359 on upbeat U.S. data n renewed tension in Ukraine.
. Looking at the bigger picture, euro's breach of last Wed's 8-1/2 month trough of 1.3366 confirms MT decline fm 2014 2-1/2 year peak at 1.3995 (May) has once again resumed n further weakness to 1.3332 (being 61.8% projection of 1.3549-1.3366 measured fm 1.3445) wud be forthcoming soon, below wud extend weakness twd 1.3295 (Nov 2013 low) later. On the upside, only a break of 1.3445 (reaction high after last Fri's U.S. jobs report) wud violate recent series of lower highs n lower low fm 1.3995 n signal a temporary low is finally in place n may bring stronger retracement to 1.3485 n 1.3503 (Jun's bottom).
. Today, in view current bearish analysis, selling euro on recovery in anticipation of further weakness is the way to go, however, low readings on the hourly oscillators shud prevent steep fall fm there n reckon previous daily sup at 1.3295 shud hold on 1st testing n yield rebound later. 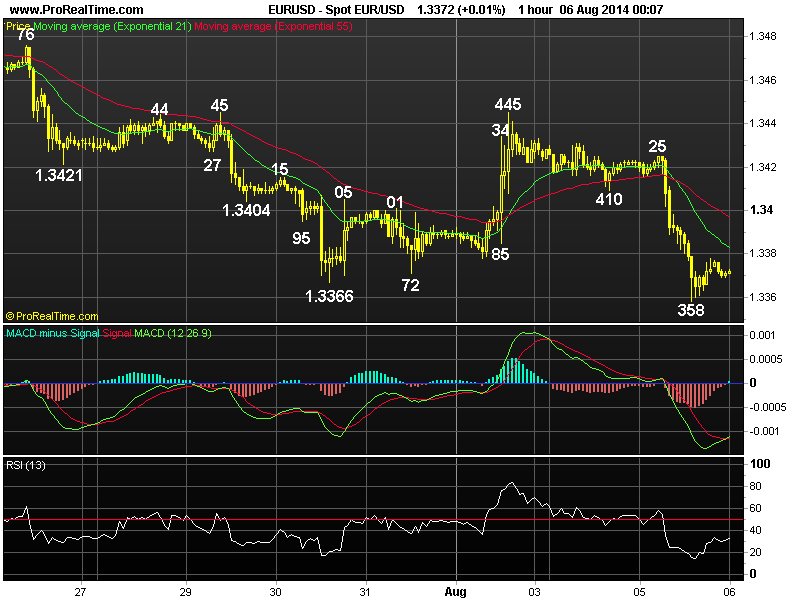
Posted by: acetraderforex Aug 7, 2014, 10:10 AM
AceTraderFx Aug 7: Daily Technical Outlook & Trading Ideals on USD/JPY DAILY USD/JPY TECHNICAL OUTLOOK
Last Update At 06 Aug 2014 23:50GMT
Trend Daily Chart
Sideways
Daily Indicators
Turning down
21 HR EMA
102.27
55 HR EMA
102.47
Trend Hourly Chart
Down
Hourly Indicators
Rising fm o/s
13 HR RSI
30
14 HR DMI
-ve
Daily Analysis
Consolidation b4 one more fall
Resistance
103.15 - Wed's high
102.93 - Tue's high
102.34 - Last Fri's low
Support
101.78 - Y'day's low
101.32 - Jul 23 low
101.07 - Jul 10 low
. USD/JPY - 102.10 ... The greenback ratcheted lower on Wed n penetrated Tue's low of 102.48 n then last Fri's low at 102.34 in Europe on renewed risk aversion due to rising tensions in Ukraine together with the selloff in European equities. Price later tumbled to 101.78 in New York session b4 recovering.
. Looking at the hourly & daily charts, y'day's sell off below 102.34 (the reaction low after last Fri's U.S. jobs report) to 101.79 confirms the early 3-legged upmove fm May's low at 100.81 has indeed formed a 3-1/2 month peak at 103.15 last Wed n as current price is trading below both 21-hr n 55-hr emas, suggesting choppy consolidation with downside bias remains for a stronger retracement of aforesaid erratic rise n below 101.70/72 (being 61.8% r of 100.81 -103.15 n chart sup respectively) wud bring further weakness to 101.50 (70.7% r) n possibly twds 101.26/32 (80.9% r n chart level), however, key daily chart sup area at 101.07/09 (Jul 10 n Jul 17 lows respectively) wud hold fm here.
. In view of abv analysis, selling dlr on recovery in anticipation of further weakness is favoured, however, profit shud be taken on next fall. On the upside, only a beach of 102.64 (y'day's high) wud confirm low is made, 102.93.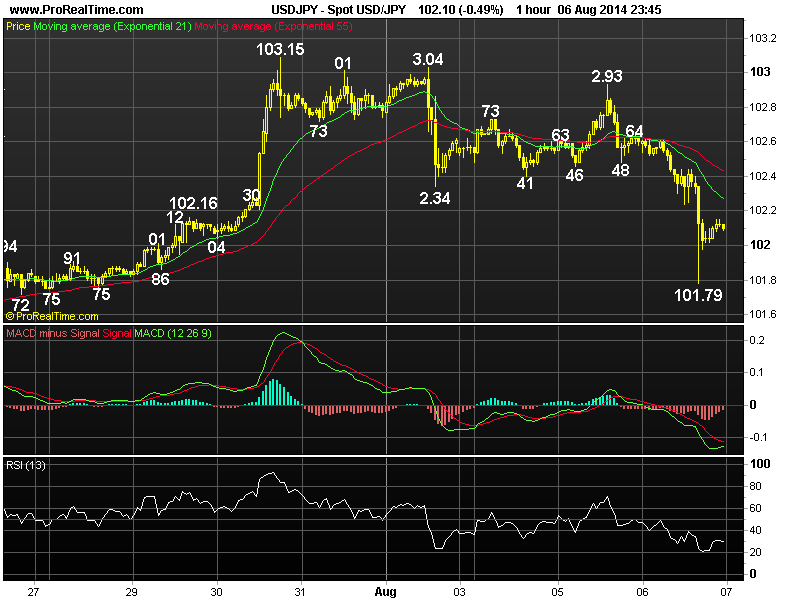
Posted by: acetraderforex Aug 11, 2014, 10:32 AM
AceTraderFx Aug 11: Weekly Technical Outlook & Trading Ideals on GBP/USD WEEKLY GBP/USD TECHNICAL OUTLOOK
Last Update At 11 Aug 2014 00:18GMT
Trend Daily Chart
Down
Daily Indicators
Falling
21 HR EMA
1.6789
55 HR EMA
1.6812
Trend Hourly Chart
Down
Hourly Indicators
Falling
13 HR RSI
39
14 HR DMI
-ve
Daily Analysis
Consolidation b4 decline resumes
Resistance
1.6890 - Last Tue's high
1.6865 - Last Thur's high
1.6812 - Jul 31 low (now res)
Support
1.6767 - Last Fri's low
1.6738 - Jun 11 low
1.6693 - May 29 low
GBP/USD - 1.6780... Despite staging a minor recovery to 1.6890 last Tue, the British pound continued its recent decent fm Jul's near 6-year peak at 1.7192 to a 7-week low of 1.6767 on Fri due to active selling of gbp vs eur & yen.
. Looking at the bigger picture, cable's aforesaid sell off from 1.7192 confirms the LT uptrend fm 1.3500 (2009 bottom) has indeed made a top there n current declining daily technical indicators suggest price is en route to re-test next daily chart obj. at 1.6693 (May's low), break of this key sup wud pressure price to 1.6655, being 61.8% proj. of said fall fm 1.7192 to 1.6812 measured fm 1.6890, as both daily & hourly oscillators' readings wud be in o/sold territory on such a move, steep fall is therefore not envisaged n reckon 1.6523, this is the 'natural' 50% r of the intermediate rise fm 1.5854 to 1.7192), wud contain weakness n bring correction later. Whilst selling cable again on recovery is the way to go, profit shud be taken on subsequent decline. On the upside, only abv 1.6890 wud confirm a temporary low is made but 1.6933 shud cap upside.
. Today, in view of abv analysis, selling cable on intra-day recovery is recommended but 1.6693 shud remain intact n bring minor correction.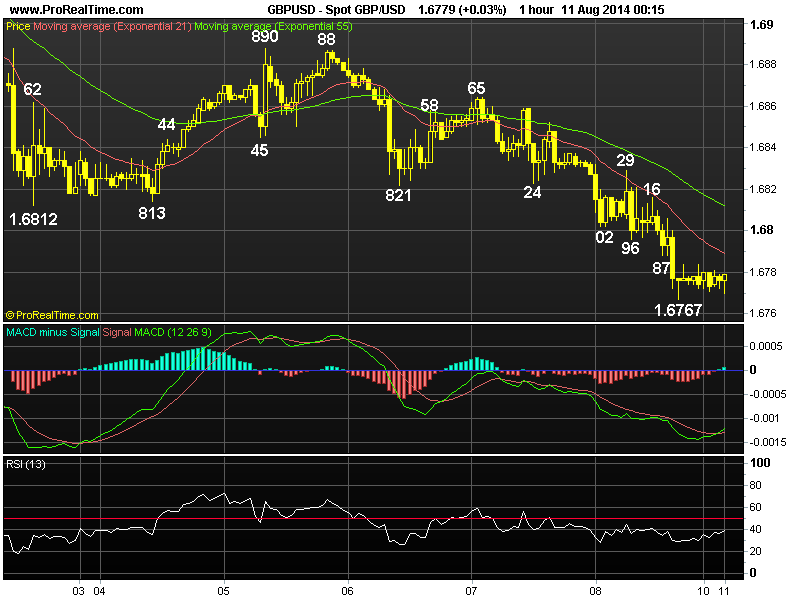
Posted by: acetraderforex Aug 12, 2014, 10:01 AM
AceTraderFx Aug 12: Daily Technical Outlook & Trading Ideals on USD/JPY DAILY USD/JPY TECHNICAL OUTLOOK
Last Update At 11 Aug 2014 23:48GMT
Trend Daily Chart
Sideways
Daily Indicators
Turning down
21 HR EMA
102.15
55 HR EMA
102.12
Trend Hourly Chart
Near term up
Hourly Indicators
Rising
13 HR RSI
62
14 HR DMI
+ve
Daily Analysis
Marginal rise b4 retreat
Resistance
102.93 - Last Tue's high
102.46 - Last Thur's high
102.34 - Aug 01 low
Support
101.78 Last Wed's low
101.51 - Last Fri's low
101.32 - Jul 23 low
. USD/JPY - 102.23 ... Despite dlr's gap-up opening to 102.22 in New Zealand on Monday following last Fri's rally fm a 2-week low of 101.51, the pair then traded narrowly below there in Asia n retreated briefly to 102.02 in European morning b4 edging high in New York, price climbed to 102.26 in Australia.
. Looking at the bigger picture, despite the 3-legged rise fm May's 100.81 trough to 103.15 twd end of July, subsequent cross-inspired selloff to 101.51 signals aforesaid upmove has indeed made a top there. As mentioned in previous updates, dlr's MT choppy sideways move inside the established broad 105.45-100.76 range is expected to continue n the decline fm 103.15 adds credence to this view n as long as 102.46 res (last Thur's high) holds, consolidation with initial downside bias wud be seen n below 101.51 wud bring another drop twd 101.26 (being 80.9% r of 100.81-103.15), however, only a firm breach of 100.76/81 sup area wud bring stronger correction of the LT uptrend fm 79.75-105.45 (however, this is not an anticipated scenario).
. Today, in view of abv analysis, selling dlr on intra-day rise in anticipation of a subsequent fall is favoured. Abv 102.46 wud defer n risk 102.93 res.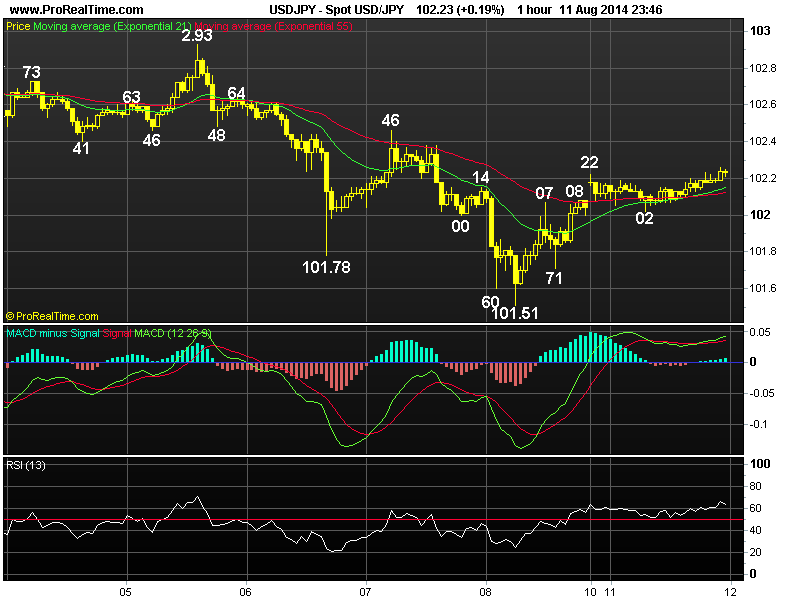
Posted by: acetraderforex Aug 13, 2014, 11:05 AM
AceTraderFx Aug 13: Daily Technical Outlook & Trading Ideals on EUR/USD DAILY EUR/USD TECHNICAL OUTLOOK
Last Update At 12 Aug 2014 23:59GMT
Trend Daily Chart
Down
Daily Indicators
Falling
21 HR EMA
1.3366
55 HR EMA
1.3373
Trend Hourly Chart
Sideways
Hourly Indicators
Turning up
13 HR RSI
49
14 HR DMI
-ve
Daily Analysis
Choppy consolidation b4 one more fall
Resistance
1.3445 - Aug 01 high
1.3433 - Last Fri's high
1.3408 - Last Fri's European high
Support
1.3333 - Last Wed's fresh near 9-month low
1.3269 - 61.8% proj. of 1.3650-1.3366 fm 1.3445
1.3223 - 61.8% r of 1.2745-1.3995
. EUR/USD - 1.3366 ... Euro ratcheted lower y'day after last Fri's short-covering rally to 1.3433. Price tanked to an intra-day low at 1.3337 in European midday after weak ZEW economic sentiment b4 staging a recovery to 1.3370 in NY.
. Y'day's fall to 1.3337 strongly suggests the correction fm last Wed's near 9-month trough of 1.3333 has ended at 1.3433 last Fri n as long as 1.3408 holds, downside bias remains for MT downtrend fm May's 2-1/2 year peak at 1.3995 to resume after choppy consolidation, n below 1.3333/37 sup area wud confirm, yield further weakness twds next daily chart obj. at 1.3295 (Nov 2013 low), however, as hourly oscillators wud display bullish convergences on next decline, suggesting steep fall below said daily sup is unlikely n reckon 1.3269 (61.8% proj. of 1.3650-1.3366 measured fm 1.3445) wud hold n yield a much-needed correction later. On the upside, only a breach of 1.3433 wud bring stronger retracement of the intermediate fall fm 1.3650 to 1.3454 but 1.3485/91 (prev. daily res n 50% r respectively) shud cap upside.
. Today, we're cautiously selling euro on intra-day recovery in anticipation of such marginal fall. Abv 1.3408 risks 1.3433, break, 1.3445/50.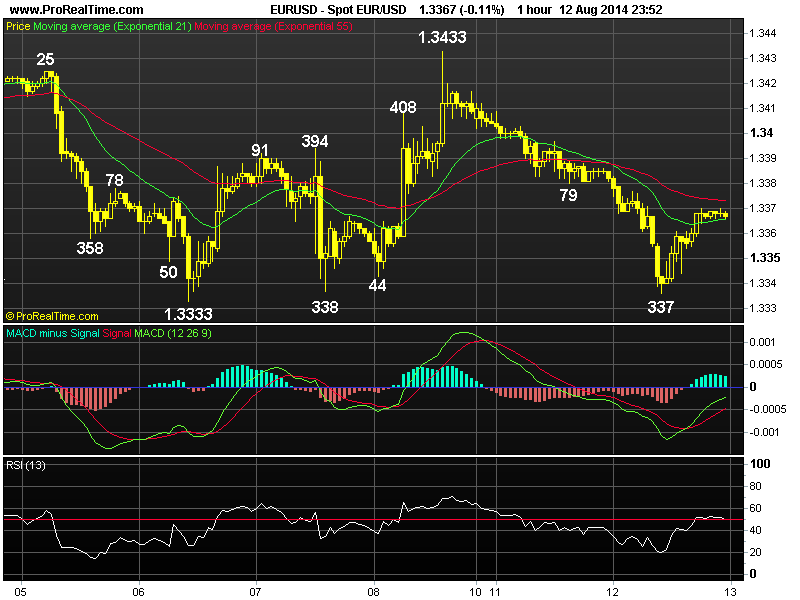
Posted by: acetraderforex Aug 19, 2014, 10:29 AM
AceTraderFx Aug 19: Daily Technical Outlook & Trading Ideals on USD/JPY DAILY EUR/USD TECHNICAL OUTLOOK
Last Update At 19 Aug 2014 00:02GMT
Trend Daily Chart
Down
Daily Indicators
Falling
21 HR EMA
1.3371
55 HR EMA
1.3376
Trend Hourly Chart
Sideways
Hourly Indicators
Falling
13 HR RSI
37
14 HR DMI
-ve
Daily Analysis
Consolidation with downside bias
Resistance
1.3485 - July 24 high
1.3433 - Aug 08 high
1.3412 - Last Fri's high
Support
1.3348 - Last Thur's low
1.3333 - Last Wed's fresh near 9-month low
1.3295 - Nov 07 2013 low
. EUR/USD - 1.3360 ... The single currency met renewed selling below 1.3400 level on Monday n later fell to 1.3353 in NY morning due to usd's strength on gain in U.S. homebuilder confidence, however, euro moved narrowly in NY afternoon on lack of follow-through selling.
. Looking at the hourly n daily charts, we've taken the view euro's choppy price action fm Aug's near 9-month trough of 1.3333 is possibly unfolding into a 'bearish triangle' pattern (with a-leg top at 1.3433, b-leg trough at 1.3336 n c-leg top at 1.3416, d-leg trough at 1.3348 n e-leg top has 'possibly' ended at 1.3412 Fri), if this view is correct, then MT fall fm May's 2-1/2 year peak at 1.3995 shud resume later this week n bring weakness to next daily chart object. at 1.3295 n later 1.3237 (61.8% proj. of the intermediate fall fm 1.3650-1.3333 measured fm 1.3433). On the upside, only a breach of 1.3433 wud signal an upside break of 1.3333-1.3433 range has taken place instead, then risk wud shift to upside for a stronger correction twd 1.3491 (50% r of 1.3650-1.3333).
. Today, we're holding early short position for weakness twd 1.3348 1st but 1.3333 wud remain intact. Only abv 1.3433 risks gain to 1.3475 b4 down.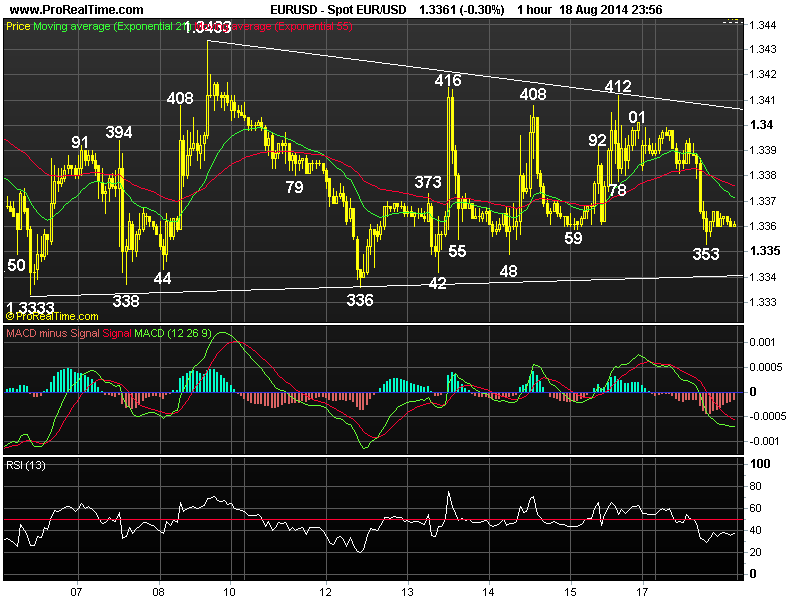
Posted by: acetraderforex Aug 20, 2014, 10:18 AM
AceTraderFx Aug 20: Daily Technical Outlook & Trading Ideals on GBP/USD DAILY GBP/USD TECHNICAL OUTLOOK
Last Update At 20 Aug 2014 00:29GMT
Trend Daily Chart
Down
Daily Indicators
Falling
21 HR EMA
1.6641
55 HR EMA
1.6674
Trend Hourly Chart
Down
Hourly Indicators
Rising fm o/s
13 HR RSI
21
14 HR DMI
-ve
Daily Analysis
Resumption of recent decline
Resistance
1.6739 - Mon's high
1.6680 - Last Fri's NY low
1.6657 - Last Thur's low (now res)
Support
1.6611 - Y'day's 4-month low
1.6584 - 1.618 ext. of 1.7001-1.6812 fm 1.6890
1.6554 - Apr 04 low
. GBP/USD - 1.6720 ...Despite Mon's brief bounce to 1.6739 in NZ following BoE Carney's hawkish comments in UK Sun Times, the British pound tumbled on Tue after the release of surprise lower-than-expected U.K. CPI data. Price easily penetrated last Thur's 1.6657 trough to a fresh 4-month low at 1.6611 in NY.
. Looking at the hourly n daily charts, y'day's selloff confirms MT down-trend fm Jul's near 6-year peak of 1.7192 resumed n a stronger retracement of the LT uptrend fm 2009 trough at 1.3500 remains in force n as long as 1.6739 res holds, downside bias remains for further weakness to next daily minor sup at 1.6551, however, as hourly oscillators wud display minor bullish convergences on next fall, suggesting downside wud be ltd to 1.6523/10 (50% r of 1.5854-1.7192 n equality proj. of 1.7192-1.6812 fm 1.6890 respectively) n risk fm there has increased for a much-needed rebound.
. In view of current bearish scenario, selling cable again on recovery in anticipation of further weakness is the way to go. On the upside, only a breach of 1.6739 res (Mon's high) wud violate recent series of lower high n lower lows fm 1.7192 top (Jul) n risk stronger retracement to 1.6780/90.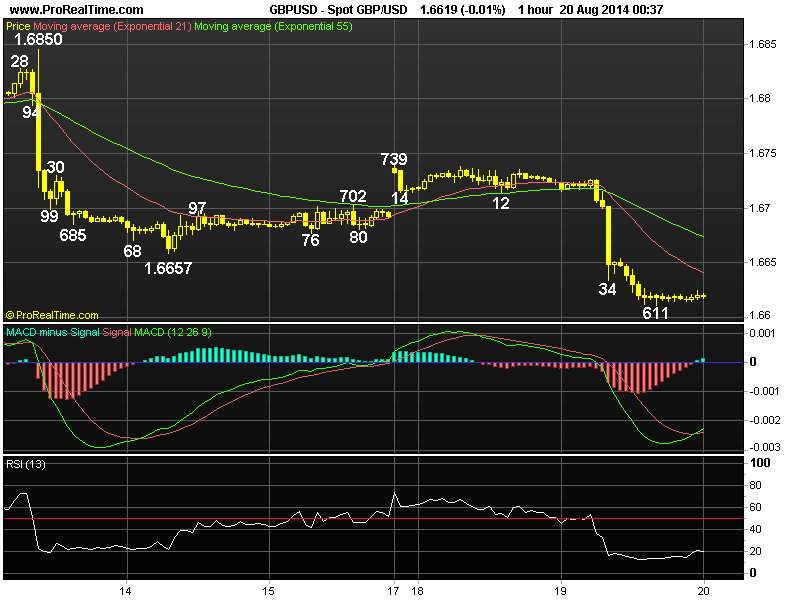
Posted by: acetraderforex Aug 25, 2014, 09:30 AM
AceTraderFx Aug 25: Daily Outlook on Major USD/JPY DAILY MARKET OUTLOOK USD/JPY - 104.11
Update Time: 25 Aug 2014 07:58 GMT
The greenback's rise above April's peak at 104.13 last Friday and then to a fresh multi-month peak at 104.19 in New Zealand today signals an upside break of the 7-1/2 month broad sideways move from 105.45 9Jan) has taken place and consolidation with upside bias remains for gain 104.77, however, near term loss of momentum should cap price below said res today and yield minor correction later.
On the downside, only below 103.50 would indicate a temporary top has been formed instead and shift risk to the downside for a retracement to 103.15.
Posted by: acetraderforex Aug 26, 2014, 10:30 AM
AceTraderFx Aug 26: Daily Technical Outlook & Trading Ideals on GBP/USD DAILY GBP/USD TECHNICAL OUTLOOK
Last Update At 26 Aug 2014 00:38GMT
Trend Daily Chart
Down
Daily Indicators
Falling
21 HR EMA
1.6575
55 HR EMA
1.6580
Trend Hourly Chart
Sideways
Hourly Indicators
Neutral
13 HR RSI
45
14 HR DMI
+ve
Daily Analysis
Consolidation b4 marginal fall
Resistance
1.6680 - Last Wed's high
1.6655 - Last Wed's NY high
1.6602 - Last Thur's high
Support
1.6535 - Y'day's NZ low
1.6523 - 50% r of 1.5854-1.7192
1.6460 - Mar 24 low
. GBP/USD - 1.6570... The British pound opened lower in tandem with euro
to 1.6535 in NZ on Mon following Fri's balanced comments fm Fed Chair Yellen n
Sat's 'dovish' remarks from BOE Dep. Governor Ben Broadbent in Jackson Hole but
short-covering lifted price to 1.6599 ahead of NY open b4 retreating.
. Although cable's rebound fm said y'day's fresh 4-1/2 month trough at
1.6535 suggests a temporary low has been been made n choppy consolidation wud be
seen, as daily technical indicators are still pointing hard down, suggesting as
long as 1.6655/57 (being 38.2% r of 1.6850-1.6535 n Aug 14 low, now res respect-
ively) holds, bearishness remains for MT decline fm Jul's near 6-year peak at
1.7192 to resume n yield a re-test of said sup, below wud extend marginal weak-
ness below 1.6523 (50% r of LT intermediate rise fm 1.5854-1.7192), however,
prominent 'bullish convergences' on the hourly oscillators shud limit downside
to 1.6500/10 n yield a much-needed correction later.
. Today, selling cable on further recovery in anticipation of a resumption
of decline is still favoured, however, one may turn cautious buyer on next margi
nal fall for a rebound but reckon 1.6657 (prev. low, now res) shud cap upside.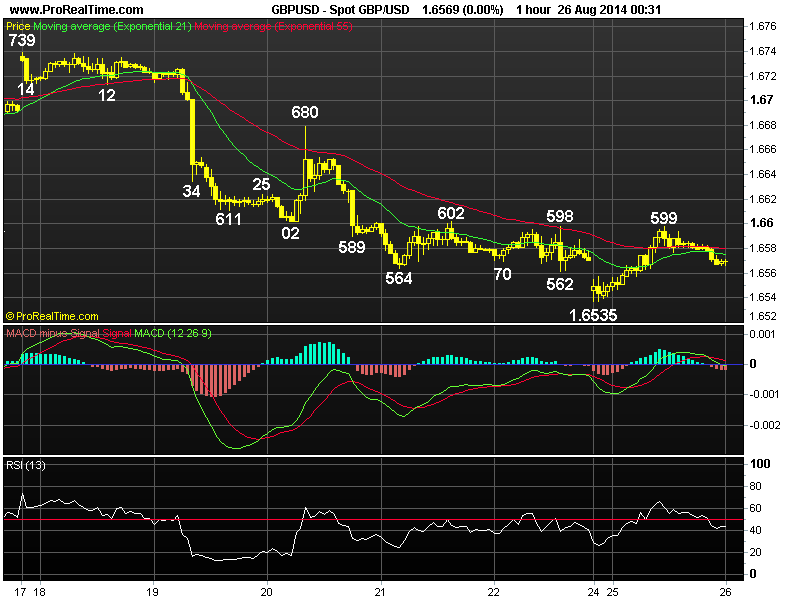
Posted by: acetraderforex Aug 27, 2014, 09:46 AM
AceTraderFx Aug 27: Daily Technical Outlook & Trading Ideals on USD/CHF DAILY USD/CHF TECHNICAL OUTLOOK
Last Update At 27 Aug 2014 00:08GMT
Trend Daily Chart
Up
Daily Indicators
Rising
21 HR EMA
0.9166
55 HR EMA
0.9155
Trend Hourly Chart
Up
Hourly Indicators
Bearish divergences
13 HR RSI
65
14 HR DMI
+ve
Daily Analysis
Marginal rise b4 retreat
Resistance
0.9251 - Nov 07 (2013)
0.9202 - 80.9% proj. of 0.9024-0.9146 fm 0.9104
0.9181 - Y'day's 9-month high
Support
0.9138 - Y'day's low
0.9104 - Last Fri's low
0.9088 - Last Wed's low
. USD/CHF - 0.9178... Despite initial dlr's decline fm 0.9164 (Asia) to
0.9138 at European open due to intra-day rebound in eur/usd, renewed weakness in
euro plus rebound in eur/chf cross helped the pair ratchet higher, dlr later
climbed one tick abv Mon top to a fresh 9-month high of 0.9181 in NY.
. Let's look at the daily picture 1st, y'day's rise to 0.9181 confirms the
3-legged MT upmove fm Mar's near 2-1/2 year bottom at 0.8698 has once again
resumed n further headway to 0.9200/02 (psychological lvl n 80.9% projection of
0.9024-0.9146 measured fm 0.9104 respectively) is seen. Abv said upside targets
wud extend marginally, however, anticipated 'bearish divergences' on the hourly
indicators wud prevent strg gain n reckon price wud hold well below daily res at
0.9251 (Nov '13) n yield a much-needed correction later this week. On the down-
side, only below 0.9104 wud indicate a temporary top has been made n risk stron-
ger retracement twd 0.9058 (last Wed's low), then twds 0.9024 (Aug 15 bottom).
. Today, in view of abv analysis, one can buy dlr on dips for marginal
gain after consolidation or sell on next intra-day upmove in expectation of a
minor correction to take place. Below 0.9138 signals temp. top made, 0.9104/07. 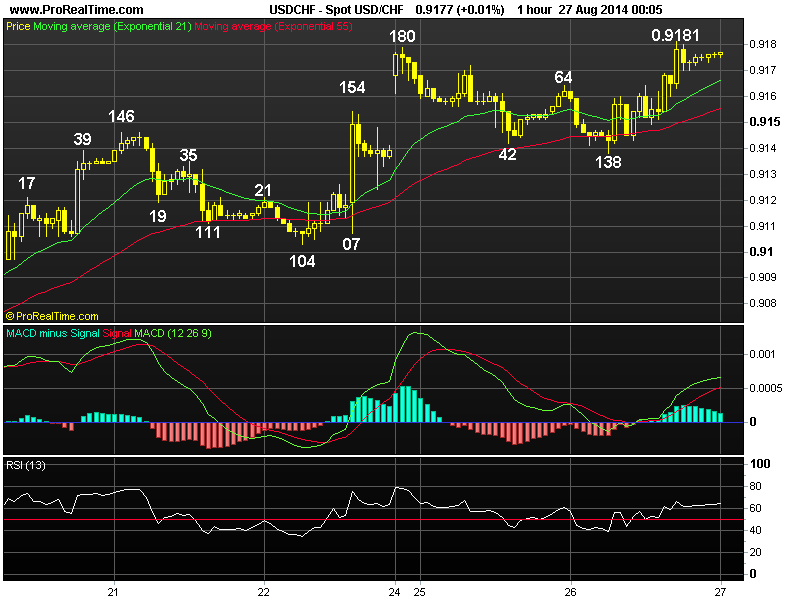
Posted by: acetraderforex Aug 29, 2014, 11:08 AM
AceTraderFx Aug 29: Daily Technical Outlook & Trading Ideals on EUR/USD DAILY EUR/USD TECHNICAL OUTLOOK
Last Update At 29 Aug 2014 00:29GMT
Trend Daily Chart
Down
Daily Indicators
Falling
21 HR EMA
1.3185
55 HR EMA
1.3190
Trend Hourly Chart
Sideways
Hourly Indicators
Bullish convergences
13 HR RSI
49
14 HR DMI
-ve
Daily Analysis
Consolidation b4 marginal fall
Resistance
1.3297 - Last Fri's high
1.3242 - Last Thur's low (now res)
1.3221 - Y'day's high
Support
1.3152 - Wed's fresh near 1-year low
1.3105 - Sep 06 low
1.3066 - 100% proj. of 1.3700-1.3333 fm 1.3433
. EUR/USD - 1.3185 ... Although euro ratcheted higher to 1.3221 on short-covering at European open on Thur, renewed selling emerged after data showed EZ economic sentiment dropped in Aug n price retreated to 1.3199. Euro tumbled to 1.3160 due to renewed tensions in Ukraine n upbeat U.S. GDP b4 recovering.
. Looking at the hourly & daily charts, y'day's strg retreat fm 1.3221 suggests correction fm Wed's near 1-year low at 1.3152 has ended there n as long as 1.3221 holds, the MT downtrend fm May's 2-1/2 year peak at 1.3995 to retrace the entire MT rise fm 2012 bottom at 1.2042 shud resume after consolidation, below said sup wud extend marginally to 1.3131 (being 61.8% r proj. of 1.3296-1.3152 measured fm 1.3220), however, as hourly indicators have already displayed prominent 'bullish convergences', reckon daily sup at 1.3105 wud hold on 1st testing n bring a much-needed correction. A daily close abv 1.3221 wud signal temp. low is made, then euro wud head twd 1.3280/90 next week b4 prospect of another fall.
. Today, we're holding short in anticipation of one more decline n profit shud be taken on such a move as volatility may increase on month-end position adjustmet. Pay attention to the closely watched eurozone inflation at 09:00GMT !.png)
Posted by: acetraderforex Sep 1, 2014, 10:40 AM
AceTraderFx Sept 1:Weekly Technical Outlook & Trading Ideals on GBP/USD WEEKLY GBP/USD TECHNICAL OUTLOOK
Last Update At 01 Sep 2014 00:05GMT
Trend Daily Chart
Down
Daily Indicators
Falling
21 HR EMA
1.6589
55 HR EMA
1.6586
Trend Hourly Chart
Sideways
Hourly Indicators
Neutral
13 HR RSI
53
14 HR DMI
+ve
Daily Analysis
Consolidation b4 one more fall
Resistance
1.6680 - Last Wed's high
1.6657 - Aug 14 low
1.6615 - Last Thur's high
Support
1.6535 - Last Mon's low (NZ)
1.6523 - 50% r of 1.5854-1.7192
1.6460 - Mar 24 low
. GBP/USD - 1.6593... Despite a gap-down open to a 4-1/2 month trough of 1.6535 in NZ last Mon, cable swung wildly for rest of the week. Price staged a short-covering rebound to 1.6599 on Mon b4 falling back to 1.6537 at Wed open but only to climb to a 1-week high of 1.6615 Thur, then moved sideways on Fri.
. Looking at the bigger picture, although sterling finally found respite after enduring 6 weeks of losing streak n initial choppy trading abv 1.6535 is envisaged, a daily close abv 1.6657 (prev. low) is needed to confirm MT fall fm 2014 6-year peak at 1.7192 (Jul) has finally made a temporary low, then stronger gain to 1.6680 res wud be seen, a break there wud violate the recent series of lower highs n lower lows n yield corerction twd 1.6864 (50% r of 1.7192-1.6535).
Until then, as dlr is expected to rise vs its major peers, selling the pound in anticipation of resumption of MT downtrend to 1.6523 (50% r of LT intermediate rise fm 1.5854-1.7192) is still favoured, reckon daily up at 1.6460 (Mar low) may hold on 1st testing.
. Today, intra-day weakness in eur/usd shud weigh on cable n as long as 1.6615 holds, decline twd 1.6535 is likely n only abv 1.6555/57 risks 1.6580.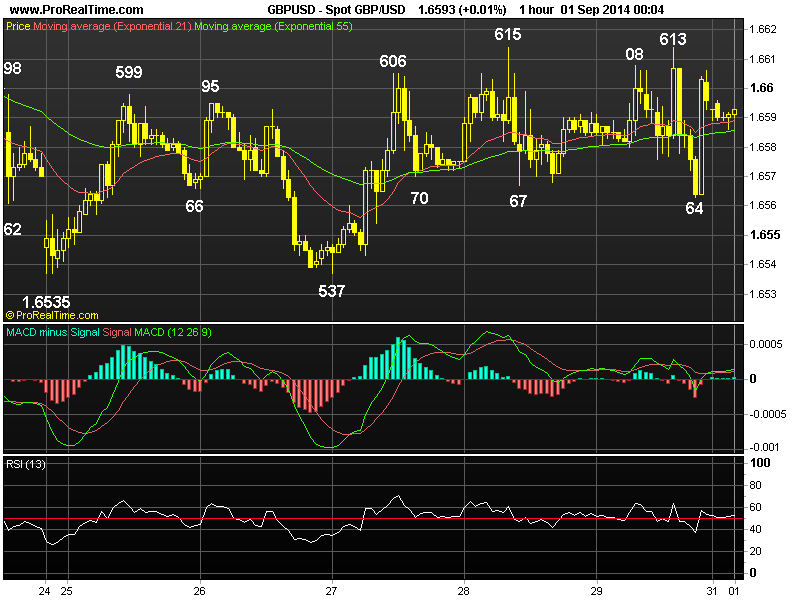
Posted by: acetraderforex Sep 2, 2014, 10:50 AM
AceTraderFx Sept 2: Daily Technical Outlook & Trading Ideals on USD/CHF DAILY USD/CHF TECHNICAL OUTLOOK
Last Update At 01 Sep 2014 23:58GMT
Trend Daily Chart
Up
Daily Indicators
Rising
21 HR EMA
0.9191
55 HR EMA
0.9179
Trend Hourly Chart
Up
Hourly Indicators
Bearish divergences
13 HR RSI
61
14 HR DMI
+ve
Daily Analysis
Consolidation b4 one more rise
Resistance
0.9298 - Sep 19 high (2013)
0.9251 - Nov 07 high (2013)
0.9198 - Last Fri's n Mon's fresh 9-mth high
Support
0.9163 - Last Fri's Euroepan morning high (now sup)
0.9126 - last Thur's low
0.9104 - Aug 22 low
. USD/CHF - 0.9194... Although the greenback opened higher n resumed its recent winning streak to a fresh 9-month high at 0.9198 in NZ, price retreated to 0.9177 in European morning on rebound in eur/usd. However, dlr found renewed buying in European session n climbed back to 0.9198 near Mon's closing.
. Looking at the hourly n daily charts, y'day's gain to 0.9198 signals the 3-legged rise fm Mar's 2-1/2 year trough at 0.8698 remains in progress n further gain twd daily res at 0.9251 (Nov '13) wud be seen this week, abv wud extend marginally, however, anticipated 'bearish divergences' on the hourly oscillators wud prevent strg gain abv there n reckon res 0.9898/00 (Sep 19 high n psychological lvl respectively.) shud remain intact this week n risk wud increase for a much-needed correction later. On the downside, only a daily close below sup at 0.9104 (Aug 22 trough) wud indicate a temporary top has been made n risk stronger correction twd chart sup at 0.9058.
. Today, in view of abv analysis, we are buying dlr on intra-day pullback for gain to 0.9215/20 n only below last Thur's low at 0.9126 wud abort daily bullishness n risk retracement twd 0.9104.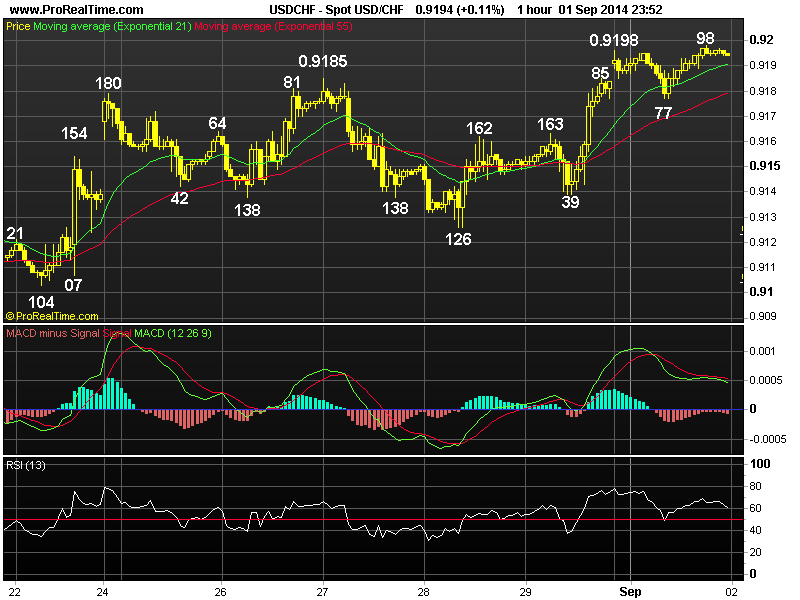
Posted by: acetraderforex Sep 3, 2014, 10:39 AM
AceTraderFx Sept 3: Daily Technical Outlook & Trading Ideals on USD/JPY
DAILY USD/JPY TECHNICAL OUTLOOK
Last Update At 02 Sep 2014 23:52GMT
Trend Daily Chart
Up
Daily Indicators
Rising
21 HR EMA
104.97
55 HR EMA
104.63
Trend Hourly Chart
Up
Hourly Indicators
Bearish divergences
13 HR RSI
84
14 HR DMI
+ve
Daily Analysis
Resumption of recent up move
Resistance
106.26 - 1.618 times ext. of 100.76-104.13 fm 100.81
105.91 - 2.618 ext. of 103.56-104.25 fm 104.10
105.45 - Jan 02 5-year high
Support
104.78 - Tue's European low
104.49 - last Mon's NZ high (Reuters)
104.10 - Mon's European low
. USD/JPY - 105.24 ... The greenback jumped shortly after Tokyo open on Tue on speculation PM Abe will appoint a minister who will increase the national pension fund twd riskier assets led to rally in the Nikkei. Price climbed to a fresh 8-month high of 105.21 in NY morning after the release of stronger-than-expected U.S. ISM manufacturing PMI data. Dlr then rose to 105.27 in Aust. Wed.
. Looking at the hourly n daily charts, y'day's rally after early breach of Apr's 104.13 high confirms an 'upside break' of the 7-month long broad sideways consolidation fm Jan's 5-year peak at 105.45 has indeed taken place n a breach of aforesaid 2014 high at 105.45 will be forthcoming soon to confirm LT rise fm 75.32 (2011 record low) has finally resumed n yield further gain to 106.26 (being 1.618 times extension of 100.76-104.13 measured fm 100.81) n later twd 107.06, this is 50% proj. of 77.13-103.74 fm 96.73). On the downside, only a breach of 104.13 (Apr's high, now sup) wud signal a temporary top is made n risk stronger pullback to 103.81 but sup at 103.56 is expected to remain intact.
. In view of abv analysis, buying dlr again on dips in anticipation of a re-test of 105.45 res is favoured. Only a breach of 104.49 indicates top, 104.10.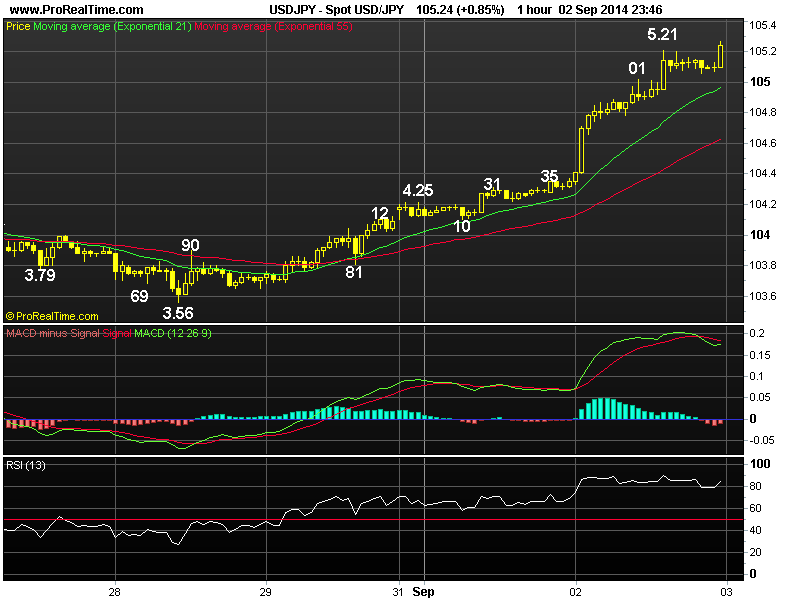
Posted by: acetraderforex Sep 4, 2014, 11:05 AM
AceTraderFx Sept 4: Daily Technical Outlook & Trading Ideals on EUR/USD DAILY EUR/USD TECHNICAL OUTLOOK
Last Update At 04 Sep 2014 00:03GMT
Trend Daily Chart
Down
Daily Indicators
Falling
21 HR EMA
1.3142
55 HR EMA
1.3139
Trend Hourly Chart
Sideways
Hourly Indicators
Rising
13 HR RSI
58
14 HR DMI
+ve
Daily Analysis
Consolidation b4 one more fall
Resistance
1.3221 - Last Thur's high
1.3196 - Last Fri's high
1.3160 - Y'day's high
Support
1.3110 - Tue's near 1-year low
1.3105 - Sep 13' low
1.3066 - Jul 18 2013 low
. EUR/USD - 1.3149 ... Despite Tue's weakness to a fresh near 1-year low at 1.3110, euro rebounded on Wed on short-covering ahead of Thur's ECB policy decision. Price jumped to 1.3156 on rumors of a ceasefire agreement between Ukraine n Russia. The single currency later rose to 1.3160 in NY b4 retreating.
. Looking at the hourly n daily charts, although euro's recovery fm Tue's low at 1.3110 suggests minor consolidation wud be seen, as long as res at 1.3196 (last Fri's high) holds, the MT downtrend fm May's 2-1/2 year peak at 1.3995 to retrace the entire MT rise fm 2012 bottom at 1.2042 shud resume later for a retest of previous daily sup at 1.3105 (Sep 13' low), then 1.3066, this is a minor daily chart sup as well as 100% projection of intermediate fall fm 1.3700-1.3333 fm 1.3433. Having said that, as the hourly oscillators' readings wud display very prominent bullish convergences on this move, reckon 'psychological' sup at 1.3000 wud hold n bring a long overdue minor correction.
. Today, selling on recovery in anticipation of one more fall is favoured, however, profit shud be taken on next decline. Abv said 1.3196 res wud risk correction to 1.3221, a daily close abv there wud yield stronger gain twd 1.3271. 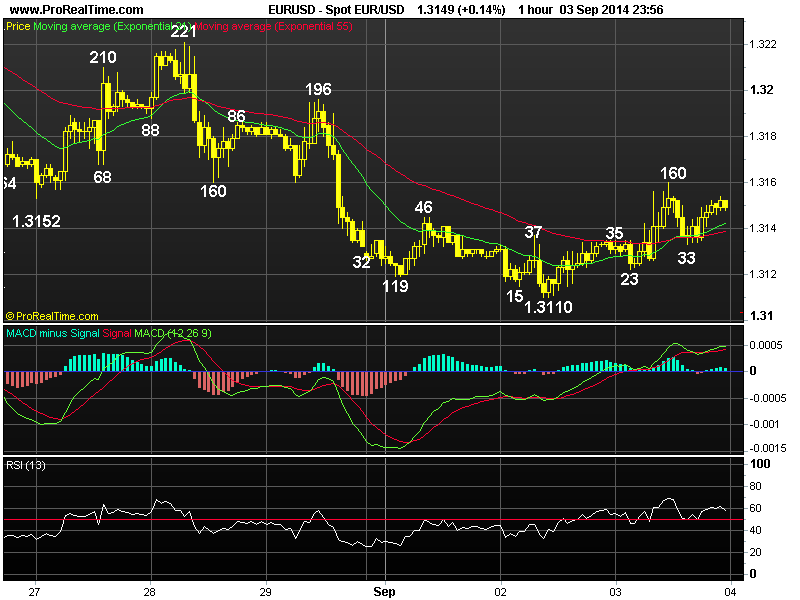
Posted by: acetraderforex Sep 10, 2014, 11:05 AM
AceTraderFx Sept 10: Daily Technical Outlook & Trading Ideals on USD/JPY DAILY USD/JPY TECHNICAL OUTLOOK
Last Update At 10 Sep 2014 00:02GMT
Trend Daily Chart
Up
Daily Indicators
Rising
21 HR EMA
106.17
55 HR EMA
105.87
Trend Hourly Chart
Up
Hourly Indicators
Bearish divergences
13 HR RSI
50
14 HR DMI
-ve
Daily Analysis
Consolidation b4 one more rise
Resistance
106.96 - 2.618 times ext. of 101.07-103.15 fm 101.51
106.61 - 50% proj. of 93.75-105.45 fm 100.76
106.47 - Y'day's fresh near 6-year high
Support
105.95 - Y'day's low (AUS)
105.71 - Last Fri's high, now sup
105.23 - Mon's Asian high
. USD/JPY - 106.14 ... The greenback maintained a firm undertone on Tue n rose to 106.39 in European morning, then later to a fresh 6-year high of 106.49 in NY due to dollar's broad-based strength but weakness in the U.S. stocks triggered profit-taking in the dlr, knocking the pair to 106.04 near NY close.
. Looking at the hourly n daily charts, dlr's early rally abv Jan's 105.45 peak to 106.47 y'day signals the LT uptrend fm record low at 75.32 (Nov 2011') remains in force n marginal gain to 106.61 (being 50% projection of the intermediate rise fm 93.75-105.45 proj. fm 100.76) is likely after minor consolidation, however, as hourly technical indicators' readings have already displayed 'bearish divergences', reckon 107.06 (being 50% projection of 77.13-103.74 measured fm 96.73) wud hold on 1st testing n yield a 'much-needed' minor correction. On the downside, only below last Fri's 104.69 low signals temp. top is in place.
. Today, expect initial consolidation with mild downside bias b4 prospect of marginal rise. So buying on dips is still favoured n only below 105.71 (last Fri's high, now sup) confirms a temporary top is made n may risk a stronger retracement twd 105.23 but pivotal sup at 104.69 is expected to remain intact. .png)
Posted by: acetraderforex Sep 11, 2014, 10:27 AM
AceTraderFx Sept 11: Daily Technical Outlook & Trading Ideals on EUR/USD DAILY EUR/USD TECHNICAL OUTLOOK
Last Update At 11 Sep 2014 00:14GMT
Trend Daily Chart
Down
Daily Indicators
Rising fm o/s
21 HR EMA
1.2919
55 HR EMA
1.2925
Trend Hourly Chart
Sideways
Hourly Indicators
Neutral
13 HR RSI
50
14 HR DMI
-ve
Daily Analysis
Choppy consolidation to continue
Resistance
1.3030 - Hourly chart
1.2990 - Last Fri's high
1.2963 - Y'day's high
Support
1.2883 - Y'day's NY low
1.2860 - Tue's fresh near 14-month low
1.2839 - 1.618 times ext. of 1.3700-1.3333 fm 1.3433
. EUR/USD - 1.2919 ... The single currency briefly penetrated Tue's high at 1.2957 to 1.2963 in European morning, however, renewed selling interest there capped euro's upside n price ratcheted lower to session low of 1.2883 in New York midday b4 paring intra-day losses in NY afternoon.
. As mentioned in previous update, euro's rebound fm a near fresh 14-month low at 1.2860 on Tue to 1.2963 signals a temp. bottom has been made there as the magnitude of this move was the largest in over a month, therefore, several days of consolidation is in store. As long as 1.2990 res (last Fri's high) holds, out look remains bearish for the MT downtrend fm Jul's 2-1/2 year peak at 1.3995 to retrace the entire MT rise fm 2012 bottom at 1.2042 to resume to 1.2839 (1.618 times extension of 1.3700-1.3333 measured fm 1.3433), however, as the hourly oscillators wud display prominent 'bullish convergences' on next fall, previous key daily sup at 1.2745 shud remain intact.
. Today, in view of abv consolidative view on euro, one can trade on both sides of the market n buy on dips for another rebound or sell on next intra-day up move twd 1.2980/90 res for subsequent retreat. 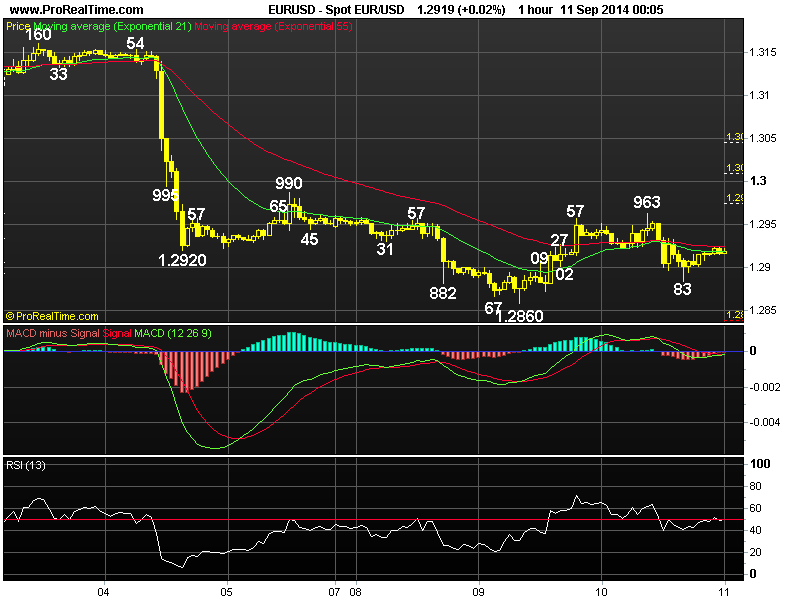
Posted by: acetraderforex Sep 15, 2014, 09:36 AM
AceTraderFx Sept 15: Weekly Technical Outlook & Trading Ideals on USD/JPY WEEKLY USD/JPY TECHNICAL OUTLOOK
Last Update At 14 Sep 2014 23:53GMT
Trend Daily Chart
Up
Daily Indicators
Rising
21 HR EMA
107.25
55 HR EMA
107.04
Trend Hourly Chart
Up
Hourly Indicators
Bearish divergences
13 HR RSI
57
14 HR DMI
+ve
Daily Analysis
Consolidation b4 marginal rise
Resistance
108.04 - Sep 19 2008 high
107.81 - 50% proj. of 106.04-107.40 fm 107.13
107.40 - Last Fri's high
Support
107.09 - Last Fri's European low
106.64 - Last Thur's Asian low
106.04 - Last Wed's low
. USD/JPY - 107.35 ... The pair continued its recent winning streak last week as gain in the Nikkei as well as upbeat U.S. data boosted risk sentiment, dlr gained for 5 consecutive days n rose to a fresh 6-year high of 107.40 Fri.
. Looking at bigger picture 1st, dlr's early rally abv Jan's 105.45 peak to as high as 107.40 Fri suggests the LT uptrend fm record low at 75.32 (Nov 2011) remains in progress n further headway to next daily chart obj. at 108.04 (Sep high in 2008) is now envisaged after minor consolidation, however, as the hourly oscillators' readings wud display 'bearish divergences' on such move, strg gain abv there may not be seen n reckon 108.99, being 2-times extension of MT intermediate rise fm 103.56-105.71 measured fm 104.69, wud cap upside this week n risk has increased for a much-needed correction to take place later. On the downside, a daily close below 106.64 (last Thur's low) wud be the 1st signal temporary top is in place n yield stronger retracement twd 106.04.
. Today, dlr's brief retreat to 107.16 at NZ open (Japan's market is closed) has increased risk of a minor retracement, however, 106.64/65 sup shud hold fm here. Abv 107.40 wud extend to 107.70/80 b4 prospect of a minor correction. 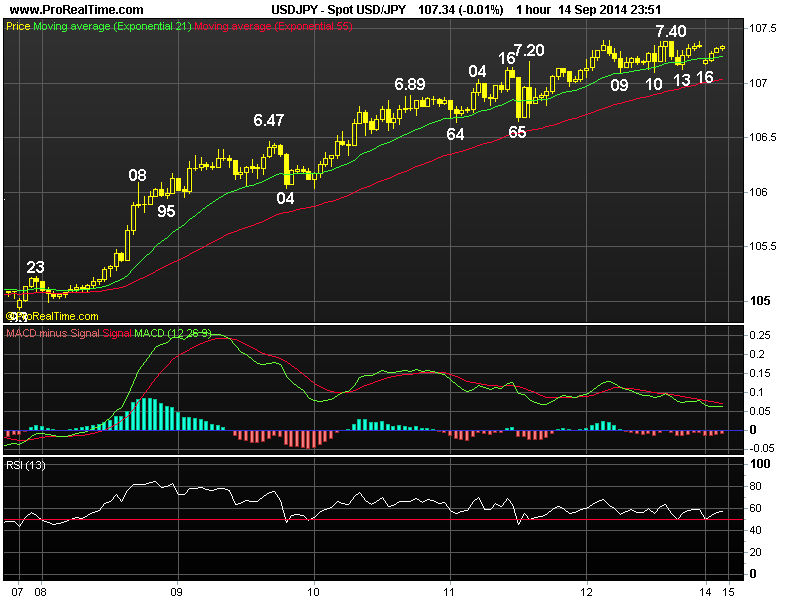
Posted by: acetraderforex Sep 19, 2014, 11:27 AM
AceTraderFx Sept 19: Daily Technical Outlook & Trading Ideals on USD/JPY DAILY USD/JPY TECHNICAL OUTLOOK
Last Update At 18 Sep 2014 23:55GMT
Trend Daily Chart
Up
Daily Indicators
Rising
21 HR EMA
108.63
55 HR EMA
108.18
Trend Hourly Chart
Up
Hourly Indicators
Bearish divergences
13 HR RSI
66
14 HR DMI
+ve
Daily Analysis
Consolidation b4 one more fall
Resistance
110.67 - Aug 15 2008 high
109.52 - 2 times ext. of 101.51-104.49 fm 103.56
109.08 - Sep 08 2008 high
Support
108.50 - Thur's European low
108.14 - 38.2% r of 106.81-108.96
107.88 - 50% of 106.81-108.96
. USD/JPY - 108.82 ... The greenback maintained a firm undertone on Thur following Wed's rally due to broad-based gain in global stocks. Dlr rose to a fresh 6-year peak of 108.96 in New York after weekly U.S. jobless claims came in lower than market forecast, however, offers at 109.00 capped intra-day gain.
. Dlr's firmness after rallying to 108.96 suggests the LT uptrend fm 2011 record low at 75.32 (Nov) wud resume after consolidation n marginal gain abv next daily chart obj. at 109.08 (Sep 08 2008 high) is now envisaged, however,high readings on daily oscillators n 'bearish divergences' on hourly indicators shud prevent strg gain abv there n reckon 109.52, being 2 times extension of MT intermediate rise fm 101.51-104.49 measured fm 103.56, shud cap upside n yield a long-overdue minor correction. Looking ahead, dlr is en route to 2008 peak at 110.67. On the downside, only a daily close below 107.40 wud signal a temporary top is in place n risk stronger retrace. to 106.81 sup.
. In view of abv analysis, buying dlr again on dips in anticipation of further rise is the way to go as only below 108.00 wud confirm a temporary is in place n risks stronger retracement twd 107.40 next week. 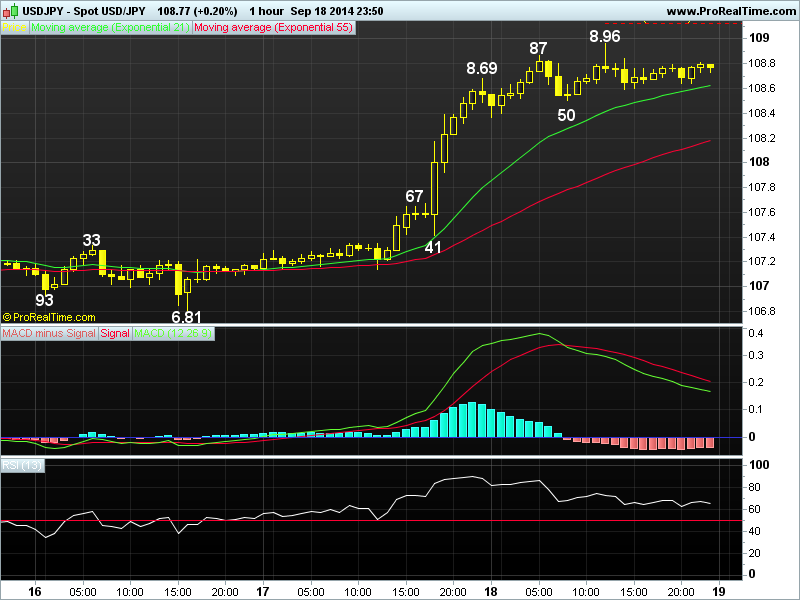
Posted by: acetraderforex Sep 26, 2014, 10:19 AM
AceTraderFx Sept 26: Daily Technical Outlook & Trading Ideals on GBP/USD DAILY GBP/USD TECHNICAL OUTLOOK
Last Update At 26 Sep 2014 00:45GMT
Trend Daily Chart
Down
Daily Indicators
Turning up
21 HR EMA
1.6321
55 HR EMA
1.6336
Trend Hourly Chart
Sideways
Hourly Indicators
Turning up
13 HR RSI
54
14 HR DMI
-ve
Daily Analysis
Consolidation b4 one more fall
Resistance
1.6416 - Tue's high
1.6373 - Wed's European morning low
1.6353 - Tue's NY low
Support
1.6276 - Y'day's low
1.6247 - Last Thur's low (AUS)
1.6262 - Sep 16 low
. GBP/USD - 1.6330 ... The British pound swung wildly y'day. Price briefly penetrated last Fri's low at 1.6284 to 1.6276 in European morning, price staged a failed rally after mildly hawkish comments fm BOE's Carney but quickly reteated to 1.6294 in choppy NY session n later ratcheted higher near NY close.
. Although cable's rebound after y'day's resumption of decline fm last Fri;s 1.6525 to 1.6276, as this move signals at least the 1st leg of correction fm Sep's 9-1/2 month trough at 1.6052, downside bias remains for weakness twd 1.6233, this is the 'dynamic' 61.8% r of aforesaid rise. Below 1.6233 wud yield subsequent weakness twd 1.6175 (equality proj. of 1.6525-1.6284 measured fm 1.6416) but a daily close of 1.6162 sup is needed to signal correction fm 1.6052 is over. On the upside, only a daily close abv 1.6416 wud risk stronger gain to 1.6433 (61.8% r of 1.6525-1.6284) but reckon 1.6481 (last Fri's European high) wud cap upside.
. Today, we're holding a short position in anticipation of further weakness after initial consolidation in Asia but profit shud be taken on subsequent decline. Aabv 1.6373 may risk stronger gain to 1.6413/16 res area. .png)
Posted by: acetraderforex Sep 29, 2014, 10:38 AM
AceTraderFx Sept 29: Weekly Technical Outlook & Trading Ideals on USD/CHF WEEKLY USD/CHF TECHNICAL OUTLOOK
Last Update At 29 Sep 2014 00:12GMT
Trend Daily Chart
Up
Daily Indicators
Rising
21 HR EMA
0.9503
55 HR EMA
0.9479
Trend Hourly Chart
Up
Hourly Indicators
Bearish divergences
13 HR RSI
70
14 HR DMI
+ve
Daily Analysis
Resumption of MT uptrend
Resistance
0.9620 - 100% proj. fo 0.9353-0.9515 fm 0.457
0.9599 - 70.7% r of 0.9972-0.8698
0.9567 - Mar 2013 top
Support
0.9484 - Last Fri's European high (now sup)
0.9457 - Last Thur's NY low
0.9433 - Sep 167 high (now sup)
. USD/CHF - 0.9517... Dlr continued its recent winning streak last week after meeting renewed buying at 0.8353 on Tue, price climbed to a fresh 1-year peak of 0.9522 in Fri's NY session due to broad-based rally in the dlr.
. Looking at the bigger picture 1st, dlr's aforesaid gain to 0.9522 Fri confirms the 3-legged rise fm Mar's 2-1/2 year trough at 0.8698 to at least retracing MT fall fm 0.9972 (2012 peak) remains in progress n gain to 0.9599 is now envisaged, being 70.7% r of this move, however, as hourly indicators have displayed 'bearish divergences', reckon 0.9620 (equality measurement of 0.9353-0.9515 measured fm 0.9457) wud cap upside ahead of Fri's important U.S. payrolls report n yield a minor correction. Therefore, whilst buying on dips is the way to go, profit shud be taken on next upmove. On the downside, a daily close below 0.9457 wud be the 1st signal temporary top is in place n risk stronger retracement to 0.9389 but sup at 0.9332 shud remain intact.
. Today, as current price is trading abv the 21-hr & 55-hr emas, buying dlr on dips is recommended, however, reckon 0.9599 wud cap upside. Below 0.8457 wud abort present bullish scenario n risk retracement to 0.9433, 0.9407/10.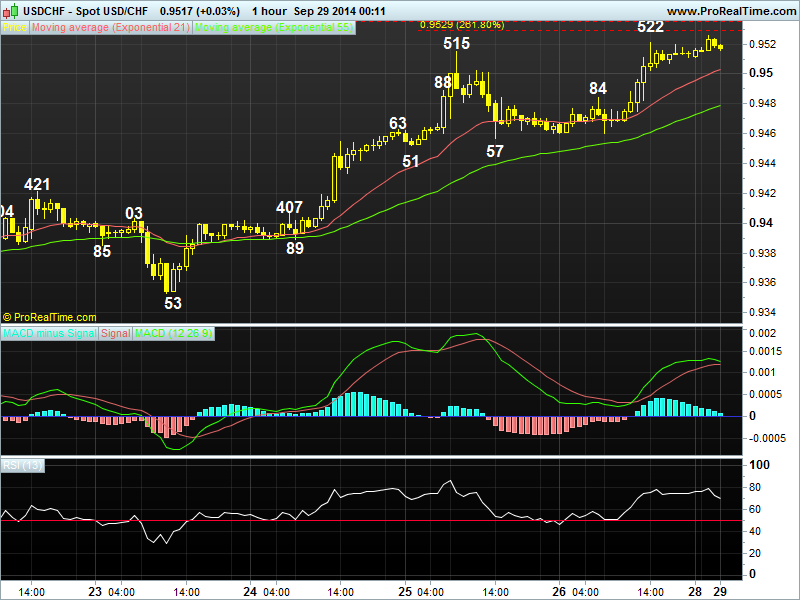
Posted by: acetraderforex Sep 30, 2014, 10:12 AM
AceTraderFx Sept 30: Daily Technical Outlook & Trading Ideals on EUR/USD DAILY EUR/USD TECHNICAL OUTLOOK
Last Update At 29 Sep 2014 23:39GMT
Trend Daily Chart
Down
Daily Indicators
Bullish convergences
21 HR EMA
1.2691
55 HR EMA
1.2709
Trend Hourly Chart
Down
Hourly Indicators
Bullish convergences
13 HR RSI
49
14 HR DMI
-ve
Daily Analysis
Consolidation b4 one more fall
Resistance
1.2801 - Hourly chart
1.2765 - Last Thur's NY high
1.2728 - Last Fri's European morning low
Support
1.2664 - Y'day's low
1.2641 - 61.8% proj. of 1.3433-1.2860 fm 1.2995
1.2600 - 2.236 times ext. of 1.3995-1.3503 fm 1.3700
. EUR/USD - 1.2691... Although Fri's close near the day's low pressured the single currency in Asia on Mon, price briefly weakened to a fresh 22-month trough of 1.2664 just ahead of European open, short-covering lifted the pair to 1.2715 in NY morning b4 coming off to 1.2678 b4 moving sideways in NY afternoon.
. Looking at the hourly & daily charts, although said Mon's low at 1.2664 was accompanied by 'bullish convergences' on the hourly indicators, as long as 1.2725/28 (prev. sup, now res) holds, the MT downtrend fm May's 2-1/2 year peak 1.3995 is en route to next chart obj. at at 1.2661 (Nov 13 2012 low), however, reckon 1.2600 (2.236 times extension of 1.3995-1.3503 measured fm 1.3700) wud hold on 1st testing ahead of Thur's ECB policy meeting n bring a much-needed minor correction. On the upside, a daily close abv 1.2765 wud be the 1st signal temporary low is made n yield stronger gain twd 1.2816, however, res at 1.2901 (last week's high on Tue) shud remain intact. In view of abv bearish analysis on euro, selling euro on recovery is the way to go.
. Today, we're holding a short position for one more fall but profit shud be taken on subsequent decline. 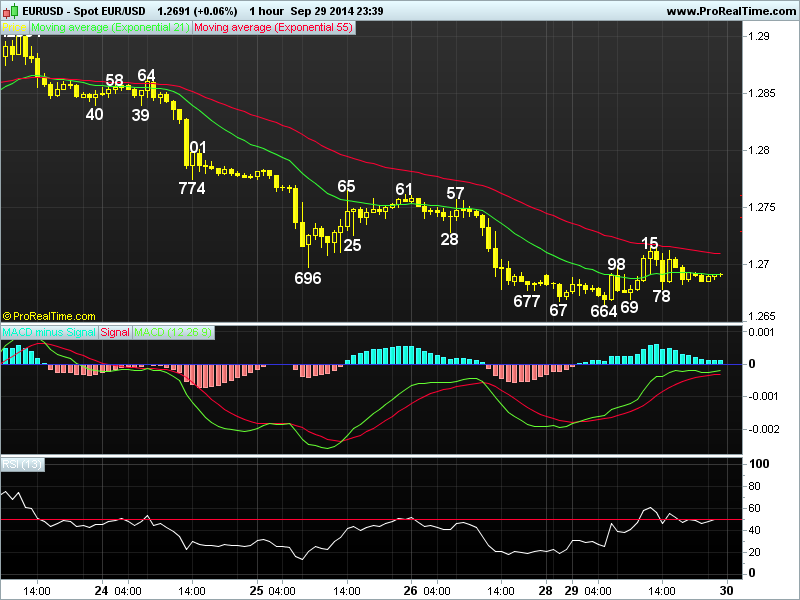
Posted by: acetraderforex Oct 3, 2014, 10:46 AM
AceTraderFx Oct 3: Daily Technical Outlook & Trading Ideals on USD/JPY DAILY USD/JPY TECHNICAL OUTLOOK
Last Update At 03 Oct 2014 00:20GMT
Trend Daily Chart
Up
Daily Indicators
Easing fm o/bot
21 HR EMA
108.58
55 HR EMA
108.91
Trend Hourly Chart
Nr term down
Hourly Indicators
Rising fm o/sold
13 HR RSI
52
14 HR DMI
-ve
Daily Analysis
Consolidation with downside bias
Resistance
109.69 - Prev. sup, now res
109.12 - Y'day's high in Aust.
108.89 - Y'day's NY morning res
Support
108.01 - Y'day's low
107.60 - 1.23 times extn of 110.09-108.87 fm 109.12
107.40 - Sep 12 high, now sup
. USD/JPY - 108.68 ... Dlr found renewed selling at 109.12 in Aust. on Thur n easily penetrated Wed's NY low at 108.87 in Asia due to tumble in N225, price ratcheted lower in Europe n fell to 108.01 in NY midday b4 short-covering lifted price in NY afternoon. Dlr rebounded to 108.73 shortly after Fri's Tokyo open.
. Y'day's breach of 108.26 (Sep 23 low) to 108.01 signals LT uptrend fm 2011 record low at 75.32 (Nov) has indeed made a temporary top at Wed's fresh 6-year peak at 110.09 n although subsequent intra-day rebound indicates initial choppy trading wud be seen in Asia, reckon 109.05, the 'natural' 50% r of 110.09-108.01 , wud cap upside n bearishness remains for another corrective fall to take place later. Having said that, as 'bullish converging signals' wud appear on hourly oscillators on next decline, sharp move below 108.01 is not likely today n price shud hold abv 107.60, this is the 1.23 times extension of 110.09-108.87 measured fm 109.12, n yield strg rebound.
. Today, whilst selling dlr on intra-day recovery is recommended, one may look to buy next decline to 107.85 n take profit on subsequent rebound. On the upside, only abv 109.30 (61.8% r fm 110.09) indicates correction over, 109.69. .png)
Posted by: acetraderforex Oct 9, 2014, 10:58 AM
AceTraderFx Oct 9: Daily Technical Outlook & Trading Ideals on USD/CHF DAILY USD/CHF TECHNICAL OUTLOOK
Last Update At 09 Oct 2014 00:44GMT
Trend Daily Chart
Up
Daily Indicators
Turning down
21 HR EMA
0.9545
55 HR EMA
0.9571
Trend Hourly Chart
Near term down
Hourly Indicators
Falling
13 HR RSI
35
14 HR DMI
-ve
Daily Analysis
Consolidation with downside bias
Resistance
0.9624 - Tue's high
0.9601 - Y'day's high
0.9555 - Tue's low (now res)
Support
0.9504 - Intra-day low
0.9489 - Last Mon's low
0.9433 - Sep 17 high (now sup)
. USD/CHF - 0.9527... Despite y'day's intra-day swings in Asian & European sessions inside a 0.9556-0.9601 range following previous day's decline to 0.9555, the pair tumbled after release of dovish Fed minutes, price fell to 0.9510 due to dlr's broad-based weakness n then hit an intra-day low of 0.9504 in Asia.
. Looking at the hourly n daily charts, y'day's break of 0.9555 suggests further choppy trading below Mon's fresh 1-year peak at 0.9690 wud continue with downside bias n further weakness to 0.9496 is now envisaged, this is the natural 50% r of intermediate rise fm 0.9301 to 0.9690, a daily close below there wud bring stronger correction twd 0.9436 n possibly twd 0.9357, being 38.2% n 50% r respectively of 0.9024-0.8960. In view of abv analysis, selling dlr on recovery in anticipation of further decline is favoured as only abv 0.9601 (y'day's top) wud signal 1st leg of correction is over, however, reckon 0.9630/40 wud cap upside n yield another leg of decline next week.
. Today, we've exited previous short position after intra-day recovery fm 0.9504 (Australia) n wud sell again on minor recovery as 0.9555 (prev. sup, now res) wud cap present rebound n yield decline to 0.9470/75. 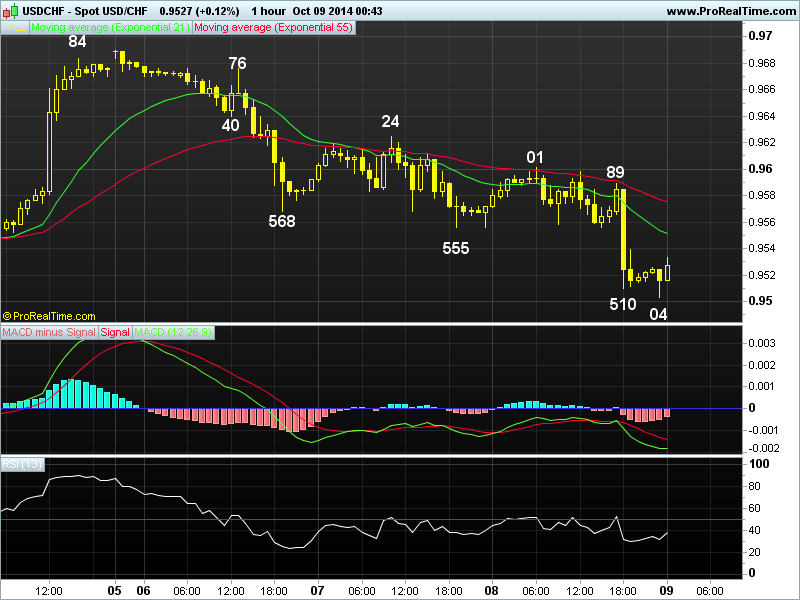
Posted by: acetraderforex Oct 10, 2014, 10:53 AM
AceTraderFx Oct 10: Daily Technical Outlook & Trading Ideals on USD/JPY DAILY USD/JPY TECHNICAL OUTLOOK
Last Update At 09 Oct 2014 23:55GMT
Trend Daily Chart
Up
Daily Indicators
Turning down
21 HR EMA
107.89
55 HR EMA
108.10
Trend Hourly Chart
Down
Hourly Indicators
Bullish convergences
13 HR RSI
46
14 HR DMI
-ve
Daily Analysis
Consolidation b4 one more fall
Resistance
109.23 - Tue's Asian high
108.75 - Wed's NY high
108.32 - Y'day's Asian high
Support
107.53 - Y'day's low
107.40 - 12 Sep high, now sup
106.81 - 16 Sep low
. USD/JPY - 107.84 ... Although dlr came under renewed selling pressure at Tokyo open on Thur n ratcheted lower below previous day's low at 107.76 to a 3-week trough of 107.53 ahead of NY open due to renewed weakness in the Nikkei future, dlr's broad-based rally in NY later lifted price to 108.18.
. Looking at the hourly n daily charts, yesterday's weakness after penetrating Wed's low at 107.76 to 107.53 suggests as long as 108.75 res (Wed's high) holds, decline fm Oct's fresh 6-year peak of 110.09 to retrace MT uptrend wud resume n extend initial weakness to 107.40/39 (Sep 12 high n 50% r of 104.69-110.09 respectively) after consolidation, however, 'bullish converging signals' on hourly oscillators shud prevent steep fall n price shud hold well abv previous daily sup at 106.81 (Sep 16 low) n yield a much-needed rebound early next week.
. In view of abv analysis, selling dlr on intra-day recovery in anticipation of further fall is still favoured n one may turn long on dips twd 107.00 for subsequent rebound. On the upside, only abv 108.75 confirms 1st leg of correction is over n risks stronger gain twd chart obj. at 109.23. 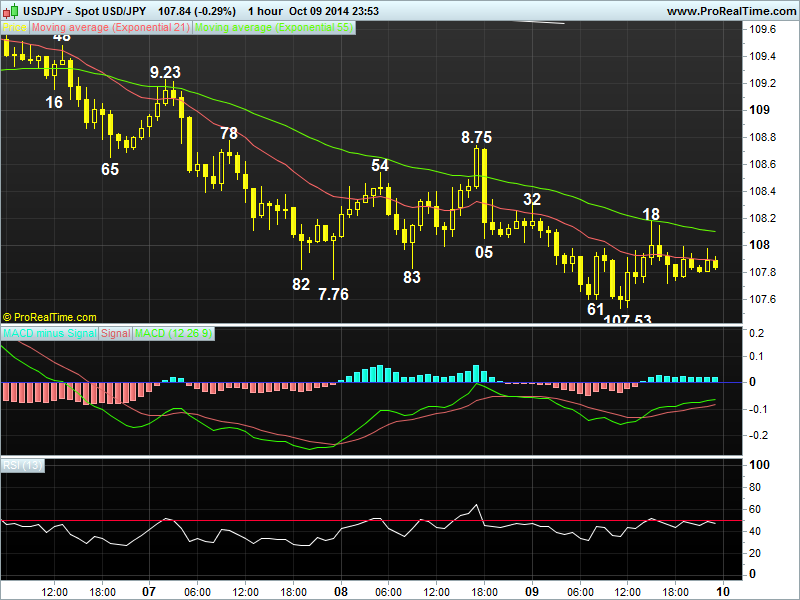
Posted by: acetraderforex Oct 13, 2014, 10:52 AM
AceTraderFx Oct 13: Weekly Technical Outlook & Trading Ideals on GBP/USD WEEKLY GBP/USD TECHNICAL OUTLOOK
Last Update At 13 Oct 2014 00:19GMT
Trend Daily Chart
Down
Daily Indicators
Bullish convergences
21 HR EMA
1.6078
55 HR EMA
1.6155
Trend Hourly Chart
Near term down
Hourly Indicators
Turn up
13 HR RSI
55
14 HR DMI
-ve
Daily Analysis
Consolidation with downside bias
Resistance
1.6151 - Last Thur's Asian low (now res)
1.6136 - Last Fri's high
1.6104 - last Thur's low
Support
1.6009 - Last Fri's low
1.5960 - Last Mon's European low
1.5943 - Last Mon's 11-month low
. GBP/USD - 1.6091 ... Although cable opened lower to an 11-month bottom of 1.5943 in NZ last Mon, price swiftly rallied on broad-based long liquidation in the greenback. The pound continued to ratchet higher to as high as 1.6227 on Thur b4 tumbling partly on cross-selling in sterling to 1.6009 in NY Fri.
. Let's look at the daily picture 1st, despite cable's aforesaid strg bounce fm 1.5943 to 1.6227, subsequent fall to 1.6009 signals correction is possibly over n a daily close below 1.6009 wud add credence to this view, then MT downtrend fm Jul's near 6-year peak wud pressure the pound twd 1.5820, this is 61.8% projection of abovementioned decline fm 1.7192-1.6052 measured fm 1.6525. Having said that, as the daily technical indicators wud display prominent 'bullish convergences' on such move, reckon 1.5718 (Aug 2013 high, now sup) wud contain weakness. On the upside, failure to penetrate 1.5943 low n subsequent rise abv 1.6227 wud confirm a temporary low has been made, then risk wud shift to the upsdie for stronger retracement to 1.642 ('minimum' 38.2% r of 1.7192-1.5943).
. Today, although Fri's rebound in NY afternoon signals decline fm 1.6227
has made a low at 1.6009, reckon 1.6136 wud cap upside n yield another decline. 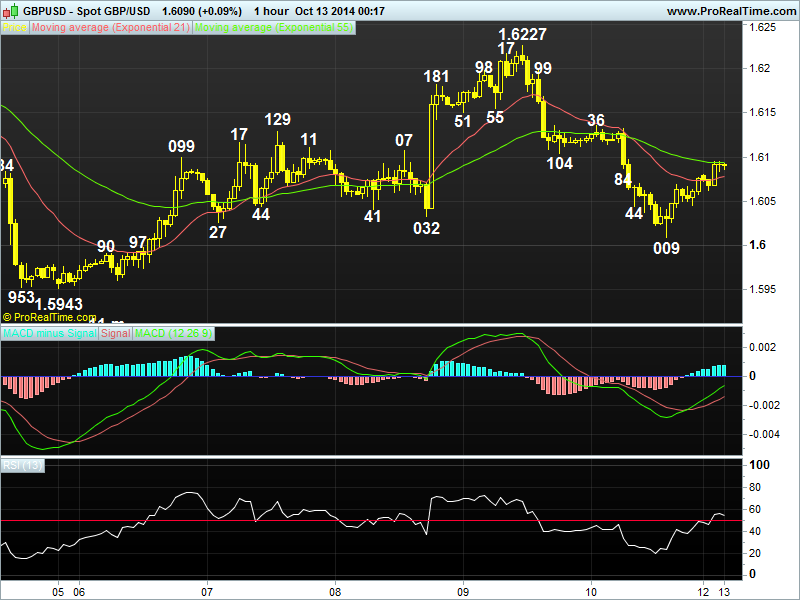
Posted by: acetraderforex Oct 14, 2014, 10:34 AM
AceTraderFx Oct 14: Daily Technical Outlook & Trading Ideals on USD/CHF DAILY USD/CHF TECHNICAL OUTLOOK
Last Update At 14 Oct 2014 00:33GMT
Trend Daily Chart
Up
Daily Indicators
Turning down
21 HR EMA
0.9519
55 HR EMA
0.9534
Trend Hourly Chart
Near term down
Hourly Indicators
Rising fm o/s
13 HR RSI
41
14 HR DMI
-ve
Daily Analysis
Choppy consolidation to continue
Resistance
0.9624 - Last Tue's high
0.9593 - Last Fri's high
0.9552 - Y'day's European high
Support
0.9469 - Intra-day low in Australia
0.9433 - Sep 17 high (now sup)
0.9357 - 50% of 0.9024-0.9690
. USD/CHF - 0.9504... Although dlr came under broad-based selling pressure in NZ y'day n fell sharply to 0.9520 in Asian morning, price staged a recovery to 0.9552 in early European morning. However, price again fell to session low of at 0.9512 in N. American morning b4 tanking briefly but sharply to 0.9469 today.
. Looking at the hourly chart, y'day's strg retreat suggests the recovery fm last Wed's low at 0.9470 has ended at 0.9593 last Fri n consolidation with downside bias wud be seen for a re-test of aforesaid sup, a firm break there wud confirm the corrective decline fm last Mon's fresh 1-year high at 0.9690 has resumed n extend weakness twd 0.9433. Having said that, 'bullish convergences' on the hourly oscillators' readings shud prevent steep fall below said lvl n reckon 0.9357 (50% of 0.9024-0.9690) wud hold this week n yield recovery. On the upside, only abv 0.9624 wud confirm the correction fm 0.9690 has ended n yield re-test of abovementioned lvl.
. Today, despite intra-day brief break of y'day's 0.9512 low to a 2-week trough of 0.9469 in Aust., as price has rebounded at Asian open, abv 0.9539 signals temp. low is amde n yield agin twd 0.9593.
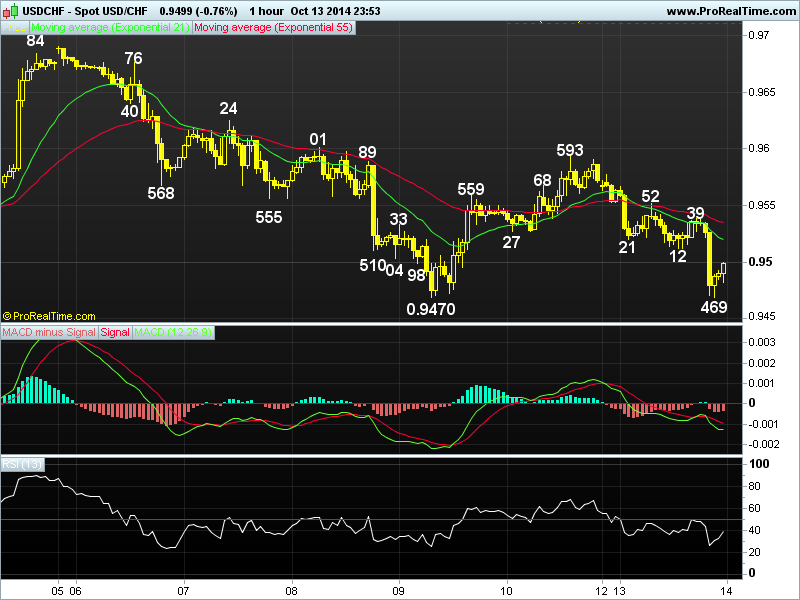
Posted by: acetraderforex Oct 16, 2014, 10:36 AM
AceTraderFx Oct 16: Daily Technical Outlook & Trading Ideals on GBP/USD DAILY GBP/USD TECHNICAL OUTLOOK
Last Update At 16 Oct 2014 01:29GMT
Trend Daily Chart
Sideways
Daily Indicators
Bullish convergences
21 HR EMA
1.5965
55 HR EMA
1.5975
Trend Hourly Chart
Sideways
Hourly Indicators
Rising
13 HR RSI
59
14 HR DMI
+ve
Daily Analysis
Consolidation with upside bias
Resistance
1.6127 - Mon's high
1.6070 - Y'day's high
1.6021 - Hourly chart
Support
1.5940 - Prev. res, now sup
1.5875 - Y'day's fresh 11-month in NY
1.5820 - 61.8% proj. of 1.7192-1.6052 fm 1.6525
. GBP/USD - 1.5998 ... Cable swung wildly on Wed. Despite initial drop to 1.5877 in Asia, short-covering lifted cable n the pair later rallied to as high as 1.6070 due to dlr's broad-based weakness on downbeat U.S. retail sales. Price tumbled to fresh 11-month low at 1.5875 b4 rebounding to 1.6021 at NY close.
. Looking at the hourly n daily charts, y'day's strg rebound fm 1.5875 to 1.6021 suggests MT downtrend fm Jul's near 6-year peak at 1.7192 has possibly formed a temporary low there n few days of choppy consolidation with mild upside bias wud be seen, a breach of 1.6070 (y'day's high in NY morning) anytime wud confirm this view n stronger retracement to 1.6123/27, being min. 38.2% r of intermediate fall of 1.6525-1.5875 n Mon's high respectively, n then 1.6050/60 wud follow, however, hourly oscillators wud be in o/bot territory on such a move n price wud falter below 1.6200 (50% r fm 1.6525) n yield another fall next week.
. In view of abv analysis, buying cable on dips is recommended today n only a daily close below 1.5900 wud confirm aforementioned recovery is over n yield resumption of decline fm 1.7192 to re-test 1.5875, break wud extend to next downside obj. at 1.5820, this is 61.8% proj. of 1.7192-1.6052..png)
Posted by: acetraderforex Oct 20, 2014, 10:52 AM
AceTraderFx Oct 20: Weekly Technical Outlook & Trading Ideals on USD/CHF WEEKLY USD/CHF TECHNICAL OUTLOOK
Last Update At 20 Oct 2014 00:03GMT
Trend Daily Chart
Sideways
Daily Indicators
Turning down
21 HR EMA
0.9455
55 HR EMA
0.9454
Trend Hourly Chart
Sideways
Hourly Indicators
Rising
13 HR RSI
58
14 HR DMI
+ve
Daily Analysis
Consolidation with upside bias
Resistance
0.9563 - Wed's high
0.9525 - 50% r of 0.9690-0.9360
0.9491 - Last Thur's high
Support
0.9405 - Last Thur's low
0.9360 - Last Wed's fresh 3-week low
0.9301 - Sep 16 low
. USD/CHF - 0.9469...The greenback also swung wildly in opposite direction to euro last week. Despite initial weakness to 0.9469 on Mon, price recovered to 0.9563 Wed but only to tank to a near 3-week trough of 0.9360 after downbeat US retail sales, price later bounced back to 0.9491 Thur n moved sideways on Fri.
. Let's look at daily picture 1st, dlr's erratic decline fm Oct's fresh 1-year peak at 0.9670 n then last week's breach of 0.9470 sup to 0.9360 confirms MT rise fm 2014 near 2-1/2 year trough at 0.8698 (Mar) has indeed formed a tempo rary top at 0.9690 n consolidation with downside bias is seen for further weakness to 0.9311, this is a 'minimum' 38.2% r of aforesaid upmove fm 0.8698, a daily close below daily sup at 0.9301 is needed to bring stronger correction twd 0.9194 (50% r). As daily technical are turning down, suggesting consolidation with downside bias is in store this week. On the upside, only a daily clsoe abv0.9563 (last week's high on Wed) wud dampen present bearish bias on dlr.
. Today, dlr's erratic rise fm 0.9360 to 0.9491 signals 1st leg of said correction fm 0.9690 has ended, abv 0.9491 wud add credence to this view n bring stronger gain to 0.9525 (50% r) but res at 0.9563 shud cap upside. 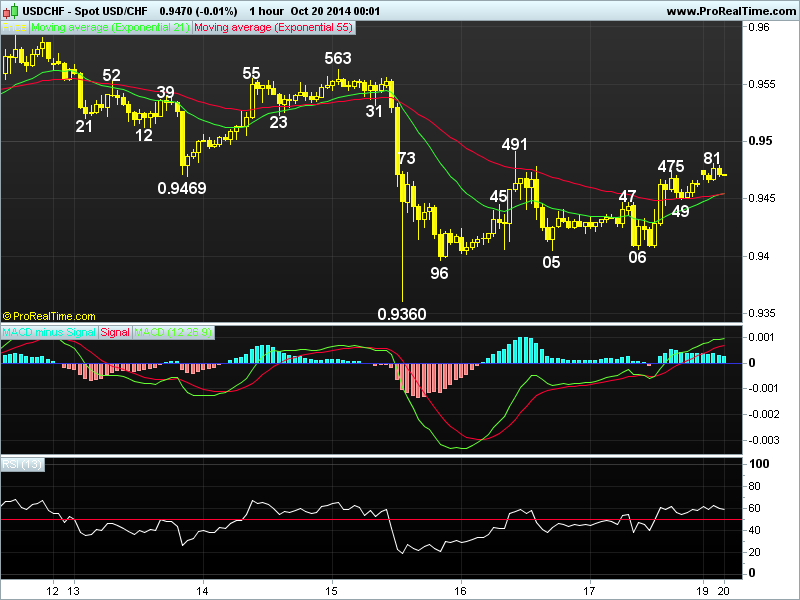
Posted by: acetraderforex Oct 21, 2014, 11:02 AM
AceTraderFx Oct 21: Daily Technical Outlook & Trading Ideals on GBP/USD DAILY GBP/USD TECHNICAL OUTLOOK
Last Update At 21 Oct 2014 00:35GMT
Trend Daily Chart
Sideways
Daily Indicators
Bullish convergences
21 HR EMA
1.6141
55 HR EMA
1.6106
Trend Hourly Chart
Near term up
Hourly Indicators
Rising
13 HR RSI
65
14 HR DMI
+ve
Daily Analysis
Consolidation with upside bias
Resistance
1.6227 - Oct 09 high
1.6200 - 50.0% r of 1.6525-1.5875
1.6179 - Y'day's high
Support
1.6127 - Hourly chart
1.6080 - Y'day's low
1.6030 - Last Fri's low
. GBP/USD - 1.6164 ... Despite y'day's brief retreat to session low at 1.6080 at European open, the British pound pared intra-day loss n rose to 1.6151 at NY open, helped by active cross-buying of sterling vs euro. Price continued to trade with a firm bias n climbed to a high of 1.6179 in NY afternoon.
. Looking at the hourly n daily charts, y'day's rally abv last Fri's high at 1.6126 suggests MT downtrend fm Jul's near 6-year peak at 1.7192 has formed a temporary low at last Wed's fresh 11-month trough at 1.5875 n consolidation with upside bias wud be seen for a stronger retrace. to 1.6200, being the 'natural' 50% r of intermediate fall fm 1.6525. Having said that, as hourly oscillators wud wud display bearish divergences on next rise, reckon res at 1.6227 (Oct 09 high) shud remain intact n bring a much-needed retreat later. On the downside, only below last Fri's low at 1.6030 wud indicate said recovery has ended instead n turn outlook bearish for weakness twds 1.5940.
. Today, in view of abv analysis, we're trading cable on both sides of the market n buy on intra-day retreat for marginal gain twd 1.6200 or sell if price
climbs to there 1st for a much-needed retracement. Below 1.6080, 1.6030/40. 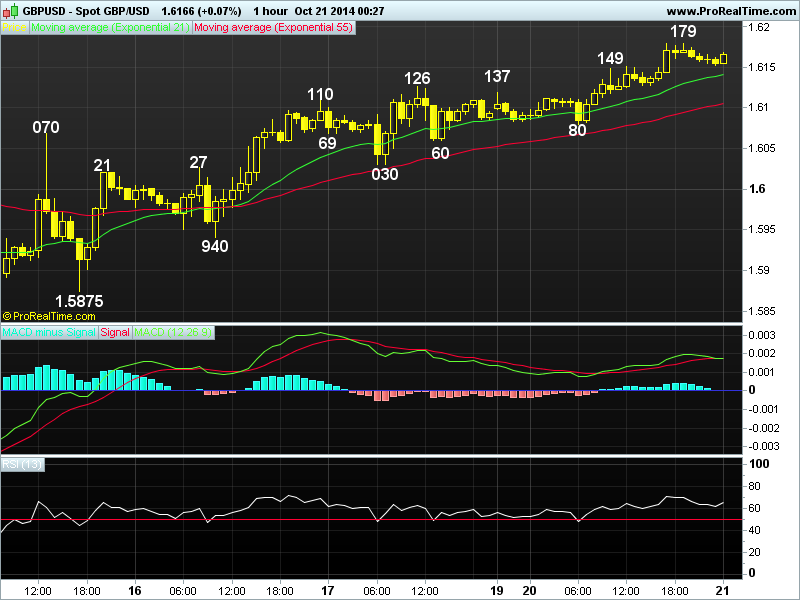
Posted by: acetraderforex Oct 22, 2014, 10:19 AM
AceTraderFx Oct 22: Daily Technical Outlook & Trading Ideals on EUR/USD DAILY EUR/USD TECHNICAL OUTLOOK
Last Update At 22 Oct 2014 00:33GMT
Trend Daily Chart
Sideways
Daily Indicators
Turning up
21 HR EMA
1.2741
55 HR EMA
1.2761
Trend Hourly Chart
Near term down
Hourly Indicators
Falling
13 HR RSI
32
14 HR DMI
-ve
Daily Analysis
Consolidation with downside bias
Resistance
1.2888 - Last Wed's 3-week high
1.2840 - Y'day's high n last Thur's NY high
1.2784 - Y'day's hourly res
Support
1.2706 - Last Thur's low
1.2669 - Last Tue's European morning high
1.2625 - Last Wed's low
. EUR/USD - 1.2715... Despite euro's initial brief rise to 1.2840 in Europe on Tue, the single currency n then tumbled after Reuters reported the ECB was planning on corporate bond purchase as early as Dec. The pair weakened to as low as 1.2715 near NY close n then marginally lower to 1.2706 in Australia today.
. Although last week's rally to 1.2888 (Wed) signals the MT downtrend fm 2014 2-1/2 year peak at 1.3995 (May) has formed a temporary bottom at Oct's 2-year low at 1.2500, y'day's selloff suggests 1st leg of said corrective upmove has ended there n as long as hourly chart res at 1.2784 holds, consolidation with downside bias remains, a firm breach of 1.2706 sup (reaction low fm last Wed's 1.2888 high) wud add credence to the abv view n bring further weakness twd 'dynamic' sup at 1.2648 (this is 61.8% r of 1.2500-1.2888) but reckon pivotal sup at 1.2605 wud remain intact. On the upside, only a rise abv 1.2888 res wud bring a stronger correction to 1.2958, this a 'minimum' 38.2% r of MT intermediate fall fm 1.3700 (Jul high).
. Today, we're holding a short position in anticipation of further weakness n wud take profit on next decline as 1.2648 shud remain intact. 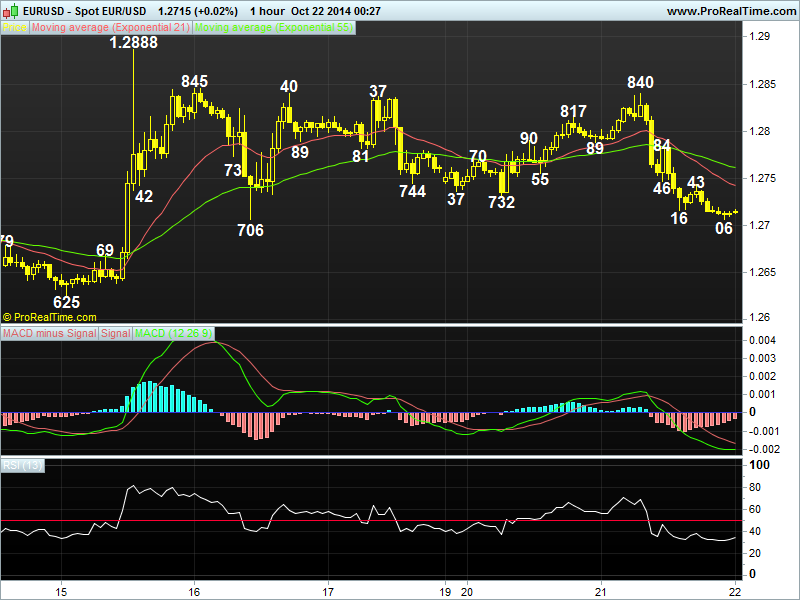
Posted by: acetraderforex Oct 27, 2014, 10:30 AM
AceTraderFx Oct 27: Weekly Technical Outlook & Trading Ideals on GBP/USD WEEKLY GBP/USD TECHNICAL OUTLOOK
Last Update At 27 Oct 2014 00:11GMT
Trend Daily Chart
Sideways
Daily Indicators
Bullish convergences
21 HR EMA
1.6073
55 HR EMA
1.6064
Trend Hourly Chart
Near term up
Hourly Indicators
Rising
13 HR RSI
59
14 HR DMI
+ve
Daily Analysis
Consolidation with upside bias
Resistance
1.6186 - Last Tue's high
1.6131 - Wed's high
1.6104 - Mon's high (Aust.)
Support
1.6017 - Last Fri's low
1.5995 - Y'day's low
1.5966 - 70.7% r of 1.5875-1.6186
. GBP/USD - 1.6089 ... Although the pound extended previous week's up move fm Oct's 11-month trough at 1.5875 to 1.6186 last Tue, release of 'dovish' BoE minutes sent cable tanking to 1.6012, then 1.5995 Thur. Price managed to stage a short-covering rebound to 1.6099 due to usd's weakness in in NY morning on Fri.
. Let's look at the bigger picture 1st, cable's aforesaid rebound fm 1.5875 to 1.6186 signals MT downtrend fm Jul's near 6-year peak at 1.7192 has made a temporary low at 1.5875 n subsequent retreat fm 1.6186 suggests consolidation with downside bias is envisaged this week, a daily close below 1.5995 wud signal correction is over, then weakness twd 1.5875 wud be seen, however, as both the hourly & daily indicators wud display 'bullish convergences' on next decline, reckon projected sup at 1.5820, being 61.8% proj. of MT fall fm 1.7192-1.6052 measured fm 1.6525, wud contain weakness. On the upside, abv 1.6186 (reaction high fm 1.5875) wud confirm MT decline fm 1.7192 has indeed made a temporary low, the gain to 1.6379 wud be seen, this is 38.2% r fm 1.7192.
. Today, w/end's hawkish comments by BoE's McCafferty sent cable briefly to 1.6104, n gain to 1.6140 may be seen but 1.6186 shud hold n yield retreat. 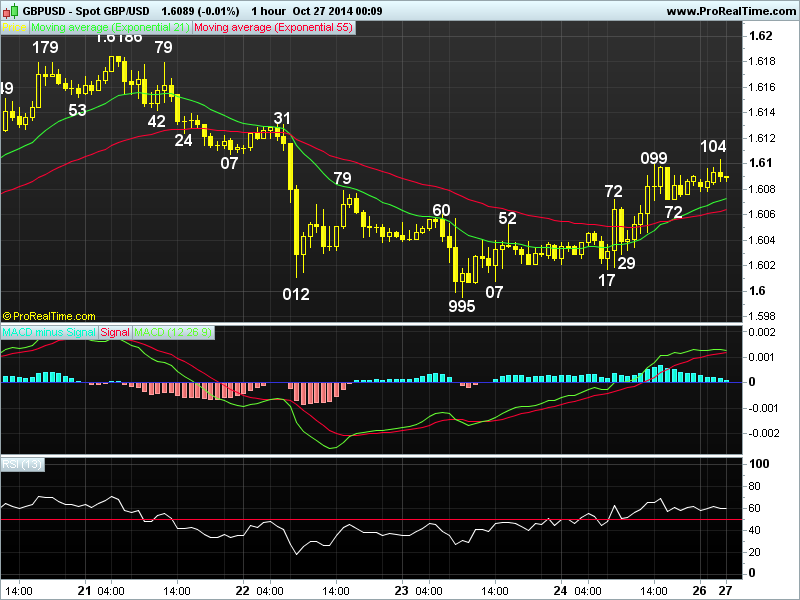
Posted by: acetraderforex Oct 29, 2014, 11:18 AM
AceTraderFx Oct 29: Daily Technical Outlook & Trading Ideals on USD/CHF DAILY USD/CHF TECHNICAL OUTLOOK
Last Update At 29 Oct 2014 00:17GMT
Trend Daily Chart
Sideways
Daily Indicators
Neutral
21 HR EMA
0.9477
55 HR EMA
0.9490
Trend Hourly Chart
Near term down
Hourly Indicators
Rising fm o/s
13 HR RSI
38
14 HR DMI
-ve
Daily Analysis
Consolidation with a neutral bias
Resistance
0.9593 - Oct 10 high
0.9559 - Last Wed's high
0.9521 - Y'day's high
Support
0.9446 - Y'day's low
0.9398 - Last Tue's low
0.9360 - Oct 15 low
. USD/CHF - 0.9468... Dlr went through a roller-coaster session on Tue as despite initial rise to rebound to 0.9511 in European morning, price tumbled to session low of 0.9446 in NY morning after weak U.S. durable goods data. Dlr briefly bounced to 0.9481 on upbeat U.S. consumer confidence b4 stabilising.
. Looking at the hourly n daily charts, y'day's weakness to 0.9446 suggests the recovery fm Oct's low at 0.9360 has possibly ended at 0.9559 last Wed n choppy trading with mild downside bias wud be seen for marginal fall. On the bigger picture, as dlr's rally fm 0.9360 to 0.9559 suggests the 1st leg of correction fm Oct's 1-year peak at 0.9690 has ended there, reckon sup 0.9436, being the 'dynamic' 61.8% r shud remain intact n yield another rebound later. Abv 0.9521 wud indicate the pullback fm 0.9559 has ended n retain bullishness for a retest of said res, break, wud extend marginally but daily res at 0.9693 shud hold this week.
. Today, we are holding a long position entered y'day for recovery to 0.9225 n only below 0.9436 wud abort intra-day bullishness n risk further weakness to 0.9398, break wud confirm recovery fm 0.9360 has ended, 0.9360 later. 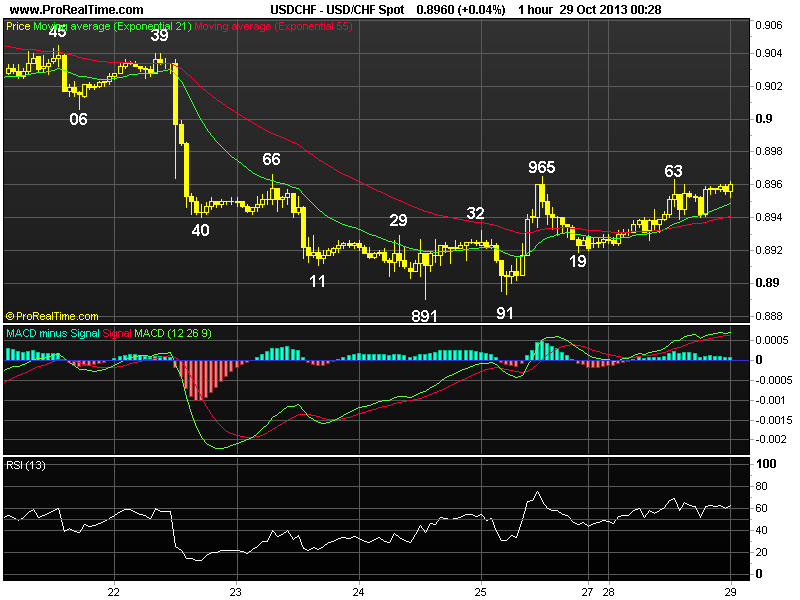
Posted by: acetraderforex Oct 30, 2014, 10:15 AM
AceTraderFx Oct 30: Daily Technical Outlook & Trading Ideals on USD/JPY DAILY USD/JPY TECHNICAL OUTLOOK
Last Update At 30 Oct 2014 00:04GMT
Trend Daily Chart
Sideways
Daily Indicators
Neutral
21 HR EMA
108.46
55 HR EMA
108.21
Trend Hourly Chart
Up
Hourly Indicators
Easing fm o/bot
13 HR RSI
79
14 HR DMI
+ve
Daily Analysis
Resumption of recent up move
Resistance
109.91 - Oct's 4
109.23 - Oct's 7 high
108.96 - Y'day's high
Support
108.37 - Mon's high
107.95 - Y'day's low
107.61 - Mon's low
. USD/JPY - 108.86 ... Despite dlr's brief retreat to 107.95 in Europe on Wed, the greenback jumped after FOMC rate decision n ended its 6-year long QE program. The pair rallied to as high as 108.96 on dlr's broad-based strength.
. Looking at the hourly n daily charts, y'day's resumption of upmove fm Oct's low at 105.20 confirms early corrective fall fm Oct's 6-year peak at 110.09 has ended there n as hourly indicators are rising n current price is trading well abv 21-hr n 55-hr emas, suggesting consolidation with upside bias remains for further gain to 109.23 n then twds 109.48 res, however, hourly oscillators' readings wud be in o/bot territory, this shud prevent strg gain today n res area at 109.91-110.09 shud hold on 1st testing n yield a much-needed retreat later. Looking ahead, a daily close abv 110.09 res wud confirm the LT uptrend fm record low at 75.32 (Oct 2011) has once again resumed n yield further gain to 110.50 (being 61.8% proj. of 101.51-110.09 measured fm 105.20).
. Today, buying dlr again on dips is still the way to go. On the downside, only a breach of y'day's low at 107.95 wud signal a temporary top is made n risk stronger pullback to 107.61 sup..png)
Posted by: acetraderforex Oct 31, 2014, 09:15 AM
AceTraderFx Oct 31: Daily Technical Outlook & Trading Ideals on GBP/USD DAILY GBP/USD TECHNICAL OUTLOOK
Last Update At 31 Oct 2014 00:40GMT
Trend Daily Chart
Sideways
Daily Indicators
Bullish convergences
21 HR EMA
1.6006
55 HR EMA
1.6039
Trend Hourly Chart
Dow
Hourly Indicators
Bullish convergences
13 HR RSI
43
14 HR DMI
-ve
Daily Analysis
Consolidatin b4 one more fall
Resistance
1.6103 - Y'day's NY morning low
1.6089 - Tue's low
1.6038 - Y'day's high
Support
1.5950 - Y'day's low
1.5875 - Oct 15 low
1.5820 - 61.8% proj. of 1.7192-1.6052 fm 1.6525
. GBP/USD - 1.5993..Cable weakened to 1.5967 in Asia on Thur n then 1.5762 in Europe on Thur following Wed's FOMC selloff. Despite a minor bounce to .6009, price later briefly tumbled to session lows of 1.5950 after release of robust U.S. GDP but short-covering lifted price to 1.6038 b4 easing.
. Let's look at the bigger picture 1st, Wed's sharp sell off to 1.6003 n then 1.5950 Thur suggests the correction fm Oct's 11-month low at 1.5875 has ended earlier at 1.6186 last Tue n consolidation with downside bias remains for weakness to 1.5940/50 sup area (Oct 16 n y'day's low respectively), a daily close below there wud signal MT downtrend fm Jul's near 6-year peak at 1.7192 has once again resumed n yield re-test of Oct's 11-month low at 1.5875 next week. Looking ahead, below 1.5875 wud send cable lower to 1.5820, this is 50% proj. of the entire fall fm 1.7192-1.6052 measured fm 1.6525. Therefore, selling cable on recovery is the way to go n only abv 1.6088/89 (prev. sup, now res) wud dampen present bearish scenario on cable.
. Today, we're holding a short position in anticipation of marginal fall but 'bullish convergences' on hourly indicators wud keep cable abv 1.5900/10. 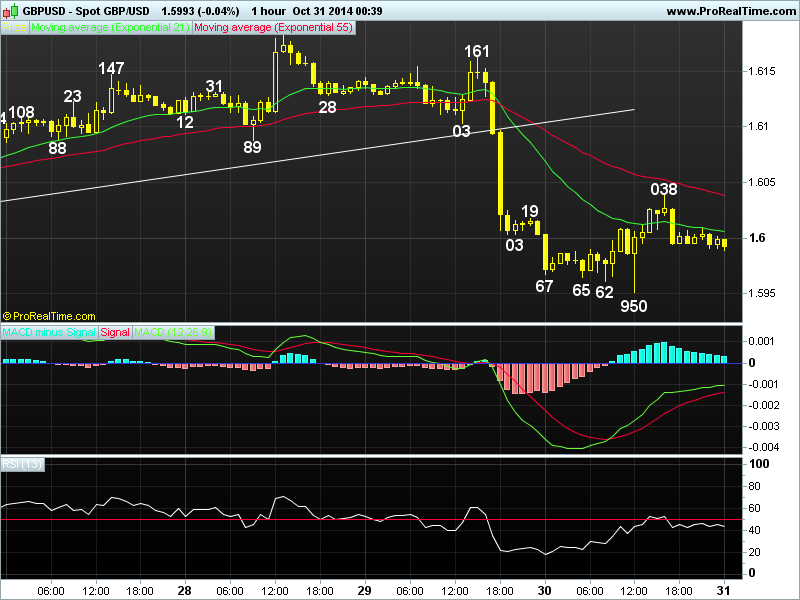
Posted by: acetraderforex Nov 3, 2014, 09:00 AM
AceTraderFx Nov 3: Weekly Technical Outlook & Trading Ideals on USD/JPY WEEKLY USD/JPY TECHNICAL OUTLOOK
Last Update At 02 Nov 2014 23:51GMT
Trend Daily Chart
Up
Daily Indicators
Bearish divergences
21 HR EMA
111.85
55 HR EMA
110.55
Trend Hourly Chart
Up
Hourly Indicators
O/bot
13 HR RSI
80
14 HR DMI
+ve
Daily Analysis
Resumption of uptrend
Resistance
113.54 - 50% proj. of 109.13-112.47 fm 111.89
113.16 - 2.618 times ext. of 106.25-108.37 fm 107.61
113.01 - Intra-day fresh high in NZ/AUS
Support
112.47 - Fri's high, now sup
111.89 - Reaction low fm 112.47
111.46 - Minor sup fm hourly chart
. USD/JPY - 112.87... The greenback maintained a steady tone initially last week as steady gains in the Nikkei boosted risk sentiment of yen selling. Dlr jumped on Fri when BoJ surprised the market with its aggressive stimulus measures, price jumped abv Oct's 110.09 high to a near 7-year peak of 112.47 in NY.
. Let's look at the bigger picture 1st, Fri's rally to 112.47 confirms the LT uptrend fm 2011 record low at 75.32 has once again resumed n price is en route to 114.92, this is 50% proj. of intermediate rise of 77.13-105.45 measured fm 100.76, however, as daily technical indicators have displayed 'bearish divergences' reckon 115.83, being 50% proj. of the entire said uptrend fm 75.32-105.45 measured fm 100.76, wud cap upside n yield correction later. Therefore, buying dlr on dips is recommended but profit shud be taken on subsequent rise. On the downside, below 110.09 (previous res, now sup) anytime wud signal temporary is in place n risk stronger retracement to 108.80/90.
. Today, dlr gapped higher to a fresh near 7-year peak of 113.01 in NZ/AUS , however, as hourly indicators' readings are in o/bot territory, reckon 113.54 wud cap upside. Look to buy on dips as sup at 11.89 shud hold fm here.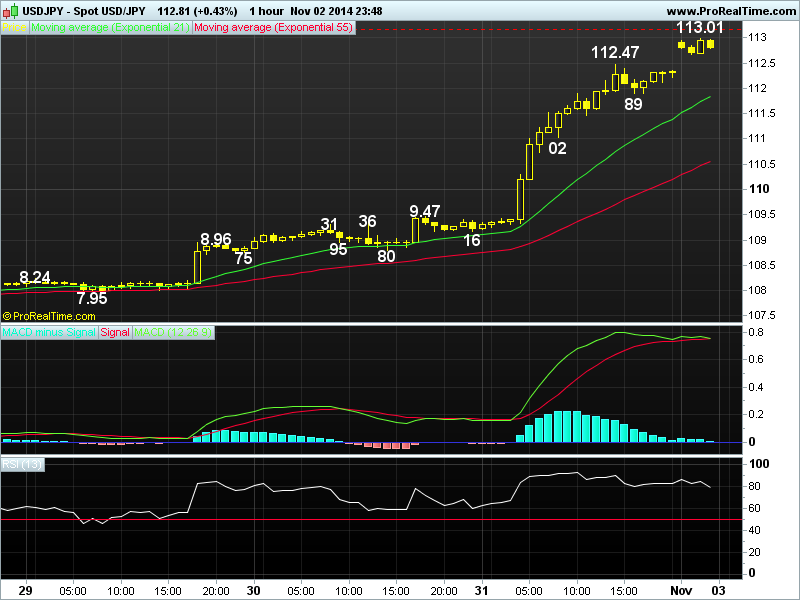
Posted by: acetraderforex Nov 4, 2014, 09:30 AM
AceTraderFx Nov 4: Daily Technical Outlook & Trading Ideals on USD/CHF DAILY USD/CHF TECHNICAL OUTLOOK
Last Update At 04 Nov 2014 01:10GMT
Trend Daily Chart
Up
Daily Indicators
Neutral
21 HR EMA
0.9648
55 HR EMA
0.9625
Trend Hourly Chart
Up
Hourly Indicators
Turning down
13 HR RSI
50
14 HR DMI
+ve
Daily Analysis
Consolidation b4 marginal rise
Resistance
0.9800 - Psychological lvl
0.9745 - 2.618 times ext. of 0.8698-0.9037 fm 0.8857
0.9692 - Y'day's fresh 1-year peak
Support
0.9612 - Fri's NY low
0.9581 - Fri's European low
0.9544 - Last Thur's NY low
. USD/CHF - 0.9645... Although the greenback opened higher in NZ on Mon due to dlr's broad-based strength n rose briefly to a fresh 1-year peak at 0.9692 at Asian open, price pared its gains n retreated to session low at 0.9635 in NY morning on poor U.S. mfg PMI b4 moving sideways in NY afternoon.
. Looking at the hourly n daily charts, y'day's breach of Oct's 1-year peak at 0.9690 signals the 3-legged upmove fm Mar's 2-1/2 year trough at 0.8698 has once again resumed n consolidation with upside bias wud be seen for gain twds 0.9722, being the 61.8% projection of 0.9104-0.9690 measured fm 0.9360.
Having said that, sharp move beyond there is unlikely to be seen due to loss of momentum n reckon res 0.9745/49 (2.618 times extension of 0.8698-0.9037 fm 0.8857 n equality of 0.9301-0.9690 measured fm 0.9360 respectively) shud remain intact n yield a much-needed correction later this week. On the downside, below sup 0.9581 (Fri's NY low) wud indicate a temp. top has been made n stronger retracement twds 0.9544 wud follow.
. Today, we are looking to trade fm both sides of the market n will buy dlr on dips to 0.9615 or wud sell if price climbs marginally to 0.9710 1st. .png)
Posted by: acetraderforex Nov 5, 2014, 09:51 AM
AceTraderFx Nov 5: Daily Technical Outlook & Trading Ideals on GBP/USD DAILY GBP/USD TECHNICAL OUTLOOK
Last Update At 05 Nov 2014 03:06GMT
Trend Daily Chart
Sideways
Daily Indicators
Bullish convergences
21 HR EMA
1.5998
55 HR EMA
1.5999
Trend Hourly Chart
Sideways
Hourly Indicators
Neutral
13 HR RSI
54
14 HR DMI
+ve
Daily Analysis
Consolidation with downside bias
Resistance
1.6103 - Hourly sup (now res)
1.6055 - 50% r of 1.6183-1.5926
1.6038 - Last Thur's high
Support
1.5963 - Reaction low fm 1.6027 (Mon)
1.5926 - Mon's low
1.5875 - Oct 15 low
. GBP/USD - 1.6001...The British pound found renewed buying at 1.5965 at Asian open Tue n continued to trade with a firm undertone in Asia. Price gained to 1.6008 in early European morning b4 retreating to 1.5978. Later, cable rose to session high of 1.6016 at NY open b4 retreating on cross-selling vs euro.
. Looking at the daily picture, although price has staged a recovery after Mon's sharp retreat to 1.5926 n further choppy consolidation is envisaged for 1-2 days, as aforesaid move signals early correction fm 2014 trough at 1.5875 has indeed ended earlier at 1.6186 in Oct, reckon last Thur's high at 1.6038 wud cap upside n bring another fall twd said sup. Below ther wud signal the MT downtrend fm Jul's near 6-year peak at 1.7192 has possibly resumed n yield a re-test of 1.5875 later next week. On the upside, only abv 1.6055 (50% r of 1.6183-1.5926) wud indicate the pullback fm 1.6186 has ended instead n risk stronger gain twd 1.6103 (prev. sup, now res).
. Today, we are looking to sell cable on recovery to 1.6020 for weakness twd 1.5935 n only abv res 1.6038 wud prolong choppy trading n risk marginal gain but res at 1.6055 shud remain intact today n yield retreat. 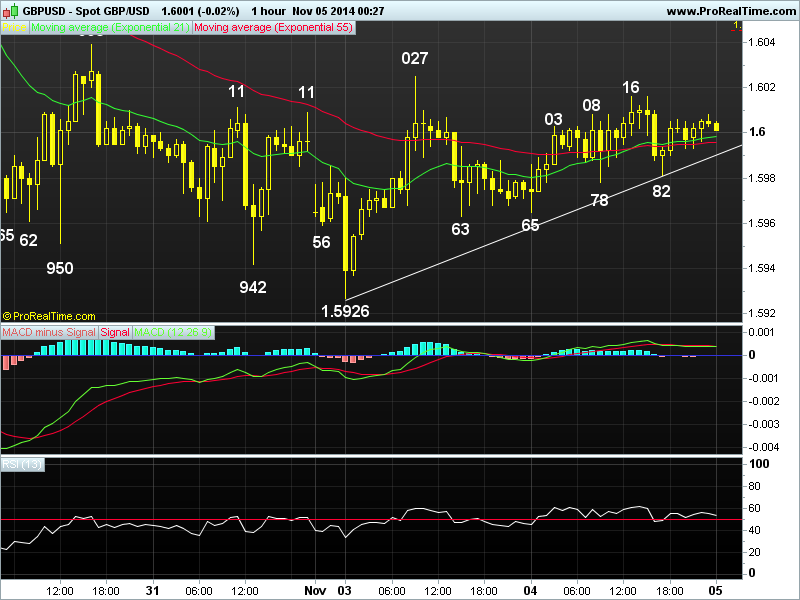
Posted by: acetraderforex Nov 10, 2014, 10:36 AM
AceTraderFx Nov 10: Weekly Technical Outlook & Trading Ideals on EUR/USD WEEKLY EUR/USD TECHNICAL OUTLOOK
Last Update At 09 Nov 2014 23:57GMT
Trend Daily Chart
Down
Daily Indicators
Bullish convergences
21 HR EMA
1.2432
55 HR EMA
1.2441
Trend Hourly Chart
Sideways
Hourly Indicators
Rising
13 HR RSI
62
14 HR DMI
+ve
Daily Analysis
Initial rise b4 retreat
Resistance
1.2577 - Last Tue's high
1.2533 - Last Thur's high
1.2495 - Last Thur's European morning low
Support
1.2408 - Lst Fri's Euroepan morning high
1.2357 - Last Fri's 26-month low
1.2311 - 61.8% proj. of 1.3433-1.2500 fm 1.2888
. EUR/USD - 1.2460 ... The single currency continued its recent downtrend n hit a 2-year low at 1.2439 at the start of last week, despite staging a short-covering rebound to 1.2577 Tue, renewed selling emerged n knocked price to 1.2374 after ECB Draghi's dovish comments Thur, then 1.2357 on Fri b4 rebounding.
. Looking at bigger picture 1st, despite euro's resumption of the MT fall fm May's 2-1/2 year peak at 1.3995 to a fresh 2-year bottom at 1.2357,as aforesaid low was also accompanied by prominent bullish convergences on the hourly & daily oscillators n subsequent bounce to 1.2470 had pushed the hourly macd abv the zero line, suggesting consolidation with initial upside bias wud be seen. However, a daily close abv 1.2577 is needed to 'violate' recent series of lower highs n lower lows n yield stronger retracement twd next upside obj. at 1.2771 later this month. On the downside, below 1.2357 wud yield weakness to 1.2311 (61.8% proj. of 1.3433-1.2500 measured fm 1.2888) but 1.2146 shud hold fm here.
. Today, euro's gain to 1.2487 in NZ suggests 1-2 days of choppy sideways trading is in store, in view of abv analysis, one can trade the pair on both sides of the market as only below 1.2378 wud bring re-test of 1.2357. 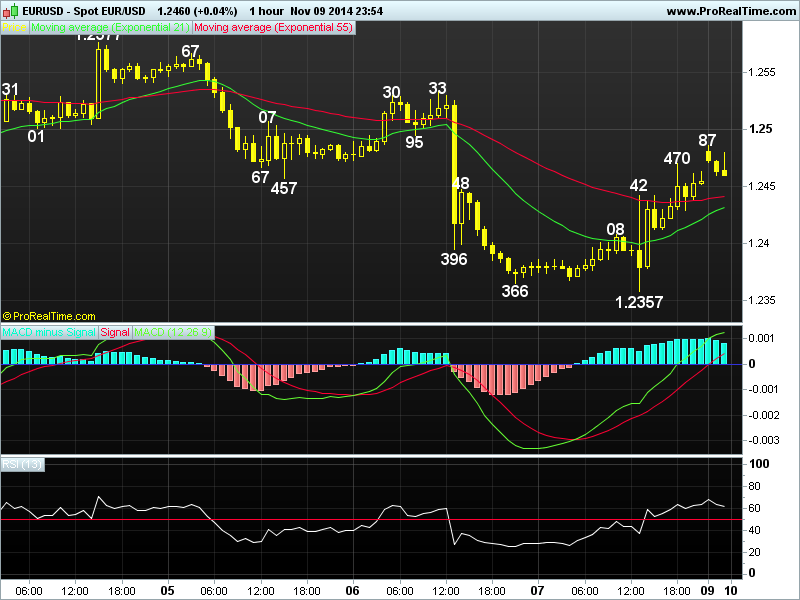
Posted by: acetraderforex Nov 11, 2014, 10:53 AM
AceTraderFx Nov 11: Daily Technical Outlook & Trading Ideals on USD/CHF DAILY USD/CHF TECHNICAL OUTLOOK
Last Update At 11 Nov 2014 00:34GMT
Trend Daily Chart
Up
Daily Indicators
Bearish divergences
21 HR EMA
0.9668
55 HR EMA
0.967
Trend Hourly Chart
Sideways
Hourly Indicators
Rising
13 HR RSI
60
14 HR DMI
+ve
Daily Analysis
Consolidation with upside bias
Resistance
0.9772 - 61.8% proj. of 0.9024-0.9690 fm 0.9360
0.9742 - Last Fri's fresh 1-year peak
0.9705 - Last Fri's Euroepan morning low
Support
0.9617 - Y'day's low
0.960 - Last Thur's low
0.9580 - Last week's low (Tue)
. USD/CHF - 0.9680... Although the greenback opened lower to 0.9632 in NZ on Mon, price staged a recovery to 0.9659 at Asian open, renewed selling there knocked price to session low at 0.9617 in European morning. However, the pair rebounded strongly to 0.9684 in NY session due to broad-based strength in usd.
. Let's look at the hourly n daily charts, y'day's rebound fm 0.9617 suggests the pullback fm last Fri's fresh 1-year peak at 0.9742 has ended there n consolidation with initial upside bias remains, abv 0.9705/10 wud signal pull back is over n bring gain twd 0.9742, break there wud extend the 3-legged up move fm Mar's 2-1/2 year trough at 0.8698 twd projected target at 0.9772 (being 61.8% projection of 0.9024-0.9690 fm 0.9360). However, as hourly indicators wud display 'prominent' bearish divergences on such move, strg rise abv there is not envisaged n recon 0.9800/10 wud hold fm here n bring correction.
. Today, in view of abv analysis, we're standing aside initially n wud buy dlr on dips once 0.9705/10 res is penetrated. On the downside, we will sell dlr on recovery is price drops back below 0.9632 n such move wud indicate rebound is over, the weakness to 0.8580 wud follow, break 0.9455/60.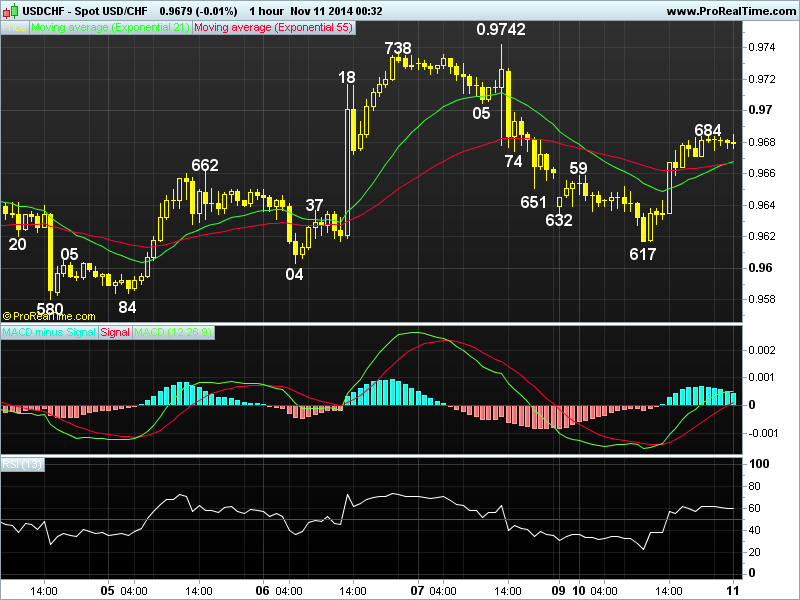
Posted by: acetraderforex Nov 13, 2014, 10:55 AM
AceTraderFx Nov 13: Daily Technical Outlook & Trading Ideals on USD/JPY DAILY USD/JPY TECHNICAL OUTLOOK
Last Update At 13 Nov 2014 00:29GMT
Trend Daily Chart
Up
Daily Indicators
Rising
21 HR EMA
115.47
55 HR EMA
115.33
Trend Hourly Chart
Sideways
Hourly Indicators
Neutral
13 HR RSI
51
14 HR DMI
-ve
Daily Analysis
Consolidation with upside bias
Resistance
117.09 - Equality proj. of 113.86-116.10 fm 114.85
116.42 - 61.8% proj. of 113.86-116.10 fm 114.85
116.10 - Tue's fresh 7-year high
Support
114.85 - Y'day's low
114.64 - Y'day's low
114.26 - Last Fri's low
. USD/JPY - 115.28 ...The greenback continued to take centre stage in Asia n swung wildly in Wed's session. Despite extending rebound fm Tue's 115.04 low to as high as 116.01 in Aust., price briefly dropped to 115.25 b4 bouncing back to 115.88 but only to ratchet lower to 114.85 in NY. Price later rose to 115.74.
. Looking at the hourly n daily charts, despite dlr's erratic fall fm Tue's fresh 7-year peak at 116.10 to 114.85 y'day, subsequent strg bounce in later NY trade suggests choppy consolidation with upside bias remains, however, abv 116.10 needed to extend the LT uptrend fm 2011 record low at 75.32 twd 116.42, this is 61.8% proj. of the near term rise 113.86-116.10 measured fm 115.04. Having said that, as hourly indicators' readings wud display prominent 'bearish divergences' on such move, upside shud falter well below 117.00 n risk has increased for a much-needed correction to occur. Failure to penetrate 115.88 (y'day's high in Tokyo) n a drop below 115.00/04 suggests choppy trading below 116.10 top wud continue, then stronger retracement to 114.64, n later 114.26 wud be seen.
. Today, in view of nr term upside risk, we have exited previous short position with a small loss n may sell dlr on recovery if price drops below 115.00. .png)
Posted by: acetraderforex Nov 14, 2014, 09:44 AM
AceTraderFx Nov 14: Daily Technical Outlook & Trading Ideals on EUR/USD DAILY EUR/USD TECHNICAL OUTLOOK
Last Update At 14 Nov 2014 00:07GMT
Trend Daily Chart
Down
Daily Indicators
Bullish convergences
21 HR EMA
1.2468
55 HR EMA
1.2459
Trend Hourly Chart
Sideways
Hourly Indicators
Neutral
13 HR RSI
57
14 HR DMI
+ve
Daily Analysis
Consolidation with downside bias
Resistance
1.2560 - 38.2% r of 1.2888-1.2357
1.2533 - Last Thur's high
1.2509 - Mon's high
Support
1.2419 - Wed's low
1.2395 - Tue's low
1.2357 - Last Fri's 26-month low
. EUR/USD - 1.2474 ... Despite Wed's erratic decline to 1.2419, the single currency ratcheted higher on Thur n ratcheted higher back to 1.2490 in NY morning due to renewed cross buying in euro (eur/jpy rallied fm 143.57 to as high as 144.60). Price rose marginally to 1.2492 ahead of New York close b4 easing.
. Looking at the hourly & daily charts, the volatile price action fm last
Fri's 26-month trough at 1.2357 is possibly unfolding into a triangle with a-leg: 1.2509, b-leg: 1.2395, c-leg:1.2499, d-leg:1.2419. Therefore, as long as res at 1.2499 (reaction high on Mon/a-leg top) holds, consolidation with downside bias remains but below 1.2395 sup (b-leg trough) is needed to confirm correction is over n yield resumption of MT downtrend fm May's 2-1/2 year peak at 1.3995 for re-test of 1.2357, then later twd 1.2311 (this is 61.8% projection of 1.3433-1.2500 measured fm 1.2888) next week. On the upside, a daily close abv 1.2509 res wud bring stronger retracement to 1.2533 (last Thur's high) n then 1.2560 (38.2% r of 1.2888-1.2537) but reckon res 1.2577 may hold initially.
. Today, we're holding a short position entered y'day at 1.2485 for subsequent weakness to 1.2510 n only abv 1.2509 res wud abort bearish bias on euro. .png)
Posted by: acetraderforex Nov 18, 2014, 10:58 AM
AceTraderFx Nov 18: Daily Technical Outlook & Trading Ideals on USD/CHF DAILY USD/CHF TECHNICAL OUTLOOK
Last Update At 18 Nov 2014 00:15GMT
Trend Daily Chart
Up
Daily Indicators
Bearish divergences
21 HR EMA
0.9633
55 HR EMA
0.9629
Trend Hourly Chart
Near term up
Hourly Indicators
Rising
13 HR RSI
62
14 HR DMI
+ve
Daily Analysis
Consolidation with upside bias
Resistance
0.9742 - Nov's fresh 1-year peak
0.9700 - Last Tue's high
0.9689 - Last Fri's high
Support
0.9574 - Last Fri's low
0.9553 - Y'day's low
0.9511 - Oct 28 high (now sup)
. USD/CHF - 0.9646... Despite a brief recovery to 0.9601 in Australia on Mon, intra-day sell off in dlr/yen led to broad-based usd's weakness n pressured price to 0.9553 in Asian morning. However, dlr quickly pared its losses n rose to 0.9624 in Europe n then to session high of 0.9652 in NY morning.
. Looking at the hourly n daily charts, despite y'day's retreat to 0.9553, subsequent strg rebound suggests the 1st leg of correction fm Nov's fresh 1-year peak at 0.9742 has ended there n consolidation with upside bias wud be seen. Abv res 0.9689 (last Fri's high) wud add credence to this view n extend gain to 0.9700 (last Tue's top), however, aforesaid peak may hold initially n yield more choppy consolidation. On the downside, only below 0.9553 wud indicate the corrective decline fm 0.9742 has resumed instead n turn outlook bearish for further weakness twds 0.9511 (prev. res, now sup).
. Today, in view of near term bullish bias, we are buying dlr on dips for gain to 0.9700 n only below 0.9574 (Fri's low) wud indicate recovery fm y'day's low at 0.9553 has ended n risk re-test of this lvl later. .png)
Posted by: acetraderforex Nov 21, 2014, 11:18 AM
AceTraderFx Nov 21: Daily Technical Outlook & Trading Ideals on EUR/USD DAILY EUR/USD TECHNICAL OUTLOOK
Last Update At 21 Nov 2014 00:18GMT
Trend Daily Chart
Down
Daily Indicators
Bullish convergences
21 HR EMA
1.2541
55 HR EMA
1.2533
Trend Hourly Chart
Sideways
Hourly Indicators
Neutral
13 HR RSI
55
14 HR DMI
+ve
Daily Analysis
Chopy sideways trading to continue
Resistance
1.2685 - 61.8% r fm 1.2788-1.2357
1.2602 - Wed's NY high
1.2575 - Y'day's high
Support
1.2505 - Y'day's low
1.2480 - 50% r of 1.2357-1.2602
1.2444 - Tue's low
. EUR/USD - 1.2547... The single currency continued to whip around in intra-day trade on Thur. Despite staging a brief bounce fm 1.2524 to 1.2575, euro briefly dived to 1.2505 after release of downbeat German & EZ PMIs, however, the pair rebounded again to 1.2769 in New York morning b4 moving sideways.
. Looking at the hourly chart n daily charts, despite Wed's brief breach of Mon's high of 1.2578 to 1.2602, subsequent retreat to 1.2505 suggests the early 3-legged corrective upmove fm Nov's 26-month trough at 1.2357 has 'possibly' formed a temporary top there n few days of choppy consolidation is in store, how ever, below 1.2501/05 sup (Tue's NY low n y'day's low respectively) is needed to confirm n yield stronger pullback to 1.2444/51 (being Tue's low n 61.8% r of 1.2357-1.2602). Looking ahead, only breach of pivotal sup at 1.2399 wud indicate MT decline fm May's 2-1/2 year peak at 1.3995 has once again resumed n bring retest of 1.2357 low next week. Abv 1.2602 wud send euro to 1.2622 n later 1.2685, being 50% n 61.8% r respectively of intermediate fall fm 1.2888-1.2357.
. Today, we are standing ahead initially n may give a buy recommendation if price holds abv 1.2505 for a move to 1.2622. .png)
Posted by: acetraderforex Nov 28, 2014, 10:04 AM
AceTraderFx Nov 28: Daily Technical Outlook & Trading Ideals on EUR/USD DAILY EUR/USD TECHNICAL OUTLOOK
Last Update At 28 Nov 2014 00:14GMT
Trend Daily Chart
Down
Daily Indicators
Bullish convergences
21 HR EMA
1.2475
55 HR EMA
1.2477
Trend Hourly Chart
Sideways
Hourly Indicators
Falling
13 HR RSI
33
14 HR DMI
-ve
Daily Analysis
Consolidation with downside bias
Resistance
1.2575 - Last Fri's high
1.2532 - Wed's high
1.2499 - Y'day's N. American high
Support
1.2444 - Wed's low
1.2402 - Tue's low
1.2357 - Nov 07 26-month low
. EUR/USD - 1.2456 ... Despite euro's brief bounce to 1.2524 in European morning on Thur, offers below Wed's 1.2532 checked intra-day gain n traders sold euro broadly after weak Spanish inflation data. Euro later ratcheted higher back to 1.2499 in quiet N. American session on short covering b4 coming off.
. Looking at the hourly n daily charts, although Wed's brief rally to 1.2532 suggests the decline fm last Wed's high at 1.2602 has indeed formed a low at 1.2360 on Mon n further 'choppy' consolidation abv Nov's 26-month trough at 1.2357 wud continue, y'day's retreat suggests downside bias remains, below 1.2444 sup wud bring subsequent decline twd 1.2402, a daily close below this pivotal sup is needed to confirm the recovery is over n yield resumption of MT downtrend for re-test 1.2357/60, then 1.2311 next week. On the upside, only abv 1.2532 wud extend aforesaid rise twd 1.2568/75 res area, however, as broad outlook remains 'consolidative', daily res at 1.2602 shud cap upside n yield decline later.
. Today, euro's intra-day break of y'day's 1.2466 low suggests the single currency shud remain under pressure n decline to our daily downside target at 1.2415 (our daily position is holding short at 1.2490). 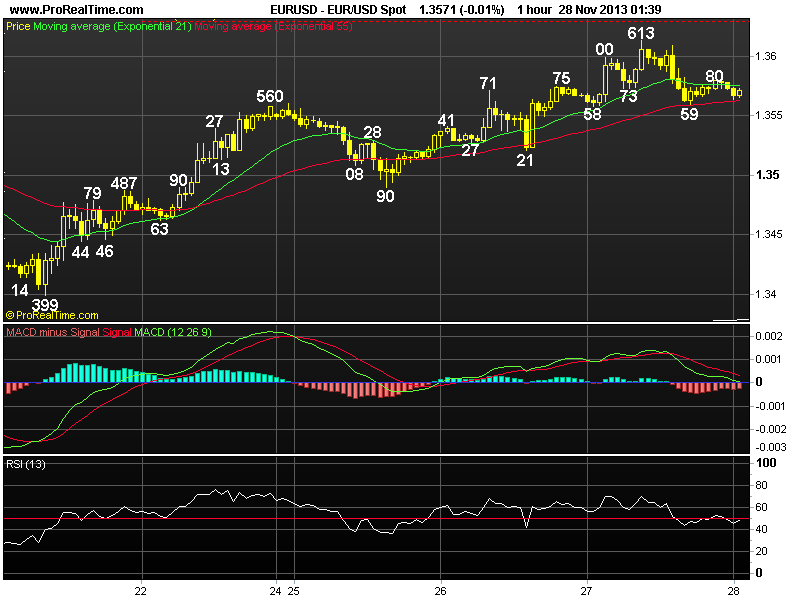
Posted by: acetraderforex Dec 2, 2014, 10:33 AM
AceTraderFx Dec 2:Daily Technical Outlook & Trading Ideals on USD/JPY DAILY USD/JPY TECHNICAL OUTLOOK
Last Update At 01 Dec 2014 23:27GMT
Trend Daily Chart
Up
Daily Indicators
Rising
21 HR EMA
118.38
55 HR EMA
118.33
Trend Hourly Chart
Sideways
Hourly Indicators
Falling
13 HR RSI
46
14 HR DMI
-ve
Daily Analysis
Consolidatoin with downside bias
Resistance
119.15 - Y'day's fresh 7-year peak
118.98 - Prev. high on Nov 20
118.53 - Hourly chart
Support
117.87 - Y'day's low
117.24 - Last Thur's low
116.51 - 50% of the intermediate rise of 113.86-119.15
. USD/JPY - 118.30... Although dlr briefly jumped to a fresh 7-year peak at 119.15 in early Europe after Moody's downgraded Japan's rating to A1, price swiftly nose-dived to 118.09 on long-liquidation. Later, dlr fell to 117.87 in NY morning b4 recovering after upbeat ISM U.S. manf. PMI, d;r climbed to 118.41.
. Looking at the hourly n daily charts, y'day's aforesaid sharp decline after a brief breach of Nov's peak at 118.98 to 119.15 suggests LT up move fm record low at 75.32 (Oct 2011) has made a temporary top n a few days of choppy trading below this res wud be seen, a breach of 117.68/74 (hourly chart n 38.2% r of intermediate rise of 115.46-119.15) wud add credence to this view n yield stronger retracement twd 117.24/31, being last Thur's low n the 'natural' 50.0% of aforesaid upmove, however, reckon 116.51, being 50% r of intermediate rise of 113.86-119.15, wud hold n bring rebound later this week.
. Today, as long as 119.15 top holds, selling dlr on recovery in anticipation of another corrective fall twd 117.50 is favoured. Only a firm rise abv 119.15 wud revive early bullishness n extend gain to 119.35/40 n then later twd 119.80, this is 50% proj. of 113.86-118.98 measured fm 117.24. .png)
Posted by: acetraderforex Dec 4, 2014, 10:43 AM
AceTraderFx Dec 4:Daily Technical Outlook & Trading Ideals on GBP/USD
DAILY GBP/USD TECHNICAL OUTLOOK
Last Update At 04 Dec 2014 00:17GMT
Trend Daily Chart
Sideways
Daily Indicators
Turning up
21 HR EMA
1.5679
55 HR EMA
1.5678
Trend Hourly Chart
Sideways
Hourly Indicators
Neutral
13 HR RSI
57
14 HR DMI
+ve
Daily Analysis
Choppy consolidation to continue
Resistance
1.5826 - Last Thur's high
1.5763 - Mon's high
1.5719 - Y'day's high
Support
1.5619 - Y'day's low
1.5585 - Mon's fresh 14-1/2 month low
1.5528 - 50% proj. of 1.6186-1.5590 fm 1.5826
. GBP/USD - 1.5690... Cable swung wildly on Wed, despite a euro-led brief drop fm 1.5656 to 1.5619 in Europe, cross-buying in sterling lifted price n cable rebounded on short covering after upbeat U.K. services PMI n the upgrade of U.K. growth forecasts fm OBR. Price rose to 1.5719 in NY b4 retreating.
. Looking at the hourly n daily charts, despite cable's strg decline after Mon's rally fm a fresh 14-1/2 month trough at 1.5585 to 1.5763, y'day's rebound fm 1.5619 suggests further choppy trading abv said temporary bottom wud continue . Although consolidation with near term upside bias is seen, as long as 1.5763 res (reaction high) holds, prospect of another fall later today or tom still remains. Looking ahead, a breach of 1.5619 wud signal MT downtrend fm Jul's near 6-year peak at 1.7192 has resumed n bring re-test of 1.5585, break wud extend subsequent weakness to 1.5528, this is the 50% projection of intermediate fall fm 1.6186-1.5590 measured fm 1.5826.
. On the upside, abv 1.5763 wud confirm a temporary low is made instead n stronger retracement to 1.5826 wud follow. We are standing aside initially today n investors shud pay attention to the release of BoE rate decision at 12:00GMT. 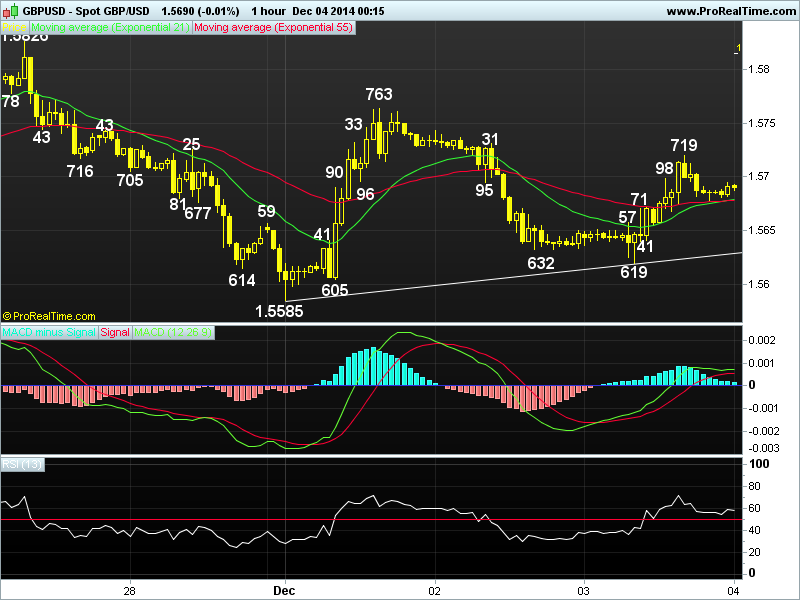
Posted by: acetraderforex Dec 5, 2014, 11:02 AM
AceTraderFx Dec 5:Daily Technical Outlook & Trading Ideals on EUR/USD DAILY EUR/USD TECHNICAL OUTLOOK
Last Update At 05 Dec 2014 00:14GMT
Trend Daily Chart
1.2364
Daily Indicators
Bullish convergences
21 HR EMA
Down
55 HR EMA
1.2364
Trend Hourly Chart
58
Hourly Indicators
Rising
13 HR RSI
Sideways
14 HR DMI
+ve
Daily Analysis
Choppy consoldiation iwth a neutral bias
Resistance
1.2532 - Last Wed's high
1.2507 - Mon's high
1.2457 - Y'day's high
Support
1.2340 - Hourly chart
1.2280 - Y'day fresh 27-month low
1.2242 - 2012 Aug 10 low
. EUR/USD - 1.23845... Euro rallied sharply against the usd on Thur as ECB refrained fm adding stimulus measures. Although price briefly fell to a fresh 27-month low at 1.2280 at the start of ECB's press conference, euro jumped to 1.2414 n then rose to 1.2457 on short-covering b4 retreating to 1.2360.
. Looking at the hourly n daily charts, y'day's rally fm a fresh 27-month trough to as high as 1.2457 in choppy NY session suggests MT downtrend fm May's 2-1/2 year peak at 1.3995 has formed a temporary low there n despite subsequent retreat, as long as 1.2325 (Thur's European morning high, now sup) holds, consolidation with upside bias remains, a daily close abv 1.2457 wud add credence to this view, then euro bring another leg of correction twd 1.2525/32(50% r of 1.2771-1.2280 n Nov 26 high respectively), however, as hourly technical indicators' readings wud be in o/bot territory on such move, a strg retreat is likely to take place next week.
. Today, in view of abv analysis, we're trading euro on both sides of the market initially as choppy sideways move is expected ahead of the key monthly U.S. jobs data. Only below 1.2280 wud risk one more fall to 1.2245/55. 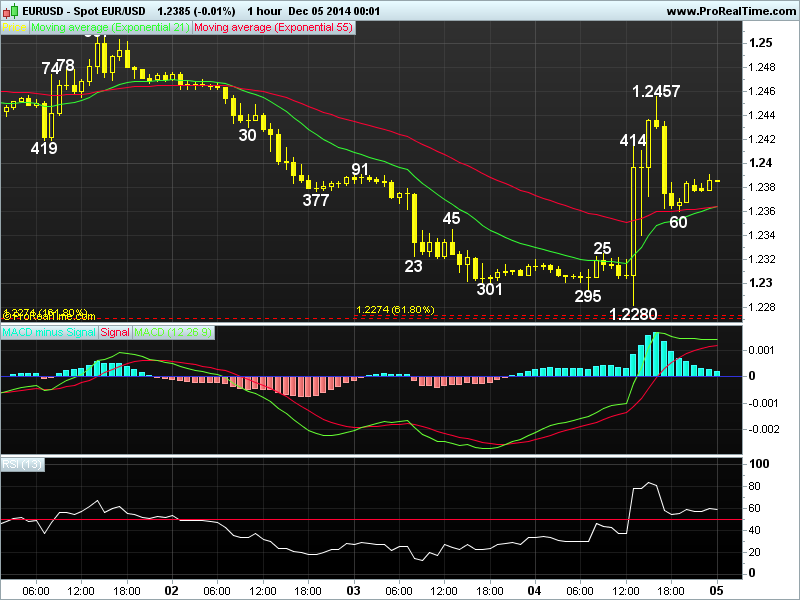
Posted by: acetraderforex Dec 9, 2014, 10:12 AM
AceTraderFx Dec 9: Daily Technical Outlook & Trading Ideals on USD/CHF
DAILY USD/CHF TECHNICAL OUTLOOK
Last Update At 09 Dec 2014 00:18GMT
Trend Daily Chart
Up
Daily Indicators
Bearish divergences
21 HR EMA
0.9774
55 HR EMA
0.9767
Trend Hourly Chart
Sideways
Hourly Indicators
Rising fm o/s
13 HR RSI
46
14 HR DMI
-ve
Daily Analysis
Resumption of MT downtrend
Resistance
0.9875 - 61.8% proj. of 0.8857-0.8690 fm 0.9360
0.9843 - 1.236 times extn. of 0.9530-0.9731 fm 0.9695
0.9818 - Y'day's high
Support
0.9738 - Last Fri's Euroepean high
0.9703 - Last Fri's low
0.9650 - Last Thur's low
. USD/CHF - 0.9767... Despite a brief retreat to 0.9774 in Asian morning y'day, renewed buying emerged n pushed price higher to a fresh 1-1/2 year peak of 0.9818 in European morning on renewed euro's weakness. However, price pared retreated sharply to 0.9738 in NY session due to broad-based usd's decline.
. Despite dlr's resumption of the 3-legged uptrend fm Mar's 2-1/2 year trough at 0.8698 to 0.9818, subsequent retreat to 0.9738 suggests a minor top is possibly in place n below 0.9703 wud add credence to this view, then several days of choppy consolidation with downside bias wud be seen n bring a long-overdue minor correction to 0.9650, however, reckon 0.9595 sup wud remain intact n yield subsequent rebound. On the upside, abv 0.9818 wud yield marginal gain twd 0.9875, this is 61.8% proj. of the MT intermediate rise fm 0.8857-0.8690 measured fm 0.9360. Having said that, as hourly & daily indicators' readings wud display 'bearish divergences' on such move, 'psychological res at 1.0000 shud remain intact this week n bring a strg correction.
. Today, in view of broad consolidation outlook, we're trading dlr on both sides of the market n wud sell on recovery or buy on next intra-day decline. 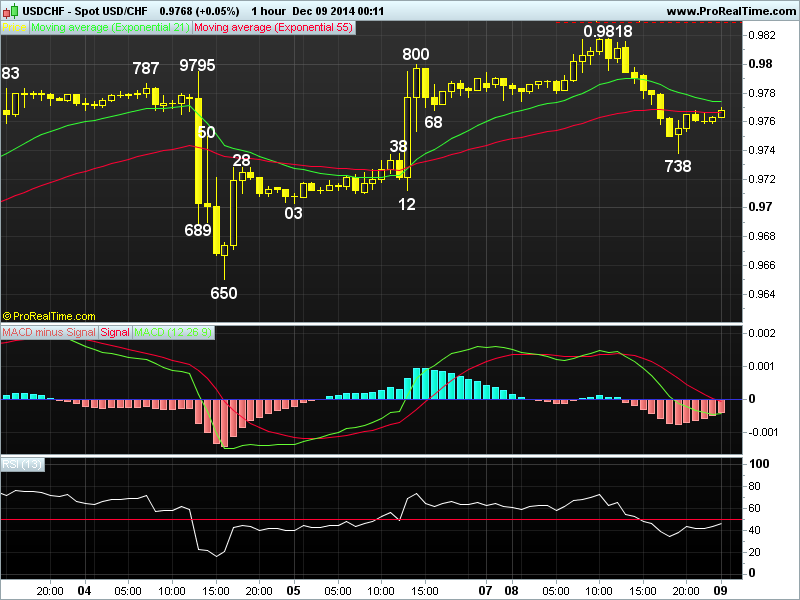
Posted by: acetraderforex Dec 16, 2014, 10:39 AM
AceTraderFx Dec 16: Daily Technical Outlook & Trading Ideals on USD/JPY DAILY USD/JPY TECHNICAL OUTLOOK
Last Update At 16 Dec 2014 00:08GMT
Trend Daily Chart
Sideways
Daily Indicators
Bearish divergences
21 HR EMA
118.15
55 HR EMA
118.44
Trend Hourly Chart
Sideways
Hourly Indicators
Falling
13 HR RSI
43
14 HR DMI
-ve
Daily Analysis
Choppy consolidation to continue
Resistance
119.56 - Last Thur's high
119.06 - Mon's high
118.98 - Mon's NY high
Support
117.45 - Last Thur's low
117.06 - Nov 17 high, now sup
116.41 - 38.2% r of 107.61-121.85
. USD/JPY - 117.94... Dlr swung wildly on Mon following Japan's national election on Sun. Despite falling fm NZ's high of 119.04 to 117.78 ahead of Tokyo open, dlr swiftly rallied to 119.06 in Asia. Dlr later chopped inside 117.78-119.06 range in Europe b4 falling to a fresh intra-day low at 117.57 in NY.
. Looking at the hourly n daily charts, y'day's decline to 117.57 signals recovery fm last Thur's low at 117.45 has indeed ended the same day at 119.56 n re-test of this sup wud be seen, a firm break there wud confirm LT uptrend fm 2011 record low at 75.32 has formed a temporary top at 121.85 (7-year peak on Dec 7), then the pair will be en route to 116.41, being a 'minimum' 38.2% r of the MT intermediate rise fm 107.61-121.85, however, reckon 114.73 (50% r) wud contain weakness this month n yield subsequent rebound.
. In view of abv analysis, despite recent volatile swing inside established range of 117.45-119.56, selling dlr on intra-day recovery for re-test of 117.45 is favoured n later resumption of aforesaid fall twd 117.06 (Nov 17 high) is recommended, however, price shud hold well abv 116.41 today. On the upside, only abv 119.00 wud prolong choppy trading but 119.56 res shud remain intact. 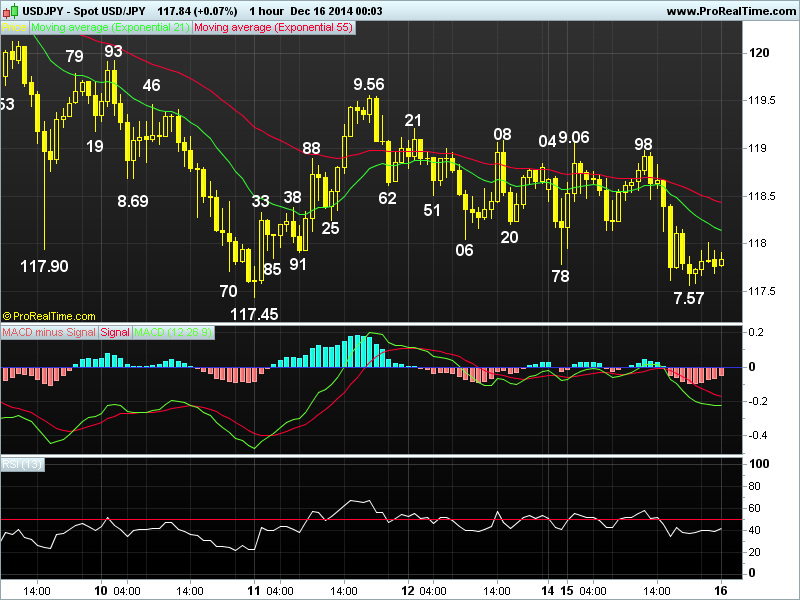
Posted by: acetraderforex Dec 23, 2014, 11:02 AM
AceTraderFx Dec 23: Daily Technical Outlook & Trading Ideals on EUR/USD DAILY EUR/USD TECHNICAL OUTLOOK
Last Update At 22 Dec 2014 23:49GMT
Trend Daily Chart
Sideways
Daily Indicators
Bullish convergences
21 HR EMA
1.2242
55 HR EMA
1.2286
Trend Hourly Chart
Down
Hourly Indicators
Bullish convergences
13 HR RSI
45
14 HR DMI
-ve
Daily Analysis
Consolidation b4 MT decline resumes
Resistance
1.2347 - 50% r of 1.2474-1.2220
1.2302 - Last Fri's high
1.2272 - Y'day's high
Support
1.2216 - 61.8% proj. of 1.2474-1.2277 fm 1.2358
1.2174 - 61.8% proj. of 1.2888-1.2247 fm 1.2570
1.2146 - 61.8% proj. of 1.3700-1.2500 fm 1.2888
. EUR/USD - 1.2223... Euro gained a respite on Mon after failure to breach last Fri's fresh 27-mth trough at 1.2220. Price ratcheted higher fm NZ's low at 1.2220 in Asia n then climbed to 1.2272 in European morning. Later, euro briefly fell to 1.2250 in NY morning n fell to a session low at 1.2217 near NY close.
. Looking at the daily chart, as previously mentioned, euro's resumption of MT downtrend fm 2014 high at 1.3995 (May) to 1.2220 last Fri suggests initial downside bias remains for further weakness to 1.2146, this is 61.8% proj. of intermediate downtrend fm 1.3700 to 1.2500 measured fm 1.2888. Having said that, as daily technical indicators' readings wud display prominent bullish convergences on such a move, reckon 'psychological' sup at 1.2000 wud remain intact this month n early Jan 2015 n risk has increased for a much-needed correction to take place later. On the upside, only a daily close abv 1.2386 (prev. hourly sup, now res) wud signal a low is in place, then risk a correction twd 1.2570.
. Today, as long as 1.2272 res holds, downside bias remains for MT down-trend to extend to 1.2200 n 1.2174 (61.8% proj. of 1.2888-1.2247 fm 1.2570) but loss of momentum wud limit fall to 1.2146. .png)
Posted by: acetraderforex Jan 6, 2015, 11:12 AM
AceTraderFx Jan 6: Daily Technical Outlook & Trading Ideals on GBP/USD DAILY GBP/USD TECHNICAL OUTLOOK
Last Update At 06 Jan 2015 00:40GMT
Trend Daily Chart
Down
Daily Indicators
Bullish convergences
21 HR EMA
1.5267
55 HR EMA
1.5345
Trend Hourly Chart
Down
Hourly Indicators
Turning up
13 HR RSI
45
14 HR DMI
-ve
Daily Analysis
Consolidation b4 one more fall
Resistance
1.5386 - Hourly sup (now res)
1.5352 - 38.2% r of 1.5621-1.5185
1.5320 - Y'day Asian high
Support
1.5203 - Y'day's NY morning sup
1.5185 - Y'day's fresh 16-month low (Reuters)
1.5137 - 1.618 times extn of 1.5785-1.5486 fm 1.5621
. GBP/USD - 1.5263... Cable tracked euro's intra-day move closely on Mon. Despite falling sharply below Fri's low of 1.5326 to a fresh 16-month trough at 1.5185 (Reuters) in thin Aust., short-covering lifted pound to 1.5320 in Asia b4 dropping to 1.5203 in NY morning. Cable later recovered to 1.5270 near NY close.
. Looking at the bigger picture, as mentioned previously, cable's break of Dec's 1.5486 to on 1.5326 Fri signals MT downtrend fm 2014 peak at 1.7192 (Jul) has once again resumed n a re-test of said Mon's low wud be seen after consolidation, break wud extend weakness to 1.5137 (1.618 times extension of 1.5785-1.5486 measured fm 1.5621) n then 1.5100. Having said that, as the daily technical indicators wud display 'bullish convergences' on such move, reckon psychological sup at 1.5000 wud hold on 1st testing this week n risk a minor correction later. On the upside, only a daily close abv 1.5486 wud signal a temporary low is made, then retracement to 1.5555 n possibly twd 1.5621 is likely b4 down.
. Today, as 1.5320 has capped rebound fm 1.5185, selling cable on intra-day recovery is recommended. On the upside, only abv 1.5352 (38.2% r of 1.5621-1.5185) risks retracement twd 1.5403 (50% r) but 1.5454 (61.% r) shud hold. .png)
Posted by: acetraderforex Mar 31, 2015, 10:46 AM
AceTraderFx Mar 31: Daily Technical Outlook & Trading Ideals USD/CHF DAILY USD/CHF TECHNICAL OUTLOOK
Last Update At 31 Mar 2015 00:18GMT
Trend Daily Chart
Sideways
Daily Indicators
Turning down
21 HR EMA
0.9666
55 HR EMA
0.9643
Trend Hourly Chart
Near term up
Hourly Indicators
Rising
13 HR RSI
58
14 HR DMI
+ve
Daily Analysis
Choppy consolidation to continue
Resistance
0.9796 - Last Mon's Asian high
0.9729 - Mar 20 low (now res)
0.9693 - Last Fri's high
Support
0.9605 - Y'day's low
0.9558 - Last Fri's low
0.9536 - Last Tue's low
. USD/CHF - ...... Although the greenback traded sideways in Asia n briefly edged lower to 0.9605 in European morning, price swiftly rose to 0.9674 b4 retreating. However, dlr found renewed buying at 0.9620 in NY morning n gained to session high at 0.9689, helped by upbeat U.S. pending home sales data.
. Looking at the hourly n daily charts, dollar's strg rebound fm last wk's low at 0.9491 (Thur) to 0.9693 last Fri suggests the early 3-legged decline fm Mar's 2-month peak at 1.0129 has made a temporary low there n choppy trading with upside bias is seen. Abv 0.9693 wud extend gain twd 0.9729 (prev. sup, now res), then twds 0.9738, being the 50% r of fall fm 0.9984-0.9491, however, strg rise abv there is unlikely to be seen this week n reckon res 0.9796 wud remain intact n yield retreat later. On the downside, only below 0.9491 wud revive bearishness for a stronger retrace. of upmove fm Jan's 40-month trough at 0.7360 twds to 0.9448/50 (26 Feb low n 38.2% r of 0.8352 to 1.0129 resp.).
. Today, as current price is trading abv 21-hr n 55-hr emas, suggesting consolidation with upside bias remains, however, as hourly oscillators wud display bearish divergences on next rise, reckon 0.9729 wud hold on 1st testing. .png)
Powered by Invision Power Board (http://www.invisionboard.com)
© Invision Power Services (http://www.invisionpower.com)