Printable Version of Topic
Click here to view this topic in its original format
InstaForex | Forex Forum | Forex world | InstaForex Forum _ Economic News _ Daily reviews by BJF Trading Group
Posted by: MDunleavy Aug 4, 2009, 10:05 PM
Did Tuesday's mixed US data stop the dollar's plunge in its tracks,
or was it the more thematic risk appetite influence once again?
I think the answer is not nobody knows.
[The U.S. Dollar Index
Posted by: MDunleavy Aug 14, 2009, 12:56 PM
The U.S. Dollar Index
Posted by: MDunleavy Aug 26, 2009, 09:43 AM
The US Dollar looks to be forming a bottom against most major currencies. Although confirmation
is yet to be seen, accumulating evidence is hinting at a reversal of recent rallies in the
Euro, the British Pound as well as the Australian and New Zealand Dollars. [dailyfx]
========
Remind:The U.S. Dollar Index
Posted by: MDunleavy Sep 2, 2009, 05:17 PM
Daily Report: Dollar and Yen to Strengthen Further, Focus on Eurozone GDP and US ADP
(The U.S. Dollar Index
Posted by: MDunleavy Sep 3, 2009, 04:52 PM
At this point, intraday bias in GBP/USD remains mildly on the upside. As discussed before, a short term bottom is in place at 1.6111 with bullish convergence condition in 4 hours MACD. Hence further rise could still be seen. Nevertheless, upside should be limited below 1.6622 resistance and bring resumption of fall from 1.7043. Below 1.6235 will flip intraday bias back to the downside first and break of 1.6111 will target 1.5983 key support next.[actionforex]
P&F GBPUSD30 Box Size 30X3 or(0.54%) HI/LO
Data 1.7031 - 1.6118 ~ 1.5 Month ~ 43.48 Day
Database 1500 records 1.63481 (Last Close)
2009-07-22 05~00
2009-09-03 16~30 (GMT+01:00) Paris
BJF Trading Group
1.7040|~3O|||_________X_________________________|0.01%|5.75%
1.7040|~3O|||=========X=========================|0.01%|5.75%
1.7010|~6O|||_________XOXO______________________|0.19%|5.57%
1.6980|~9O|||_______X_XOXO______________________|0.36%|5.38%
1.6950|~12O||_______XOXO_O______________________|0.54%|5.19%
1.6920|~15O||_______XOX__O______________________|0.72%|5.01%
1.6890|~18O||_______XO___O______________________|0.89%|4.82%
1.6860|~21O||_______X____O______________________|1.07%|4.64%
1.6830|~24O||_______X____O______________________|1.24%|4.45%
1.6800|~27O||=======X====OX=====================|1.42%|4.26%
1.6770|~3OO||_______X____OXO____________________|1.6%|4.08%
1.6740|~33O||_______X____OXO____________________|1.77%|3.89%
1.6710|~36O||_______X____OXO____________________|1.95%|3.71%
1.6680|~39O||_______X____O_O____________________|2.12%|3.52%
1.6650|~42O||=======X======O==X=================|2.3%|3.33%
1.6620|~45O||_______X______O__XO______X_________|2.48%|3.15%
1.6590|~48O||_______X______O__XOX_X_X_XO________|2.65%|2.96%
1.6560|~51O||_X_____X______O__XOXOXOXOXO________|2.83%|2.77%
1.6530|~54O||_XOX___X______OX_XOXOXOXOXO________|3%|2.59%
1.6500|~57O||_XOXO__X______OXOXO_OXOXOXO________|3.18%|2.4%
1.6470|~6OO||_XOXO__X______OXOX__OXOXOXO________|3.36%|2.22%
1.6440|~63O||_XOXOX_X______OXO___OXOXO_OX_______|3.53%|2.03%
1.6410|~66O||=XO=OXOX======O=====OXOX==OXO====X=|3.71%|1.84%
1.6380|~69O||OX__OXOX____________OXO___OXOX___X_|3.88%|1.66%
1.6350|~72O||OX__O_O_____________OX____O_OXOX_X_|4.06%|1.47%
1.6320|~75O||O___________________OX______OXOXOX_|4.24%|1.28%
1.6290|~78O||____________________O_______OXOXOX_|4.41%|1.1%
1.6260|~81O||____________________________OXOXOX_|4.59%|0.91%
1.6230|~84O||____________________________OXOXOX_|4.76%|0.73%
1.6200|~87O||____________________________OXO_OX_|4.94%|0.54%
1.6170|~9OO||____________________________O___OX_|5.12%|0.35%
1.6140|~93O||================================O==|5.29%|0.17%
1.6110|~96O||___________________________________|5.47%|-0.02%
Column|~99O||3854633235321414375311775693976579_|
Count||||||||_______1____2_3_____OO_____________|
Posted by: MDunleavy Sep 4, 2009, 09:36 AM
USD/CAD once again fails below 1.1123 resistance and retreated. Break of 1.1004 minor support turns intraday outlook neutral again. On the downside, further break of 1.0870 minor support will flip intraday bias back to the downside for 1.0718 support. As noted before, break there will indicate that price actions from 1.0631 are merely consolidation in the larger decline, which is still in progress for another low below 1.0631 before completion. On the upside, break of 1.1123 resistance will confirm that whole rally from 1.0631 has resumed and affirm the case that USD/CAD has indeed bottomed out already. In such case, stronger rise should be seen to 1.1723 resistance next.[actionforex]
Trade Idea: Buy UsdCad
P&F USDCAD5 Box Size 10X3 or(0.27%) HI/LO
Data 1.1101 - 1.0791 ~ 0 Month ~ 7.27 Day
Database 1508 records 1.10269 (Last Close)
2009-08-28 00~50
2009-09-04 07~25 (GMT+01:00) Paris
BJF Trading Group
1.1100|~2O|||=====================X===========|0.01%|2.86%
1.1090|~3O|||_______X_____________XoX_________|0.1%|2.77%
1.1080|~4O|||_______Xo____________XoXo________|0.19%|2.68%
1.1070|~5O|||_______Xo____________XoXoX_X_X___|0.28%|2.59%
1.1060|~6O|||_______Xo__________X_XoXoXoXoXo__|0.37%|2.49%
1.1050|~7O|||_______Xo________X_XoXo_oXoXoXoX_|0.46%|2.4%
1.1040|~8O|||_______Xo________XoXoX__oXoXo_oXo|0.55%|2.31%
1.1030|~9O|||_______Xo________XoXoX__o_oX__oXo|0.64%|2.21%
1.1020|~1OO||=======Xo========Xo=oX====oX==o=o|0.73%|2.12%
1.1010|~11O||_______XoX_______X__o_____oX_____|0.82%|2.03%
1.1000|~12O||_______XoXo______X________oX_____|0.91%|1.94%
1.0990|~13O||_______XoXo____X_X________oX_____|1%|1.84%
1.0980|~14O||_______Xo_o____XoX________oX_____|1.09%|1.75%
1.0970|~15O||=======X==oX=X=XoX========o======|1.18%|1.66%
1.0960|~16O||_______X__oXoXoXoX_______________|1.27%|1.57%
1.0950|~17O||_____X_X__oXoXoXoX_______________|1.36%|1.47%
1.0940|~18O||_____XoX__o_oXo_oX_______________|1.45%|1.38%
1.0930|~19O||___X_XoX____oX__oX_______________|1.54%|1.29%
1.0920|~2OO||___XoXoX____oX__oX_______________|1.63%|1.2%
1.0910|~21O||___XoXo_____oX__o________________|1.72%|1.1%
1.0900|~22O||___Xo_______oX___________________|1.81%|1.01%
1.0890|~23O||___X________oX___________________|1.9%|0.92%
1.0880|~24O||o==X========o====================|1.99%|0.82%
1.0870|~25O||o__X_____________________________|2.08%|0.73%
1.0860|~26O||o__X_____________________________|2.17%|0.64%
1.0850|~27O||oX_X_____________________________|2.26%|0.55%
1.0840|~28O||oXoX_____________________________|2.35%|0.45%
1.0830|~29O||oXoX_____________________________|2.44%|0.36%
1.0820|~3OO||oXoX_____________________________|2.53%|0.27%
1.0810|~31O||oXo______________________________|2.62%|0.18%
1.0800|~32O||o================================|2.71%|0.08%
1.0790|~33O||_________________________________|2.8%|-0.01%
Column|~34O||954135411373993581345954641133533|
Count|~35O|||___2___81________4________OO_____|
http://iticsoftware.com/postimages/2009-Jun-19/usdcad040909.png http://iticsoftware.com/postimages/2009-Jun-19/cadusdPDF040909.pdf PDF
Posted by: MDunleavy Sep 16, 2009, 07:24 PM
Mid-Day Report: Dollar Soft after Making New Low
Dollar remains pressured after making new low against Euro, Yen and Aussie today. Economic data released from US provide little support to the greenback. Dollar index continue to hover around today's low of 76.20. Stocks open high on further rebound in commodities which saw the CRB index pressing 259 level. Gold remains firm after climbing to as high as 1023.3 earlier today. The Japanese yen also strengthened broadly after Hiroshia Fuji, the next finance chief in Japan, said today that he didn't support a "weaker yen". [actionforex]
P&F _DXY60 Box Size 16X3 or(0.61%) HI/LO
Data 80.95 - 76.15 ~ 3 Month ~ 91.25 Day
Database 1501 records 76.27 (Last Close)
2009-06-17 13~00
2009-09-16 19~00 (GMT+01:00) Paris
BJF Trading Group
80.96|~16|||___________________________________|-0.01%|6.32%
80.80|~32|||___XoX_____X_X_____________________|0.19%|6.11%
80.64|~48|||oX_XoXo____XoXo____________________|0.38%|5.9%
80.48|~64|||oXoXoXo____XoXoX___________________|0.58%|5.69%
80.32|~8O|||oXoXoXo__X_XoXoXo__________________|0.78%|5.48%
80.16|~96|||o_oXoXoX_XoXo_oXo__________________|0.98%|5.27%
80.00|~112||__o_oXoXoXoX__oXo__________________|1.17%|5.06%
79.84|~128||____oXoXoXoX__o_o__________________|1.37%|4.85%
79.68|~144||____o_o_oXoX____o__________________|1.57%|4.64%
79.52|~16O||________o_o_____o__X_______________|1.77%|4.43%
79.36|~176||________________o__XoX_X___________|1.96%|4.22%
79.20|~192||________________o__XoXoXo__________|2.16%|4.01%
79.04|~2O8||________________oX_XoXoXo__________|2.36%|3.8%
78.88|~224||________________oXoXoXoXo____X_____|2.56%|3.59%
78.72|~24O||________________oXoXoXoXoX___Xo____|2.75%|3.37%
78.56|~256||________________o_oXoXoXoXoX_XoX___|2.95%|3.16%
78.40|~272||__________________o_oXoXoXoXoXoXo__|3.15%|2.95%
78.24|~288||____________________oXo_oXoXoXoXo__|3.35%|2.74%
78.08|~3O4||____________________oX__oXoXo_o_o__|3.55%|2.53%
77.92|~32O||____________________oX__o_o_____o__|3.74%|2.32%
77.76|~336||____________________oX__________o__|3.94%|2.11%
77.60|~352||____________________oX__________o__|4.14%|1.9%
77.44|~368||____________________o___________o__|4.34%|1.69%
77.28|~384||________________________________o__|4.53%|1.48%
77.12|~4OO||________________________________o__|4.73%|1.27%
76.96|~416||________________________________oX_|4.93%|1.06%
76.80|~432||________________________________oXo|5.13%|0.85%
76.64|~448||________________________________oXo|5.32%|0.64%
76.48|~464||________________________________o_o|5.52%|0.43%
76.32|~48O||__________________________________o|5.72%|0.22%
76.16|~496||__________________________________o|5.92%|0.01%
76.00|~512||___________________________________|6.11%|-0.2%
Column||||||43458773455844641347117795543553135|
Count|||||||________________2___32__________3__|
http://iticsoftware.com/postimages/2009-Jul-01/dxy160909.PNG
Posted by: MDunleavy Sep 21, 2009, 09:27 PM
EUR/USD's break of 1.4640 minor support indicates that a short term top should be in place at 1.4765 on bearish divergence conditions in 4 hours MACD and RSI. Intraday bias remains mildly on the downside and further pull back should be seen towards 1.4500 support and possibly below. On the upside, above 1.4765 will indicate that pull back has completed and recent rally has resumed. Nevertheless, we'll continue to look for further loss of momentum and reversal signal as EUR/USD approaches 1.4867 key resistance level.[actionforex]
P&F EURUSD1440 Box Size 1450X3 or(3.14%) HI/LO
Data 1.6038 - 1.1639 ~ 69 Month ~ 2107 Day
Database 1500 records 1.46751 (Last Close)
2003-12-15 00~00
2009-09-21 00~00 (GMT+01:00) Paris
http://iticsoftware.com
1.6095|~145||_________________________________________|-0.36%|38.29%
1.5950|~29O||__________________X___X__________________|0.55%|37.04%
1.5805|~435||________________X_XoX_Xo_________________|1.45%|35.79%
1.5660|~58O||________________XoXoXoXo_________________|2.36%|34.55%
1.5515|~725||________________XoXoXoXo_________________|3.26%|33.3%
1.5370|~87O||________________Xo_o_o_o_________________|4.17%|32.06%
1.5225|~1O15|________________X______o_________________|5.07%|30.81%
1.5080|~116O|________________X______o_________________|5.97%|29.56%
1.4935|~13O5|____________X_X_X______o_________________|6.88%|28.32%
1.4790|~145O|____________XoXoX______oX________________|7.78%|27.07%
1.4645|~1595|============XoXoX======oXo======X=======X|8.69%|25.83%
1.4500|~174O|____________XoXo_______oXo______Xo______X|9.59%|24.58%
1.4355|~1885|____________Xo_________oXo______Xo______X|10.49%|23.34%
1.4210|~2O3O|____________X__________oXo______Xo____X_X|11.4%|22.09%
1.4065|~2175|____________X__________oXo______Xo____XoX|12.3%|20.84%
1.3920|~232O|____________X__________o_o______Xo____XoX|13.21%|19.6%
1.3775|~2465|____________X____________o______XoX___Xo_|14.11%|18.35%
1.3630|~261O|__X_________X____________o______XoXoX_X__|15.01%|17.11%
1.3485|~2755|__Xo________X____________o______XoXoXoX__|15.92%|15.86%
1.3340|~29OO|__XoX_____X_X____________o______Xo_oXoX__|16.82%|14.61%
1.3195|~3O45|__XoXo____XoX____________oX_____X__oXoX__|17.73%|13.37%
1.3050|~319O|__XoXo____XoX____________oXoX_X_X__oXoX__|18.63%|12.12%
1.2905|~3335|X_XoXo__X_Xo_____________oXoXoXoX__oXo___|19.53%|10.88%
1.2760|~348O|XoXo_o__XoX______________oXoXoXoX__oX____|20.44%|9.63%
1.2615|~3625|XoX__o__XoX______________oXo_oXo___oX____|21.34%|8.39%
1.2470|~377O|XoX__oX_Xo_______________o___o_____o_____|22.25%|7.14%
1.2325|~3915|_oX__oXoX________________________________|23.15%|5.89%
1.2180|~4O6O|_oX__oXoX________________________________|24.06%|4.65%
1.2035|~42O5|_oX__oXoX________________________________|24.96%|3.4%
1.1890|~435O|_o___o_oX________________________________|25.86%|2.16%
1.1745|~4495|_______o_________________________________|26.77%|0.91%
1.1600|~464O|_________________________________________|27.67%|-0.34%
Column|~4785|47164145836314439344334161543443193985936|
Count|~||||||__2__O______4__________4_6______4________|
http://iticsoftware.com/postimages/2009-Aug-03/eurusd210909.PNG
Posted by: MDunleavy Sep 21, 2009, 09:33 PM
Outlook in GBP/JPY remains unchanged. Intraday bias remains on the downside with 151.16 minor resistance intact and further fall should be seen to 146.75 cluster support next (38.2% retracement of 118.81 to 163.05 at 146.15). Break there will confirm that a medium term top is formed at 163.05 and will bring deeper fall to 61.8% retracement at 135.70 next. On the upside, above 151.16 minor resistance will argue that some more consolidation could be seen before fall resumption. In such case, GBP/JPY might rebound to 153.22 and above but upside is still expected to be limited below 157.47 resistance.[actionforex]
P&F GBPJPY5 Box Size 12X4 or(0.32%) HI/LO
Data 151.718 - 148.038 ~ 0 Month ~ 6.23 Day
Database 1207 records 149.38 (Last Close)
2009-09-15 09~40
2009-09-21 15~10 (GMT+01:00) Paris
http://iticsoftware.com
151.68|~12|||__x_________________________________________________|0.03%|2.46%
151.56|~24|||__x_o_______________________________________________|0.1%|2.38%
151.44|~36|||__x_o_______________________________________________|0.18%|2.3%
151.32|~48|||__x_o_______________________________________________|0.26%|2.22%
151.20|~6O|||__x_o_______________________________________________|0.34%|2.14%
151.08|~72|||____o_________________________x___x_________________|0.42%|2.05%
150.96|~84|||____o_________________________x_o_x_o_______________|0.5%|1.97%
150.84|~96|||____o_________________________x_o_x_o_x_____________|0.58%|1.89%
150.72|~1O8||____o_________________________x_o_x_o_x_o___________|0.66%|1.81%
150.60|~12O||____o_x_______________________x_o_x_o_x_o___________|0.74%|1.73%
150.48|~132||____o_x_o_____________x___x___x_o___o_x_o___________|0.82%|1.65%
150.36|~144||____o_x_o_____________x_o_x_o_x_____o___o___________|0.9%|1.57%
150.24|~156||____o_x_o_x___________x_o_x_o_x_________o___________|0.97%|1.49%
150.12|~168||____o___o_x_o_________x_o_x_o_x_________o___________|1.05%|1.41%
150.00|~18O||________o_x_o_________x_o_x_o_x_________o___________|1.13%|1.33%
149.88|~192||________o_x_o_________x_o_x_o_x_________o___________|1.21%|1.24%
149.76|~2O4||________o_x_o_________x_o_x_o_x_________o___________|1.29%|1.16%
149.64|~216||________o_x_o_________x_o___o___________o___________|1.37%|1.08%
149.52|~228||________o___o_________x_________________o___________|1.45%|1%
149.40|~24O||============o=========x=================o=x=======x=|1.53%|0.92%
149.28|~252||____________o_____x___x_________________o_x_o_____x_|1.61%|0.84%
149.16|~264||____________o_x___x_o_x_________________o_x_o_____x_|1.69%|0.76%
149.04|~276||____________o_x_o_x_o_x_________________o_x_o_x___x_|1.77%|0.68%
148.92|~288||____________o_x_o_x_o_x_________________o_x_o_x_o_x_|1.84%|0.6%
148.80|~3OO||____________o_x_o_x_o___________________o_x_o_x_o_x_|1.92%|0.51%
148.68|~312||____________o___o_______________________o___o_x_o_x_|2%|0.43%
148.56|~324||____________________________________________o_x_o___|2.08%|0.35%
148.44|~336||____________________________________________o_x_____|2.16%|0.27%
148.32|~348||____________________________________________o_x_____|2.24%|0.19%
148.20|~36O||____________________________________________o_x_____|2.32%|0.11%
148.08|~372||____________________________________________o_______|2.4%|0.03%
147.96|~384||____________________________________________________|2.48%|-0.05%
Column|~396||0_5_134_9_6_134_4_5_4_147_7_7_125_5_6_4_186_118_4_7_|
Count
http://iticsoftware.com/postimages/2009-Jun-19/gbpjpy210909.PNG
http://iticsoftware.com/postimages/2009-Jun-19/File%D0%97%D0%92%D0%90gbpjpy2109.pdf PDF
Posted by: MDunleavy Sep 25, 2009, 10:54 AM
GBP/JPY falls further to as low as 144.31 so far and at this point, intraday bias remains on the downside for deeper decline. The break of 146.75 support confirms a medium term reversal pattern and GBP/JPY should now be targeting 50% retracement of 118.81 to 163.05 at 140.93 next. On the upside, above 146.26 minor resistance will turn intraday outlook neutral and bring consolidation. But recovery should be limited below 150.35 resistance and bring fall resumption.[actionforex]
"P&F GBPJPY5 Box Size 20X3 or(0.41%) HI/LO
Data 150.354 - 144.325 ~ 0 Month ~ 7.25 Day
Database 1502 records 145.096 (Last Close)
2009-09-18 04~50
2009-09-25 10~55 (GMT+01:00) Paris
http://iticsoftware.com"
150.40|~2O|||______________________________|-0.03%|4.21%
150.20|~4O|||______________x_o_____________|0.1%|4.07%
150.00|~6O|||______________x_o_____________|0.24%|3.93%
149.80|~8O|||______________x_o_____________|0.37%|3.79%
149.60|~1OO||______________x_o_____________|0.5%|3.65%
149.40|~12O||o_x___x___x___x_o_____________|0.63%|3.52%
149.20|~14O||o_x_o_x_o_x_o_x_o_____________|0.77%|3.38%
149.00|~16O||o_x_o_x_o_x_o_x_o_____________|0.9%|3.24%
148.80|~18O||o_x_o_x_o_x_o_x_o_____________|1.03%|3.1%
148.60|~2OO||o___o_x_o___o_x_o_____________|1.17%|2.96%
148.40|~22O||____o_x_____o___o_____________|1.3%|2.82%
148.20|~24O||____o___________o_____________|1.43%|2.68%
148.00|~26O||________________o_____________|1.57%|2.55%
147.80|~28O||________________o_____________|1.7%|2.41%
147.60|~3OO||________________o_____________|1.83%|2.27%
147.40|~32O||________________o_____________|1.96%|2.13%
147.20|~34O||________________o_x___________|2.1%|1.99%
147.00|~36O||________________o_x_o_________|2.23%|1.85%
146.80|~38O||________________o_x_o_________|2.36%|1.71%
146.60|~4OO||________________o_x_o_________|2.5%|1.58%
146.40|~42O||________________o___o_________|2.63%|1.44%
146.20|~44O||____________________o_________|2.76%|1.3%
146.00|~46O||____________________o_________|2.9%|1.16%
145.80|~48O||____________________o_________|3.03%|1.02%
145.60|~5OO||____________________o_________|3.16%|0.88%
145.40|~52O||____________________o_____x___|3.29%|0.74%
145.20|~54O||____________________o_x___x_o_|3.43%|0.61%
145.00|~56O||____________________o_x_o_x_o_|3.56%|0.47%
144.80|~58O||____________________o_x_o_x_o_|3.69%|0.33%
144.60|~6OO||____________________o_x_o_x___|3.83%|0.19%
144.40|~62O||____________________o___o_____|3.96%|0.05%
144.20|~64O||______________________________|4.09%|-0.09%
Column|~66O||5_4_6_6_4_4_5_9_20_4_14_4_4_5_3_|
Count|~68O||5_4_6_6_4_4_5_9_20_4_14_4_4_5_3_|
http://iticsoftware.com/postimages/2009-Jul-01/GbpJpy250909.PNG
PDF
http://iticsoftware.com/postimages/2009-Jul-01/GBPJPYpdf250909.pdf
Posted by: MDunleavy Sep 30, 2009, 09:25 PM
Crude oil inventory rose +2.8 mmb, compared with consensus of +2 mmb increase, to 338.4 mmb in the week ended September 29. The good thing is Cushing stock recorded significant drop of -1.5 mmb.
Situation in oil product stockpiles was better than previously anticipated. Gasoline inventory drew -1.66 mmb while distillate inventory gained only +0.32 mmb. Both readings beat market expectations.
WTI crude oil price changes little after the report, only edging slightly higher to 67.5 from 66.5 before the release. Investors probably need to gauge the implications of a higher crude build with lower distillate build.
Heating oil bounces to 1.71 while RBOB gasoline rises to 1.65 after the report.
Lack of positive response from investors was also driven by disappointing US employment data and Chicago PMI. ADP reported -254K decline in employment in September following a -277K drop in the prior month. The market had expected a decline of only -195K. Chicago PMI slid to 46.1 in September after reaching the expansionary territory of 50 a month ago.[oilngold]
http://iticsoftware.com/postimages/2009-Jul-01/BrocoOil300909.PNG
http://iticsoftware.com/postimages/2009-Jul-01/PDFoilBroco30909.pdf
Posted by: MDunleavy Oct 7, 2009, 07:05 AM
Dollar Index Critical Area at 75.83
Daily chart trend: Long possibilities. Main price points: 75.83. Looking for: Wave V low
Prices on the dollar index chart were recently testing the upper resistance line of a trading channel, where a possible long break-out will confirm that wave V of a black C is done. However, this is not the case yet, and as such move into much deeper levels is still possible over the coming days, especially once the current 75.83 low is taken out. In this case, we will be looking for a new wave V target somewhere around 74.00 support zone.[actionforex]
"P&F _DXY60 Box Size 20X3 or(0.77%) CLOSE
Data 80.84 - 75.92 ~ 3 Month ~ 91.25 Day
Database 1500 records 76.4 (Last Close)
2009-07-08 01~00
2009-10-07 07~00 (GMT+01:00) Paris
http://iticsoftware.com"
80.80|~2O|||o_________________________________________________________|0.05%|6.43%
80.60|~4O|||o_________________________________________________________|0.3%|6.16%
80.40|~6O|||o_x_______________________________________________________|0.54%|5.9%
80.20|~8O|||o_x_o_____________________________________________________|0.79%|5.64%
80.00|~1OO||o_x_o_____________________________________________________|1.04%|5.37%
79.80|~12O||o___o_____________________________________________________|1.29%|5.11%
79.60|~14O||____o_____x_______________________________________________|1.53%|4.85%
79.40|~16O||____o_____x_o_____x_______________________________________|1.78%|4.58%
79.20|~18O||____o_____x_o_x___x_o_____________________________________|2.03%|4.32%
79.00|~2OO||____o_x___x_o_x_o_x_o_____________________________________|2.28%|4.06%
78.80|~22O||____o_x_o_x_o_x_o_x_o_x_______x___________________________|2.52%|3.79%
78.60|~24O||____o_x_o_x_o_x_o_x_o_x_o_____x_o_x_______________________|2.77%|3.53%
78.40|~26O||____o___o_x_o_x_o_x_o_x_o_x___x_o_x_o_____________________|3.02%|3.27%
78.20|~28O||________o___o_x_o___o_x_o_x_o_x_o_x_o_____________________|3.27%|3%
78.00|~3OO||____________o_x_____o_x_o_x_o_x_o___o_____________________|3.51%|2.74%
77.80|~32O||============o=x=====o===o===o=======o=====================|3.76%|2.48%
77.60|~34O||____________o_x_____________________o_____________________|4.01%|2.21%
77.40|~36O||____________o_______________________o_____________________|4.26%|1.95%
77.20|~38O||____________________________________o_____________x___x___|4.5%|1.69%
77.00|~4OO||____________________________________o_x___x___x___x_o_x_o_|4.75%|1.42%
76.80|~42O||____________________________________o_x_o_x_o_x_o_x_o_x_o_|5%|1.16%
76.60|~44O||____________________________________o_x_o_x_o_x_o_x_o_x_o_|5.24%|0.9%
76.40|~46O||____________________________________o___o_x_o_x_o___10__o_|5.49%|0.63%
76.20|~48O||________________________________________o_x_o_x_________o_|5.74%|0.37%
76.00|~5OO||========================================o===o=x=========o=|5.99%|0.11%
75.80|~52O||____________________________________________o_____________|6.23%|-0.16%
Column|~54O|6_3_103_4_7_119_5_6_8_5_5_3_3_5_4_3_113_5_5_6_6_3_4_4_4_6_|
Count
Posted by: MDunleavy Oct 20, 2009, 09:52 PM
Forex market volatility expectations have gained considerably through the past week
Posted by: MDunleavy Oct 21, 2009, 11:22 AM
"P&F _DXY 1 min Box Size 25X4 or(0.13%) CLOSE
Data 75.76 - 75.11 ~ 0 Month ~ 2.07 Day
Database 2093 records 75.38 (Last Close)
2009-10-19 08~33
2009-10-21 10~08 (GMT+01:00) Paris
http://iticsoftware.com chart"
75.75|~3||||==============================x===========|0.01%|0.85%
75.73|~6||||______________________________x_o_x_______|0.05%|0.82%
75.70|~9||||______________________________x_o_x_o_x___|0.08%|0.79%
75.68|~12|||______________________________x_o_x_o_x_o_|0.11%|0.75%
75.65|~15|||______________________________x_o_x_o_x_o_|0.15%|0.72%
75.63|~18|||__________x___________________x_o_x_o_x_o_|0.18%|0.69%
75.60|~21|||o_________x_o_________________x_o___o_x_o_|0.21%|0.65%
75.58|~24|||o_____x___x_o_________________x_____o_x_o_|0.24%|0.62%
75.55|~27|||o_____x_o_x_o_________________x_____o_x_o_|0.28%|0.59%
75.53|~3O|||o_____x_o_x_o_________________x_____o_x_o_|0.31%|0.55%
75.50|~33|||o_x___x_o_x_o_________________x_____o_x_o_|0.34%|0.52%
75.48|~36|||o=x=o=x=o===o=================x=====o===o=|0.38%|0.49%
75.45|~39|||o_x_o_x_____o_________________x_________o_|0.41%|0.45%
75.43|~42|||o_x_o_x_____o_________________x_________o_|0.44%|0.42%
75.40|~45|||o===o=======o=x===============x=========o=|0.48%|0.39%
75.38|~48|||____________o_x_o_x___________x_________o_|0.51%|0.35%
75.35|~51|||____________o_x_o_x_o_________x_________o_|0.54%|0.32%
75.33|~54|||____________o_x_o_x_o_________x_________o_|0.57%|0.29%
75.30|~57|||____________o_x_o_x_o_x_______x___________|0.61%|0.25%
75.28|~6O|||============o===o===o=x=o=x===x===========|0.64%|0.22%
75.25|~63|||____________________o_x_o_x_o_x___________|0.67%|0.19%
75.23|~66|||____________________o_x_o_x_o_x___________|0.71%|0.15%
75.20|~69|||____________________o_x_o_x_o_x___________|0.74%|0.12%
75.18|~72|||____________________o_x_o___o_x___________|0.77%|0.09%
75.15|~75|||____________________o_x_____o_x___________|0.81%|0.05%
75.13|~78|||____________________o_x_____o_____________|0.84%|0.02%
75.10|~81|||====================o=====================|0.87%|-0.01%
Column|~84||9_4_4_7_4_6_145_5_4_118_5_4_6_256_5_109_15|
Count
http://iticsoftware.com/postimages/2009-Aug-03/091021DXYMix.PNG
http://iticsoftware.com/postimages/2009-Aug-03/Excel_USD_Index.zip
"P&F _DXY1 Box Size 25X4 or(0.13%) CLOSE
Data 75.76 - 74.95 ~ 0 Month ~ 2.07 Day
Database 2106 records 74.99 (Last Close)
2009-10-19 18~01
2009-10-21 19~43 (GMT+01:00) Paris
BJF Trading Group"
75.78|~3||||________________________________________________|-0.02%|1.1%
75.75|~6||||________________x_______________________________|0.01%|1.07%
75.73|~9||||________________x_o_x___________________________|0.05%|1.03%
75.70|~12|||________________x_o_x_o_x_______________________|0.08%|1%
75.68|~15|||________________x_o_x_o_x_o_____________________|0.11%|0.97%
75.65|~18|||________________x_o_x_o_x_o_____________________|0.15%|0.93%
75.63|~21|||________________x_o_x_o_x_o_____________________|0.18%|0.9%
75.60|~24|||________________x_o___o_x_o_____________________|0.21%|0.87%
75.58|~27|||________________x_____o_x_o_____x_______________|0.24%|0.83%
75.55|~3O|||________________x_____o_x_o_____x_o_____________|0.28%|0.8%
75.53|~33|||________________x_____o_x_o_____x_o_____________|0.31%|0.77%
75.50|~36|||________________x_____o_x_o_x___x_o_____________|0.34%|0.73%
75.48|~39|||________________x_____o___o_x_o_x_o_____________|0.38%|0.7%
75.45|~42|||________________x_________o_x_o_x_o_____________|0.41%|0.67%
75.43|~45|||________________x_________o_x_o_x_o_____________|0.44%|0.63%
75.40|~48|||________________x_________o_x_o_x_o_____________|0.48%|0.6%
75.38|~51|||x_______________x_________o_x_o___o_____________|0.51%|0.57%
75.35|~54|||x_o_____________x_________o_x_____o_____________|0.54%|0.53%
75.33|~57|||x_o_____________x_________o_______o_____________|0.57%|0.5%
75.30|~6O|||x_o_x___________x_________________o_____________|0.61%|0.47%
75.28|~63|||__o_x_o_x_______x_________________o_____________|0.64%|0.43%
75.25|~66|||__o_x_o_x_o_____x_________________o_____________|0.67%|0.4%
75.23|~69|||__o_x_o_x_o_x___x_________________o_x___________|0.71%|0.37%
75.20|~72|||__o_x_o_x_o_x_o_x_________________o_x_o_________|0.74%|0.33%
75.18|~75|||__o_x_o___o_x_o_x_________________o_x_o_x_______|0.77%|0.3%
75.15|~78|||__o_x_____o_x_o_x_________________o_x_o_x_o_x___|0.81%|0.27%
75.13|~81|||__o_x_____o___o___________________o___o_x_o_x_o_|0.84%|0.23%
75.10|~84|||__o___________________________________o_x_o_x_o_|0.87%|0.2%
75.08|~87|||______________________________________o_x_o_x_o_|0.9%|0.17%
75.05|~9O|||======================================o===o===o=|0.94%|0.13%
75.03|~93|||______________________________________________o_|0.97%|0.1%
75.00|~96|||______________________________________________o_|1%|0.07%
74.98|~99|||______________________________________________o_|1.04%|0.03%
74.95|~1O2||______________________________________________o_|1.07%|0%
Column||||||4_1185_4_6_4_4_256_5_109_15_7_5_8_184_7_5_5_4_8_|
Count
Posted by: MDunleavy Oct 23, 2009, 06:40 PM
As noted before, while further rise to 100% projection of 1.4177 to 1.4842 from 1.4483 at
1.5148 cannot be ruled out, upside would likely be limited there and bring pull back. Below
1.4884 minor support will indicate that a short term top should at least be formed with bearish
divergence conditions in 4 hours MACD and RSI. Deeper decline should be seen to 1.4483 support
in this case.
In the bigger picture, the strong break of 1.4867 resistance argues that whole fall from 1.6039
has completed at 1.2329 already and rise from there is still in progress. At this point, there
is no sign of topping yet and the current rally could extend further for retesting 1.6039 high.
Nevertheless, as we're not seeing a clear impulsive structure in the current rally, we'd expect
upside to be limited there and bring another medium term fall to continue the wide range
consolidation from from 1.6039. On the downside, break of 1.4483 support will be the first sign
that rise from 1.2456 has completed. Further break of 1.3747 support will confirm and turn
focus back to 1.2329/2456 support zone.[actionforex]
"P&F EURUSD1440 Box Size 150X3 or(3.25%) HI/LO
Data 1.6038 - 1.1639 ~ 48 Month ~ 1477 Day
Database 1050 records 1.50189 (Last Close)
2005-10-07 00~00
2009-10-23 00~00 (GMT+01:00) Paris
http://iticsoftware.com"
1.6050|~15O||____________________________________________________________|-0.07%|37.9%
1.5900|~3OO||__________________x___x___x_________________________________|0.86%|36.61%
1.5750|~45O||__________________x_o_x_o_x_o_______________________________|1.8%|35.32%
1.5600|~6OO||__________________x_o_x_o_x_o_______________________________|2.73%|34.03%
1.5450|~75O||__________________x_o___o_x_o_______________________________|3.67%|32.74%
1.5300|~9OO||__________________x_____o___o_______________________________|4.6%|31.45%
1.5150|~1O5O|__________________x_________o_______________________________|5.54%|30.17%
1.5000|~12OO|__________________x_________o_____________________________x_|6.47%|28.88%
1.4850|~135O|==========x===x===x=========o=x===========================x=|7.41%|27.59%
1.4700|~15OO|__________x_o_x_o_x_________o_x_o_____________x___________x_|8.34%|26.3%
1.4550|~165O|__________x_o_x_o_x_________o_x_o_____________x_o_________x_|9.28%|25.01%
1.4400|~18OO|__________x_o___o___________o_x_o_____________x_o_________x_|10.21%|23.72%
1.4250|~195O|__________x_________________o_x_o_____________x_o_____x___x_|11.15%|22.43%
1.4100|~21OO|__________x_________________o_x_o_____________x_o_____x_o_x_|12.08%|21.14%
1.3950|~225O|__________x_________________o___o_____________x_o_____x_o_x_|13.02%|19.86%
1.3800|~24OO|__________x_____________________o_____________x_o_____x_o___|13.95%|18.57%
1.3650|~255O|__________x_____________________o_____________x_o_x___x_____|14.89%|17.28%
1.3500|~27OO|__________x_____________________o_____________x_o_x_o_x_____|15.82%|15.99%
1.3350|~285O|______x___x_____________________o_____________x_o_x_o_x_____|16.76%|14.7%
1.3200|~3OOO|______x_o_x_____________________o_x___________x_o_x_o_x_____|17.7%|13.41%
1.3050|~315O|______x_o_x_____________________o_x_o_x___x___x_o_x_o_x_____|18.63%|12.12%
1.2900|~33OO|______x_o_______________________o_x_o_x_o_x_o_x_o_x_o_______|19.57%|10.83%
1.2750|~345O|______x_________________________o_x_o_x_o_x_o_x_o_x_________|20.5%|9.55%
1.2600|~36OO|______x_________________________o_x_o___o_x_o___o___________|21.44%|8.26%
1.2450|~375O|______x_________________________o_______o___________________|22.37%|6.97%
1.2300|~39OO|__x___x_____________________________________________________|23.31%|5.68%
1.2150|~4O5O|__x_o_x_____________________________________________________|24.24%|4.39%
1.2000|~42OO|o_x_o_x_____________________________________________________|25.18%|3.1%
1.1850|~435O|o_x_o_______________________________________________________|26.11%|1.81%
1.1700|~45OO|o___________________________________________________________|27.05%|0.52%
1.1550|~465O|____________________________________________________________|27.98%|-0.76%
Column|~48OO|3_4_3_103_133_3_3_103_3_4_4_136_165_4_3_4_4_3_14147_5_9_3_8_|
Count
http://iticsoftware.com/postimages/2009-Aug-03/091023EurUsd.PNG
http://iticsoftware.com/postimages/2009-Aug-03/Excel_EurUsd_091023.zip
Posted by: MDunleavy Nov 5, 2009, 02:18 PM
Since April, the value of the U.S. dollar (USD) has steadily lost value against the Japanese yen (JPY). Across the Asia Pacific, the USD/JPY cross rate remains a key barometer of a two-way play of global economic fundamentals and risk aversion.
This barometer has experienced many high and low points in the last 26 months. In June 2007, the USD/JPY traded a five-year high of 124.16 to the USD. As far as the fundamentals were concerned, that five-year high was more about a weaker yen, than a stronger U.S. dollar. Over these 26 months, through better and worse, USD/JPY has declined as the yen has appreciated 25 percent against the U.S. dollar.
This 25 percent decline in USD/JPY is illustrated in Chart 1, with the initial change of trend signal appearing soon after the USD/JPY five-year high in June 2007. The red line over the price bars illustrate the MACD predictor (referred to as DiNapoliMP or
Posted by: MDunleavy Nov 14, 2009, 02:17 PM
Current development argues that a short term top is at least formed at 1123.4, with mild bearish divergence condition in 4 hours MACD, after Gold hits upper channel resistance. Intraday bias is now mildly on the downside for 4 hours 55 EMA (now at 1095.4 first. Sustained trading below will target a test on the lower channel support (now at 1053.2). On the upside, however, above 1123.4 again will indicate that recent rally is still in progress for 61.8% projection of 681 to 1007.7 from 931.3 at 1133.2.
In the bigger picture, the long term up trend in Gold is still in progress. Rise from 681 would likely develop into another set of five wave sequence with first wave completed at 1007.7, second wave triangle consolidation completed at 931.3. Rise from 931.3 is expected to extend to 61.8% projection of 681 to 1007.7 from 931.3 at 1133.2 first and then 100% projection at 1258 next. On the downside, break of 1026.9 support will suggest that a top is formed and bring consolidation. But we'll hold on to the bullish view as long as 931.3 key support holds.[oilngold]
"P&F GOLD30 Box Size500X3 or(1.42%) HI/LO
Data 1122.7 - 984.99 ~ 2 Month ~ 58.6 Day
Database 2028 records 1118.29 (Last Close)
2009-09-16 08~00
2009-11-13 22~30 (GMT+01:00) Paris
BJF Trading Group chart"
1120.00|~5OO||________________________________x_______|0.24%|13.71%
1115.00|~1OOO|____________________________x_o_x_o_x_o_|0.69%|13.2%
1110.00|~15OO|____________________________x___x_o_x___|1.13%|12.69%
1105.00|~2OOO|____________________________x_____o_____|1.58%|12.18%
1100.00|~25OO|____________________________x___________|2.02%|11.68%
1095.00|~3OOO|____________________________x___________|2.47%|11.17%
1090.00|~35OO|____________________________x___________|2.91%|10.66%
1085.00|~4OOO|____________________________x___________|3.36%|10.15%
1080.00|~45OO|____________________________x___________|3.8%|9.65%
1075.00|~5OOO|____________________________x___________|4.25%|9.14%
1070.00|~55OO|________________x___________x___________|4.69%|8.63%
1065.00|~6OOO|________________x_o_x___x___x___________|5.14%|8.12%
1060.00|~65OO|____________x___x_o_x_o_x_o_x___________|5.58%|7.62%
1055.00|~7OOO|____________x_o_x_o_x_o_x_o_x___________|6.03%|7.11%
1050.00|~75OO|____________x_o_x_o_x_o___o_x___________|6.48%|6.6%
1045.00|~8OOO|____________x_o___o_______o_x___________|6.92%|6.09%
1040.00|~85OO|____________x_____________o_x___________|7.37%|5.58%
1035.00|~9OOO|____________x_____________o_x___________|7.81%|5.08%
1030.00|~95OO|____________x_____________o_____________|8.26%|4.57%
1025.00|~1OOO|____________x___________________________|8.7%|4.06%
1020.00|~1O5O|x___________x___________________________|9.15%|3.55%
1015.00|~11OO|x_o_x_______x___________________________|9.59%|3.05%
1010.00|~115O|x_o_x_o_____x___________________________|10.04%|2.54%
1005.00|~12OO|__o_x_o_x___x___________________________|10.48%|2.03%
1000.00|~125O|__o___o_x_o_x___________________________|10.93%|1.52%
995.00|~13OO||______o_x_o_x___________________________|11.37%|1.02%
990.00|~135O||______o_x_o_____________________________|11.82%|0.51%
985.00|~14OO||______o_________________________________|12.27%|0%
980.00|~145O||________________________________________|12.71%|-0.51%
Column|~15OO||3_4_3_6_4_3_143_5_5_4_3_3_7_171_3_3_2_1_|
Count
=============================
http://iticsoftware.com/postimages/2009-Jul-01/BJF-Trading-Group-091114gold_h4.PNG
Posted by: MDunleavy Nov 16, 2009, 01:06 PM
The estimated test of key resistance range levels has been confirmed, but relative rise in buying activity, marked by OsMA trend indicator, did not favor immediate implementation of the pre-planned short positions. Nevertheless, in the bigger picture, considering close parity of both party activity while rate is contained within the borders of Ichimoku cloud, we can assume probability of rate range movement with attainment of close border of the cloud at 1,4980/1,5000 levels, where it is recommended to evaluate the development of the activity of both parties in accordance with the charts of a shorter time interval. As for short-term sales on condition of the formation of topping signals the targets will be 1,4920/40 and (or) further break-out variant up to 1,4860/80, 1,4800/20. The alternative for buyers will be above 1,5080 with the targets of 1,5120/40, 1,5180/1,5200, 1,5240/60.[actionforex]
"P&F EURUSD1440 Box Size 150X3 or(3.25%) HI/LO
Data 1.6038 - 1.1639 ~ 49 Month ~ 1477 Day
Database 1050 records 1.4974 (Last Close)
2005-10-31 00~00
2009-11-16 00~00 (GMT+01:00) Paris
http://iticsoftware.com chart"
1.6050|~15O||_____________________________|-0.07%|37.9%
1.5900|~3OO||________X_X_X________________|0.86%|36.61%
1.5750|~45O||________XoXoXo_______________|1.8%|35.32%
1.5600|~6OO||________XoXoXo_______________|2.73%|34.03%
1.5450|~75O||________Xo_oXo_______________|3.67%|32.74%
1.5300|~9OO||________X__o_o_______________|4.6%|31.45%
1.5150|~1O5O|________X____o_______________|5.54%|30.17%
1.5000|~12OO|________X____o______________X|6.47%|28.88%
1.4850|~135O|____X_X_X____oX_____________X|7.41%|27.59%
1.4700|~15OO|____XoXoX____oXo______X_____X|8.34%|26.3%
1.4550|~165O|____XoXoX____oXo______Xo____X|9.28%|25.01%
1.4400|~18OO|____Xo_o_____oXo______Xo____X|10.21%|23.72%
1.4250|~195O|____X________oXo______Xo__X_X|11.15%|22.43%
1.4100|~21OO|____X________oXo______Xo__XoX|12.08%|21.14%
1.3950|~225O|____X________o_o______Xo__XoX|13.02%|19.86%
1.3800|~24OO|____X__________o______Xo__Xo_|13.95%|18.57%
1.3650|~255O|____X__________o______XoX_X__|14.89%|17.28%
1.3500|~27OO|____X__________o______XoXoX__|15.82%|15.99%
1.3350|~285O|__X_X__________o______XoXoX__|16.76%|14.7%
1.3200|~3OOO|__XoX__________oX_____XoXoX__|17.7%|13.41%
1.3050|~315O|__XoX__________oXoX_X_XoXoX__|18.63%|12.12%
1.2900|~33OO|__Xo___________oXoXoXoXoXo___|19.57%|10.83%
1.2750|~345O|__X____________oXoXoXoXoX____|20.5%|9.55%
1.2600|~36OO|__X____________oXo_oXo_o_____|21.44%|8.26%
1.2450|~375O|__X____________o___o_________|22.37%|6.97%
1.2300|~39OO|X_X__________________________|23.31%|5.68%
1.2150|~4O5O|XoX__________________________|24.24%|4.39%
1.2000|~42OO|XoX__________________________|25.18%|3.1%
1.1850|~435O|Xo___________________________|26.11%|1.81%
1.1700|~45OO|_____________________________|27.05%|0.52%
1.1550|~465O|_____________________________|27.98%|-0.76%
Column|~48OO|43131333133441615434431175938|
Count|~495O||__O_3___O____3_6______44_____|
http://iticsoftware.com/postimages/2009-Jul-01/BJF-Trading-Group-091116_eurusd4H.PNG
http://iticsoftware.com/postimages/2009-Jul-01/BJF-Trading-Group-091116_eurusd4H.xls
Posted by: MDunleavy Nov 21, 2009, 11:59 PM
Dollar index's break of 75.76 resistance last week indicates that fall from 76.82 has completed and serves as the first indication that it has bottomed out. Focus is now on 76.82 resistance and a firm break there will affirm the bullish case by completing a double bottom reversal pattern (74.94, 74.68). Note again that such development will indicate that medium term fall from 89.62 has completed the five wave sequence already and will pave the way for strong rebound to 78.33/81.47 resistance zone at least. However, there is not confirmation of the bullish case yet. In particular, note that price actions in EUR/USD and USD/CHF are not convincingly supporting the case of reversal yet. Meanwhile, dollar index is now still limited well below 76.82. It's believed that developments in gold and US stocks will be crucial to whether dollar can finally reverse and stage a noticeable rebound.[actionforex]
"P&F _DY1440 Box Size 100X3 or(3.53%) HI/LO
Data 99.49 - 70.7 ~ 75 Month ~ 2290 Day
Database 1620 records 75.6 (Last Close)
2003-08-14 00~00
2009-11-20 00~00 (GMT+01:00) Paris
http://iticsoftware.com chart"
99.00|~1OO||x___________________________________________________|0.49%|40.03%
98.00|~2OO||x_o_________________________________________________|1.5%|38.61%
97.00|~3OO||__o_________________________________________________|2.5%|37.2%
96.00|~4OO||__o_________________________________________________|3.51%|35.79%
95.00|~5OO||__o_________________________________________________|4.51%|34.37%
94.00|~6OO||__o_________________________________________________|5.52%|32.96%
93.00|~7OO||__o_________________________________________________|6.52%|31.54%
92.00|~8OO||__o_____x___________x_______________________________|7.53%|30.13%
91.00|~9OO||__o_____x_o_________x_o_x___________________________|8.53%|28.71%
90.00|~1OOO|__o_____x_o_____x___x_o_x_o_________________________|9.54%|27.3%
89.00|~11OO|__o_____x_o_____x_o_x_o_x_o_________________x_______|10.54%|25.88%
88.00|~12OO|__o_x___x_o_____x_o_x_o___o_____________x___x_o_____|11.55%|24.47%
87.00|~13OO|__o_x_o_x_o_____x_o_x_____o_x_______x___x_o_x_o_____|12.55%|23.06%
86.00|~14OO|__o_x_o_x_o_____x_o_______o_x_o_____x_o_x_o_x_o_x___|13.56%|21.64%
85.00|~15OO|==o===o===o=x===x=========o=x=o=====x=o=x=o=x=o=x=o=|14.56%|20.23%
84.00|~16OO|__________o_x_o_x_________o___o_____x_o___o_x_o_x_o_|15.57%|18.81%
83.00|~17OO|__________o_x_o_x_____________o_____x_____o_x_o___o_|16.57%|17.4%
82.00|~18OO|__________o_x_o_______________o_____x_____o_x_____o_|17.58%|15.98%
81.00|~19OO|__________o___________________o_____x_____o_x_____o_|18.58%|14.57%
80.00|~2OOO|______________________________o_x___x_____o_x_____o_|19.59%|13.15%
79.00|~21OO|______________________________o_x_o_x_____o_x_____o_|20.6%|11.74%
78.00|~22OO|______________________________o_x_o_x_____o_______o_|21.6%|10.33%
77.00|~23OO|______________________________o_x_o_x_____________o_|22.61%|8.91%
76.00|~24OO|______________________________o_x_o_______________o_|23.61%|7.5%
75.00|~25OO|==============================o=x=================o=|24.62%|6.08%
74.00|~26OO|______________________________o_x___________________|25.62%|4.67%
73.00|~27OO|______________________________o_x___________________|26.63%|3.25%
72.00|~28OO|______________________________o_x___________________|27.63%|1.84%
71.00|~29OO|______________________________o_____________________|28.64%|0.42%
70.00|~3OOO|____________________________________________________|29.64%|-0.99%
Column||||||2_143_3_7_114_3_8_4_6_4_3_7_3_169_4_113_4_10116_3_11|
Count
http://iticsoftware.com/postimages/2009-Aug-03/BJF-Trading-Group-091121_dxyMix.PNG
http://iticsoftware.com/postimages/2009-Aug-03/BJF-Trading-Group-091121_dxyMix.xls
Posted by: MDunleavy Nov 24, 2009, 08:02 AM
My CCI study gave us a valid signal about upside correction yesterday. Price topped at 1.6647 but failed to stay above 1.6600 area so far, keep my bearish scenario intact with technical bearish target remains at 1.6400 and 1.6250 area. The bias is neutral in nearest term but I still prefer a bearish scenario. For me only movement above 1.6692 could be a serious threat to my bearish outlook. Immediate support at 1.6550. Break below that area should trigger further bearish momentum at least towards 1.6475 area. Initial resistance at 1.6647 (yesterday's high). Break above that area should trigger further bullish momentum testing 1.6692 and should be seen as potential threat to my bearish outlook. I will be watching any reaction around those levels before make any decision today[actionforex]
"P&F GBPUSD240 Box Size 10X3 or(1.93%) HI/LO
Data 1.7042 - 1.4109 ~ 8 Month ~ 244.83 Day
Database 1050 records 1.65859 (Last Close)
2009-03-24 08~00
2009-11-24 04~00 (GMT+01:00) Paris
http://iticsoftware.com chart"
1.7100|~1OO||____________________________|-0.34%|21.2%
1.7000|~2OO||______________X_____________|0.25%|20.49%
1.6900|~3OO||______________Xo____________|0.83%|19.78%
1.6800|~4OO||______________Xo__________X_|1.42%|19.07%
1.6700|~5OO||____________X_Xo__X_______Xo|2.01%|18.36%
1.6600|~6OO||______X_X_X_XoXoX_Xo__X_X_Xo|2.59%|17.66%
1.6500|~7OO||______XoXoXoXoXoXoXo__XoXoXo|3.18%|16.95%
1.6400|~8OO||______XoXoXoXoXoXoXo__XoXoX_|3.77%|16.24%
1.6300|~9OO||______XoXoXo_oXo_oXo__Xo_o__|4.35%|15.53%
1.6200|~1OOO|______XoXo___oX__o_o__X_____|4.94%|14.82%
1.6100|~11OO|______XoX____oX____oX_X_____|5.53%|14.11%
1.6000|~12OO|______XoX____o_____oXoX_____|6.11%|13.4%
1.5900|~13OO|______Xo___________oXoX_____|6.7%|12.69%
1.5800|~14OO|______X____________o_o______|7.29%|11.99%
1.5700|~15OO|______X_____________________|7.87%|11.28%
1.5600|~16OO|______X_____________________|8.46%|10.57%
1.5500|~17OO|______X_____________________|9.05%|9.86%
1.5400|~18OO|______X_____________________|9.64%|9.15%
1.5300|~19OO|______X_____________________|10.22%|8.44%
1.5200|~2OOO|______X_____________________|10.81%|7.73%
1.5100|~21OO|______X_____________________|11.4%|7.02%
1.5000|~22OO|____X_X_____________________|11.98%|6.32%
1.4900|~23OO|__X_XoX_____________________|12.57%|5.61%
1.4800|~24OO|__XoXoX_____________________|13.16%|4.9%
1.4700|~25OO|X_XoXoX_____________________|13.74%|4.19%
1.4600|~26OO|XoXo_oX_____________________|14.33%|3.48%
1.4500|~27OO|_oX__oX_____________________|14.92%|2.77%
1.4400|~28OO|_oX__o______________________|15.5%|2.06%
1.4300|~29OO|_oX_________________________|16.09%|1.35%
1.4200|~3OOO|_o__________________________|16.68%|0.64%
1.4100|~31OO|____________________________|17.26%|-0.06%
Column|~32OO|2573462774434717345933833353|
Count|~33OO|______2_______O_____________|
http://iticsoftware.com/postimages/2009-Jul-01/BJF-Trading-Group-091124_usdgbp1h.PNG
http://iticsoftware.com/postimages/2009-Jul-01/BJF-Trading-Group-091124_gbpusd1h.xls
Posted by: MDunleavy Nov 26, 2009, 08:58 AM
Intraday bias in EUR/CHF remains neutral for the moment. But still with 1.5102 support intact, we're favoring the bullish case that choppy fall from 1.5238 has completed at 1.5080 already. Above 1.5145 will bring rise resumption to 1.5238 resistance first. Nevertheless, break of 1.5102 minor support will dampen this immediate bullish view and indicate that another fall could still be seen to 1.5076 and below before concluding recent consolidations.
In the bigger picture, firstly, price actions from 1.5446 are treated as consolidation to rise from 1.4577 only and such rise is expected to resume sooner or later to test 1.5880 resistance. Secondly, the corrective structure of the fall from 1.5880 to 1.4577 indicates that it's a correction to medium term rise from 1.4315. Rise from 1.4577 is tentatively treated as resumption of rally from 1.4315. Hence we're expecting an eventual break of 1.5880 as rise from 1.4315 resumes. In other words, we're favoring the case that long term down trend from 1.6826 has completed at 1.4315 already. We'll hold on to this bullish view as long as 1.5007 support remains intact.[actionforex]
"P&F EURCHF1440 Box Size 80X4 or(2.06%) HI/LO
Data 1.6827 - 1.4315 ~ 48 Month ~ 1477 Day
Database 1050 records 1.50417 (Last Close)
2005-11-10 00~00
2009-11-26 00~00 (GMT+01:00) Paris
http://iticsoftware.com chart"
1.6800|~8O|||____X___________________________|0.16%|17.36%
1.6720|~16O||____XoX_________________________|0.64%|16.8%
1.6640|~24O||__X_XoXo________________________|1.11%|16.24%
1.6560|~32O||__XoXoXo________________________|1.59%|15.68%
1.6480|~4OO||__XoXoXo________________________|2.06%|15.12%
1.6400|~48O||__XoXoXo________________________|2.54%|14.57%
1.6320|~56O||__XoXo_o__X_X___________________|3.01%|14.01%
1.6240|~64O||__Xo___o__XoXo__________________|3.49%|13.45%
1.6160|~72O||__X____oX_XoXo__________________|3.96%|12.89%
1.6080|~8OO||__X____oXoXoXo__________________|4.44%|12.33%
1.6000|~88O||__X____oXoXo_o__________________|4.91%|11.77%
1.5920|~96O||__X____oXoX__o__________________|5.39%|11.21%
1.5840|~1O4O|X_X____o_oX__o________X_________|5.87%|10.65%
1.5760|~112O|XoX______oX__o________Xo________|6.34%|10.09%
1.5680|~12OO|XoX______oX__o________Xo________|6.82%|9.54%
1.5600|~128O|XoX______oX__o________Xo________|7.29%|8.98%
1.5520|~136O|Xo_______oX__oX_____X_Xo________|7.77%|8.42%
1.5440|~144O|X________oX__oXo____XoXo____X___|8.24%|7.86%
1.5360|~152O|_________o___oXo____XoXo____XoX_|8.72%|7.3%
1.5280|~16OO|_____________oXo____XoXo____XoXo|9.19%|6.74%
1.5200|~168O|_____________oXo____Xo_o____XoXo|9.67%|6.18%
1.5120|~176O|_____________o_o__X_X__oX_X_XoXo|10.14%|5.62%
1.5040|~184O|_______________o__XoX__oXoXoXo_o|10.62%|5.06%
1.4960|~192O|_______________o__XoX__oXoXoX___|11.1%|4.51%
1.4880|~2OOO|_______________oX_XoX__oXoXoX___|11.57%|3.95%
1.4800|~2O8O|_______________oXoXoX__o_oXoX___|12.05%|3.39%
1.4720|~216O|_______________oXoXo_____o_oX___|12.52%|2.83%
1.4640|~224O|_______________oXoX________o____|13%|2.27%
1.4560|~232O|_______________oXo______________|13.47%|1.71%
1.4480|~24OO|_______________oX_______________|13.95%|1.15%
1.4400|~248O|_______________oX_______________|14.42%|0.59%
1.4320|~256O|_______________o________________|14.9%|0.03%
1.4240|~264O|________________________________|15.37%|-0.52%
Column|~272O|64157651411441517475148145561544|
Count|~28OO||__4____1_O2__5_5____O__3____O___|
http://iticsoftware.com/postimages/2009-Jul-01/BJF-Trading-Group-091126_eurchfMix.PNG
http://iticsoftware.com/postimages/2009-Jul-01/BJF-Trading-Group-091126_eurchfMix.xls
Posted by: Jeminy Rider Nov 27, 2009, 06:04 AM

"P&F GBPUSD240 Box Size 10X3 or(1.93%) HI/LO
Data 1.7042 - 1.4109 ~ 8 Month ~ 244.83 Day
Database 1050 records 1.65859 (Last Close)
2009-03-24 08~00
2009-11-24 04~00 (GMT+01:00) Paris
http://iticsoftware.com chart"
1.7100|~1OO||____________________________|-0.34%|21.2%
1.7000|~2OO||______________X_____________|0.25%|20.49%
1.6900|~3OO||______________Xo____________|0.83%|19.78%
1.6800|~4OO||______________Xo__________X_|1.42%|19.07%
1.6700|~5OO||____________X_Xo__X_______Xo|2.01%|18.36%
1.6600|~6OO||______X_X_X_XoXoX_Xo__X_X_Xo|2.59%|17.66%
1.6500|~7OO||______XoXoXoXoXoXoXo__XoXoXo|3.18%|16.95%
1.6400|~8OO||______XoXoXoXoXoXoXo__XoXoX_|3.77%|16.24%
1.6300|~9OO||______XoXoXo_oXo_oXo__Xo_o__|4.35%|15.53%
1.6200|~1OOO|______XoXo___oX__o_o__X_____|4.94%|14.82%
1.6100|~11OO|______XoX____oX____oX_X_____|5.53%|14.11%
1.6000|~12OO|______XoX____o_____oXoX_____|6.11%|13.4%
1.5900|~13OO|______Xo___________oXoX_____|6.7%|12.69%
1.5800|~14OO|______X____________o_o______|7.29%|11.99%
1.5700|~15OO|______X_____________________|7.87%|11.28%
1.5600|~16OO|______X_____________________|8.46%|10.57%
1.5500|~17OO|______X_____________________|9.05%|9.86%
1.5400|~18OO|______X_____________________|9.64%|9.15%
1.5300|~19OO|______X_____________________|10.22%|8.44%
1.5200|~2OOO|______X_____________________|10.81%|7.73%
1.5100|~21OO|______X_____________________|11.4%|7.02%
1.5000|~22OO|____X_X_____________________|11.98%|6.32%
1.4900|~23OO|__X_XoX_____________________|12.57%|5.61%
1.4800|~24OO|__XoXoX_____________________|13.16%|4.9%
1.4700|~25OO|X_XoXoX_____________________|13.74%|4.19%
1.4600|~26OO|XoXo_oX_____________________|14.33%|3.48%
1.4500|~27OO|_oX__oX_____________________|14.92%|2.77%
1.4400|~28OO|_oX__o______________________|15.5%|2.06%
1.4300|~29OO|_oX_________________________|16.09%|1.35%
1.4200|~3OOO|_o__________________________|16.68%|0.64%
1.4100|~31OO|____________________________|17.26%|-0.06%
Column|~32OO|2573462774434717345933833353|
Count|~33OO|______2_______O_____________|
http://iticsoftware.com/postimages/2009-Jul-01/BJF-Trading-Group-091124_usdgbp1h.PNG
http://iticsoftware.com/postimages/2009-Jul-01/BJF-Trading-Group-091124_gbpusd1h.xls
Really, I am very appreciate on your forex information. Thank you.
Posted by: Steven Jack Nov 27, 2009, 10:18 AM
Really, you are giving a good information. I have getting some good tips and ideas.
Posted by: MDunleavy Nov 28, 2009, 05:15 PM
Not being able to maintain a bid-tone approaching 0.7400 - NZD is weakening again. Important support is formed by the .7200 handle but I wouldn't bet too much on how strong it will be in case of a re-test. It is worth watching it, though, as a break down may provide a good selling point - objectives into the 0.6900 - 0.7000 zone.
"P&F NZDUSD240 Box Size 90X3 or(4.31%) HI/LO
Data 0.7633 - 0.489 ~ 15 Month ~ 470.33 Day
Database 2000 records 0.71078 (Last Close)
2008-08-14 12~00
2009-11-27 20~00 (GMT+01:00) Paris
http://iticsoftware.com chart"
0.7650|~9O|||_________________________________|-0.22%|56.44%
0.7560|~18O||_____________________________Xo__|0.96%|54.6%
0.7470|~27O||_____________________________XoX_|2.14%|52.76%
0.7380|~36O||_____________________________XoXo|3.31%|50.92%
0.7290|~45O||_____________________________XoXo|4.49%|49.08%
0.7200|~54O||_X___________________________XoXo|5.67%|47.24%
0.7110|~63O||oXo__________________________Xo_o|6.85%|45.4%
0.7020|~72O||_Xo__________________________X___|8.03%|43.56%
0.6930|~81O||__oX_________________________X___|9.21%|41.72%
0.6840|~9OO||__oXo________________________X___|10.39%|39.88%
0.6750|~99O||__oXo________________________X___|11.57%|38.04%
0.6660|~1O8O|__oXo________________________X___|12.75%|36.2%
0.6570|~117O|__oXo____________________X___X___|13.93%|34.36%
0.6480|~126O|__o_o____________________XoX_X___|15.11%|32.52%
0.6390|~135O|____o____________________XoXoX___|16.28%|30.67%
0.6300|~144O|____o__X_________________XoXoX___|17.46%|28.83%
0.6210|~153O|____oX_XoX_______________Xo_o____|18.64%|26.99%
0.6120|~162O|____oXoXoXoX___________X_X_______|19.82%|25.15%
0.6030|~171O|____oXoXoXoXo__X_______XoX_______|21%|23.31%
0.5940|~18OO|____oXo_o_oXo__XoX___X_XoX_______|22.18%|21.47%
0.5850|~189O|____o_____oXo__XoXo__XoXo________|23.36%|19.63%
0.5760|~198O|__________oXo__XoXo__XoX_________|24.54%|17.79%
0.5670|~2O7O|__________oXo__Xo_o__XoX_________|25.72%|15.95%
0.5580|~216O|__________oXoX_X__o__XoX_________|26.9%|14.11%
0.5490|~225O|__________oXoXoX__o__Xo__________|28.08%|12.27%
0.5400|~234O|__________o_oXoX__oX_X___________|29.25%|10.43%
0.5310|~243O|____________oXoX__oXoX___________|30.43%|8.59%
0.5220|~252O|____________o_o___oXoX___________|31.61%|6.75%
0.5130|~261O|__________________oXoX___________|32.79%|4.91%
0.5040|~27OO|__________________o_oX___________|33.97%|3.07%
0.4950|~279O|____________________o____________|35.15%|1.23%
0.4860|~288O|_________________________________|36.33%|-0.61%
Column|~297O|138514344398144943145157384331644|
Count|~3O6O||____2_______O_____O__1_______5___|
http://iticsoftware.com/postimages/2009-Aug-03/BJF-Trading-Group-091128_NZDUSD_30min.PNG
http://iticsoftware.com/postimages/2009-Aug-03/BJF-Trading-Group-091128_NZDUSD_30min.xls
Posted by: MDunleavy Dec 2, 2009, 07:26 PM
USD/CAD Daily Outlook
Intraday bias in USD/CAD remains on the downside with 1.0532 minor resistance intact. Correction from 1.0851 is still in progress for 100% projection of 1.0851 to 1.0416 from 1.0748 at 1.0313. But downside should be contained above 1.0205 low to conclude the correction. On the upside, above 1.0532 will turn intraday bias neutral first and turn focus back to 1.0748 resistance instead.[actionforex]
"P&F USDCAD1440 Box Size 225X3 or(5.38%) HI/LO
Data 1.6054 - 0.9056 ~ 91 Month ~ 2772 Day
Database 1974 records 1.05026 (Last Close)
2002-05-01 00~00
2009-12-02 00~00 (GMT+01:00) Paris
http://iticsoftware.com chart"
1.6200|~225||________________________________________|-0.91%|78.89%
1.5975|~45O||x_______________________________________|0.49%|76.4%
1.5750|~675||x_o_____________________________________|1.89%|73.92%
1.5525|~9OO||x_o_____________________________________|3.3%|71.43%
1.5300|~1125|x_o_____________________________________|4.7%|68.95%
1.5075|~135O|__o_____________________________________|6.1%|66.46%
1.4850|~1575|__o_____________________________________|7.5%|63.98%
1.4625|~18OO|__o_____________________________________|8.9%|61.5%
1.4400|~2O25|__o_____________________________________|10.3%|59.01%
1.4175|~225O|__o_x___________________________________|11.7%|56.53%
1.3950|~2475|__o_x_o_x_______________________________|13.11%|54.04%
1.3725|~27OO|__o_x_o_x_o_____________________________|14.51%|51.56%
1.3500|~2925|__o___o_x_o_____________________________|15.91%|49.07%
1.3275|~315O|______o_x_o_____________________________|17.31%|46.59%
1.3050|~3375|______o_x_o_____________________x_______|18.71%|44.1%
1.2825|~36OO|______o___o_________x___x___x___x_o_____|20.11%|41.62%
1.2600|~3825|__________o_x_______x_o_x_o_x_o_x_o_____|21.51%|39.13%
1.2375|~4O5O|__________o_x_o_____x_o_x_o_x_o_x_o_____|22.92%|36.65%
1.2150|~4275|__________o_x_o_____x_o_x_o___o_x_o_____|24.32%|34.17%
1.1925|~45OO|__________o___o_____x_o_x_____o___o_____|25.72%|31.68%
1.1700|~4725|______________o_x___x_o_x_________o_x___|27.12%|29.2%
1.1475|~495O|______________o_x_o_x_o___________o_x_o_|28.52%|26.71%
1.1250|~5175|______________o_x_o_x_____________o_x_o_|29.92%|24.23%
1.1025|~54OO|______________o___o_x_____________o_x_o_|31.33%|21.74%
1.0800|~5625|__________________o_x_____________o___o_|32.73%|19.26%
1.0575|~585O|__________________o_x_________________o_|34.13%|16.77%
1.0350|~6O75|__________________o_x_________________o_|35.53%|14.29%
1.0125|~63OO|__________________o_x___________________|36.93%|11.8%
0.9900|~6525|__________________o_x___________________|38.33%|9.32%
0.9675|~675O|__________________o_x___________________|39.73%|6.84%
0.9450|~6975|__________________o_x___________________|41.14%|4.35%
0.9225|~72OO|__________________o_____________________|42.54%|1.87%
0.9000|~7425|________________________________________|43.94%|-0.62%
Column|~765O|4_113_6_5_9_3_7_3_11166_6_3_3_4_5_104_6_|
Count
http://iticsoftware.com/postimages/2009-Aug-03/BJF-Trading-Group-USDCAD_H4and30min.PNG
http://iticsoftware.com/postimages/2009-Aug-03/BJF-Trading-Group-USDCAD_H4and30min.xls
Posted by: MDunleavy Dec 11, 2009, 07:00 AM
The Support at 0.9100 mentioned earlier held during the day and Aussie is continuing to trade higher. We may expect a test of the Resistance at 0.9200. As mentioned earlier a break above 0.9200 might see a rise towards 0.9280-0.9300. As the pair is looking strong on its upmove, we expect the Support at 0.9100 to hold in the US session also. However, a break below 0.9100 might pull it down towards 0.9020-00. Overall we expect it to trade in the range of 0.9000-0.9300 for some time.[actionforex]
"P&F AUDUSD1440 Box Size 150X3 or(5.97%) HI/LO
Data 0.9849 - 0.5228 ~ 92 Month ~ 2808 Day
Database 2000 records 0.91427 (Last Close)
2002-04-03 00~00
2009-12-10 00~00 (GMT+01:00) Paris
http://iticsoftware.com chart"
0.9750|~15O||__________________________________|1.01%|86.5%
0.9600|~3OO||_______________Xo_________________|2.53%|83.63%
0.9450|~45O||_____________X_Xo_________________|4.05%|80.76%
0.9300|~6OO||___________X_XoXo________________X|5.57%|77.89%
0.9150|~75O||___________XoXoXo________________X|7.1%|75.02%
0.9000|~9OO||___________XoXo_o________________X|8.62%|72.15%
0.8850|~1O5O|_________X_XoX__o________________X|10.14%|69.28%
0.8700|~12OO|_________XoXoX__o________________X|11.67%|66.41%
0.8550|~135O|_________XoXo___o________________X|13.19%|63.54%
0.8400|~15OO|_________XoX____oX_______________X|14.71%|60.67%
0.8250|~165O|_________XoX____oXo____________X_X|16.24%|57.8%
0.8100|~18OO|_________XoX____oXo____________XoX|17.76%|54.93%
0.7950|~195O|___X___X_XoX____o_o____________XoX|19.28%|52.07%
0.7800|~21OO|___Xo__XoXo_______o____________Xo_|20.8%|49.2%
0.7650|~225O|___Xo__XoX________o____________X__|22.33%|46.33%
0.7500|~24OO|___Xo__XoX________o____________X__|23.85%|43.46%
0.7350|~255O|___XoX_XoX________o____________X__|25.37%|40.59%
0.7200|~27OO|___XoXoXoX________o__X_____X___X__|26.9%|37.72%
0.7050|~285O|___XoXoXo_________oX_XoX___Xo__X__|28.42%|34.85%
0.6900|~3OOO|___Xo_o___________oXoXoXoX_Xo__X__|29.94%|31.98%
0.6750|~315O|___X______________oXoXoXoXoXoX_X__|31.47%|29.11%
0.6600|~33OO|___X______________oXoXo_oXoXoXoX__|32.99%|26.24%
0.6450|~345O|___X______________o_o___oXoXoXoX__|34.51%|23.37%
0.6300|~36OO|___X____________________oXoXo_o___|36.03%|20.5%
0.6150|~375O|___X____________________o_o_______|37.56%|17.64%
0.6000|~39OO|___X______________________________|39.08%|14.77%
0.5850|~4O5O|___X______________________________|40.6%|11.9%
0.5700|~42OO|_X_X______________________________|42.13%|9.03%
0.5550|~435O|_XoX______________________________|43.65%|6.16%
0.5400|~45OO|oXoX______________________________|45.17%|3.29%
0.5250|~465O|__o_______________________________|46.7%|0.42%
Column|||||||1331733761715634131445436557633131|
Count||||||||___8_____2_O____2_3____________3_O|
http://iticsoftware.com/postimages/2009-Jul-01/BJF-Trading-Group-AUDUSD_h430min_091210.PNG
http://iticsoftware.com/postimages/2009-Jul-01/BJF-Trading-Group-AUDUSD_h430min_091210.xls
Posted by: MDunleavy Dec 12, 2009, 09:38 AM
Although the single currency rebounded strongly from 126.95 to 134.54, the sharp retreat from there to 128.78 suggests further choppy consolidation would take place and as long as 128.78 holds, mild upside bias is seen for another bounce to 132.34 (61.8% Fibonacci retracement of 134.54 to 128.78) but break of 134.54 resistance is needed to add credence to our recent preferred count that the wave 2 from 139.26 was a triple threes. This abc-x-abc-x-abc is labeled as: first set of a-b-c ended at 127.00, then x wave at 138.72, followed by second set of a-b-c at 129.02, then another x wave at 138.49 with the third set of a-b-c marked as: a-131.01, b-135.75 and the c leg as well as entire wave 2 ended at 126.95.
Our preferred count remains that the upmove from 112.08 is wave 1 of C has ended at 139.26 with minor wave iii ended at 137.42, followed by triangle wave iv at 126.98, then the move from there to 127.00 is wave 2 with the latest break-down indicated above and consolidation with upside bias remains for another test of 134.54 and possibly to 135.00. Looking ahead, only breach of 135.76-136.00 resistance area would add credence to this count and signal wave 2 has indeed ended at 126.95, then headway to 137.00 and later test of resistance at 138.49 would follow.[actionforex]
"P&F EURJPY240 Box Size 160X4 or(4.68%) HI/LO
Data 161.65 - 112.072 ~ 16 Month ~ 470.33 Day
Database 2000 records 130.378 (Last Close)
2008-08-28 12~00
2009-12-11 20~00 (GMT+01:00) Paris
http://iticsoftware.com chart"
161.60|~16O||____________________________|0.03%|44.19%
160.00|~32O||o___________________________|1.02%|42.77%
158.40|~48O||o___________________________|2.01%|41.34%
156.80|~64O||oX__________________________|3%|39.91%
155.20|~8OO||oXo_________________________|3.99%|38.48%
153.60|~96O||oXo_________________________|4.98%|37.05%
152.00|~112O|oXo_________________________|5.97%|35.63%
150.40|~128O|oXo_________________________|6.96%|34.2%
148.80|~144O|oXo_________________________|7.95%|32.77%
147.20|~16OO|o_o_________________________|8.94%|31.34%
145.60|~176O|__o_________________________|9.93%|29.92%
144.00|~192O|__o_________________________|10.92%|28.49%
142.40|~2O8O|__o_________________________|11.91%|27.06%
140.80|~224O|__oX________________________|12.9%|25.63%
139.20|~24OO|==oXo================X======|13.89%|24.21%
137.60|~256O|__oXo________________XoX_X__|14.88%|22.78%
136.00|~272O|__oXo____________X___XoXoXo_|15.87%|21.35%
134.40|~288O|__oXo__________X_XoX_XoXoXoX|16.86%|19.92%
132.80|~3O4O|__o_o__________XoXoXoXoXoXoX|17.85%|18.5%
131.20|~32OO|____o__________XoXoXoXoXoXoX|18.84%|17.07%
129.60|~336O|____oX_X_____X_XoXoXoXoXo_oX|19.83%|15.64%
128.00|~352O|====oXoXo====XoXoXoXo=o===o=|20.82%|14.21%
126.40|~368O|____oXoXo____XoXo_oX________|21.81%|12.78%
124.80|~384O|____oXoXoX_X_XoX__o_________|22.8%|11.36%
123.20|~4OOO|____oXo_oXoXoXoX____________|23.79%|9.93%
121.60|~416O|____oX__oXoXoXoX____________|24.78%|8.5%
120.00|~432O|____oX__oXoXoXoX____________|25.77%|7.07%
118.40|~448O|____oX__o_oXoXoX____________|26.76%|5.65%
116.80|~464O|____oX____o_o_oX____________|27.75%|4.22%
115.20|~48OO|____o_________oX____________|28.73%|2.79%
113.60|~496O|______________o_____________|29.72%|1.36%
112.00|~512O|____________________________|30.71%|-0.06%
Column|~528O|9615194474555811567647765564|
Count|~544O||__5_6_________O3____________|
http://iticsoftware.com/postimages/2009-Jun-19/BJF-Trading-Group-EURJPY_4h30min_91211.PNG
http://iticsoftware.com/postimages/2009-Jun-19/BJF-Trading-Group-EURJPY_4h30min_91211.xls
Posted by: MDunleavy Dec 13, 2009, 06:49 PM
European debt concerns will subside, eventually
The past week started off with a Fitch ratings downgrade of Greece followed by S&P moving Spain's credit outlook to negative, though its ratings were affirmed. The moves rattled investors' nerves and weighed on the EUR and other European currencies. The financial media filed the obligatory 'risk of a sovereign debt default' and the 'euro could come undone' stories, adding to concerns on Europe. However, we think the ratings moves are simply a short-term blow to sentiment which dovetailed nicely with the Euro cresting at the beginning of December. There is little immediate concern of a debt default as seen in Greek government debt yields, which while about 2% higher than German yields, are not in panic territory at about 5.2%. Indeed, should the worst come to pass it would likely only be later next year and lead to a rescue package from the IMF or the EU. European leaders were consistent in admonishing the most deficit-heavy countries to address budget issues urgently, and leaders of those nations' seemed to get the message, but they also indicated that they would mutually address any terminal credit crisis. As for the fate of the EUR, there is zero chance of EMU coming undone or Greece being thrown overboard, given treaty obligations. In that sense, the impact on the EUR is largely psychological, but that doesn't mean it can't weigh on the common currency further, which is why we also see scope for further EUR weakness ahead. We think fears may begin to subside in the New Year as investors conclude the risks are overblown and assets get put back to work in the new calendar year.[Written by Forex.com]
EUR Index
"P&F EUR_Day_MIX Box Size 48X3 or(1.44%) CLOSE
Data 107.357 - 92.9315 ~ 49 Month ~ 1477 Day
Database 1050 records 100 (Last Close)
2005-11-25 00~00
2009-12-11 00~00 (GMT+01:00) Paris
http://iticsoftware.com chart"
107.52|~48||______________________________________________________|-0.15%|15.7%
107.04|~96||______________________________x___x___________________|0.3%|15.18%
106.56|~144|______________________________x_o_x_o_________________|0.74%|14.67%
106.08|~192|______________________________x_o_x_o_________________|1.19%|14.15%
105.60|~24O|______________________________x_o___o_________________|1.64%|13.63%
105.12|~288|______________________________x_____o_________________|2.08%|13.12%
104.64|~336|______________________________x_____o_________________|2.53%|12.6%
104.16|~384|______________________________x_____o_x_______________|2.98%|12.08%
103.68|~432|______________________________x_____o_x_o_____________|3.43%|11.57%
103.20|~48O|______________x_______________x_____o_x_o_____________|3.87%|11.05%
102.72|~528|__________x___x_o_____________x_____o_x_o_____________|4.32%|10.53%
102.24|~576|__________x_o_x_o_____________x_____o_x_o_x___x_______|4.77%|10.02%
101.76|~624|__________x_o_x_o_____x___x___x_____o_x_o_x_o_x_o_____|5.21%|9.5%
101.28|~672|__________x_o_x_o_x___x_o_x_o_x_____o_x_o_x_o_x_o_x___|5.66%|8.98%
100.80|~72O|__________x_o___o_x_o_x_o_x_o_x_____o_x_o_x_o___o_x_o_|6.11%|8.47%
100.32|~768|______x___x_____o_x_o_x_o_x_o_x_____o_x_o_______o_x_o_|6.55%|7.95%
99.84|~816||______x_o_x_____o___o_x_o_x_o_______o___________o___o_|7%|7.43%
99.36|~864||______x_o_x_________o_x_o_x___________________________|7.45%|6.92%
98.88|~912||______x_o_x_________o___o_x___________________________|7.9%|6.4%
98.40|~96O||__x___x_o_______________o_x___________________________|8.34%|5.88%
97.92|~1OO8|__x_o_x_________________o_x___________________________|8.79%|5.37%
97.44|~1O56|__x_o_x_________________o_____________________________|9.24%|4.85%
96.96|~11O4|__x_o_________________________________________________|9.68%|4.33%
96.48|~1152|__x___________________________________________________|10.13%|3.82%
96.00|~12OO|__x___________________________________________________|10.58%|3.3%
95.52|~1248|__x___________________________________________________|11.03%|2.79%
95.04|~1296|__x___________________________________________________|11.47%|2.27%
94.56|~1344|__x___________________________________________________|11.92%|1.75%
94.08|~1392|__x___________________________________________________|12.37%|1.24%
93.60|~144O|o_x___________________________________________________|12.81%|0.72%
93.12|~1488|o_x___________________________________________________|13.26%|0.2%
92.64|~1536|o_____________________________________________________|13.71%|-0.31%
Column||||||3_123_7_4_9_4_5_7_3_5_6_9_9_4_153_3_159_8_4_3_3_5_3_3_|
Count
http://iticsoftware.com/postimages/2009-Aug-03/BJF-Trading-Group-EurIndex_091212.PNG
http://iticsoftware.com/postimages/2009-Aug-03/BJF-Trading-Group-EurIndex_091212.xls
Posted by: MDunleavy Dec 16, 2009, 03:16 PM
Intraday bias in GBP/USD remains neutral for the moment as sideway trading from 1.6166 continues. Another rise cannot be ruled out but still, upside is expected to be limited well below 1.6515 resistance and bring fall resumption. Below 1.6166 will indicate that whole fall from 1.6875 has resumed and should target a retest of 1.5706 support next.[actionforex]
"P&F GBPUSD1440 Box Size 250X3 or(4.33%) HI/LO
Data 2.1161 - 1.3502 ~ 92 Month ~ 2795 Day
Database 2000 records 1.63294 (Last Close)
2002-04-22 00~00
2009-12-16 00~00 (GMT+01:00) Paris
http://iticsoftware.com chart"
2.1250|~25O||____________________________________|-0.42%|57.38%
2.1000|~5OO||_________________X__________________|0.76%|55.53%
2.0750|~75O||_________________Xo_________________|1.94%|53.68%
2.0500|~1OOO|_______________X_Xo_________________|3.12%|51.83%
2.0250|~125O|_______________XoXoX________________|4.31%|49.98%
2.0000|~15OO|_______________XoXoXo_______________|5.49%|48.13%
1.9750|~175O|_______________Xo_oXo_______________|6.67%|46.27%
1.9500|~2OOO|_________X_____X__o_o_______________|7.85%|44.42%
1.9250|~225O|_________Xo____X____o_______________|9.03%|42.57%
1.9000|~25OO|_____X___Xo__X_X____o_______________|10.21%|40.72%
1.8750|~275O|_____XoX_Xo__XoX____o_______________|11.39%|38.87%
1.8500|~3OOO|_____XoXoXo__XoX____oX______________|12.58%|37.02%
1.8250|~325O|_____XoXoXoX_Xo_____oXo_____________|13.76%|35.17%
1.8000|~35OO|_____XoXoXoXoX______oXo_____________|14.94%|33.31%
1.7750|~375O|_____XoXo_oXoX______oXo_____________|16.12%|31.46%
1.7500|~4OOO|_____Xo___o_oX______o_o_____________|17.3%|29.61%
1.7250|~425O|_____X______o_________o_____________|18.48%|27.76%
1.7000|~45OO|_____X________________o__________X__|19.66%|25.91%
1.6750|~475O|===X=X================o==========XoX|20.84%|24.06%
1.6500|~5OOO|_X_XoX________________oX_________XoX|22.03%|22.2%
1.6250|~525O|_XoXoX________________oXo________XoX|23.21%|20.35%
1.6000|~55OO|=XoXoX================oXo========XoX|24.39%|18.5%
1.5750|~575O|_XoXo_________________oXo________Xo_|25.57%|16.65%
1.5500|~6OOO|_Xo___________________o_oX_X_____X__|26.75%|14.8%
1.5250|~625O|_X______________________oXoXoX___X__|27.93%|12.95%
1.5000|~65OO|_X______________________oXoXoXo__X__|29.11%|11.09%
1.4750|~675O|_X______________________o_oXoXoX_X__|30.3%|9.24%
1.4500|~7OOO|oX________________________o_o_oXoX__|31.48%|7.39%
1.4250|~725O|______________________________oXoX__|32.66%|5.54%
1.4000|~75OO|______________________________oXoX__|33.84%|3.69%
1.3750|~775O|______________________________o_o___|35.02%|1.84%
1.3500|~8OOO|____________________________________|36.2%|-0.01%
Column|~825O|194541654783473935631414734443644154|
Count|~85OO||_____3______________1_2__________3__|
http://iticsoftware.com/postimages/2009-Jun-19/BJF-Trading-Group-GBPUSD_4h30min_091216.PNG
http://iticsoftware.com/postimages/2009-Jun-19/BJF-Trading-Group-GBPUSD_4h30min_091216.xls
Posted by: MDunleavy Dec 21, 2009, 12:54 PM
GBP/JPY's recovery extended further to as high as 146.89 last week. But after all, it's still limited by 147.43 resistance and we're holding on to the bearish view. That is, choppy recovery from 141.99 is treated as correction to fall from 149.15 only. A break below 143.12 minor support will suggest that such recovery is completed and will flip intraday bias back to the downside. Further break of 141.99 will target 139.26 support next. However, note that break of 147.43 will dampen this immediate bearish view and suggest that rise from 139.26 is still in progress for another high above 149.15 before completion.[actionforex]
"P&F GBPJPY1440 Box Size 440X3 or(7.08%) HI/LO
Data 250.2 - 122.42 ~ 48 Month ~ 1477 Day
Database 1050 records 145.761 (Last Close)
2005-12-05 00~00
2009-12-21 00~00 (GMT+01:00) Paris
http://iticsoftware.com chart"
250.80|~44O||__________x_______________________|-0.24%|104.87%
246.40|~88O||______x___x_o_____________________|1.52%|101.27%
242.00|~132O|______x_o_x_o_____________________|3.28%|97.68%
237.60|~176O|__x___x_o___o_x___________________|5.04%|94.09%
233.20|~22OO|__x_o_x_____o_x_o_________________|6.79%|90.49%
228.80|~264O|__x_o_x_____o_x_o_________________|8.55%|86.9%
224.40|~3O8O|__x_o_______o_x_o_________________|10.31%|83.3%
220.00|~352O|__x_________o___o_________________|12.07%|79.71%
215.60|~396O|__x_____________o_x_______________|13.83%|76.12%
211.20|~44OO|o_x_____________o_x_o_____________|15.59%|72.52%
206.80|~484O|o_x_____________o_x_o_____________|17.35%|68.93%
202.40|~528O|o_______________o_x_o_____________|19.1%|65.33%
198.00|~572O|________________o_x_o_____________|20.86%|61.74%
193.60|~616O|________________o___o_____________|22.62%|58.14%
189.20|~66OO|____________________o_____________|24.38%|54.55%
184.80|~7O4O|____________________o_____________|26.14%|50.96%
180.40|~748O|____________________o_x___________|27.9%|47.36%
176.00|~792O|____________________o_x_o_________|29.66%|43.77%
171.60|~836O|____________________o_x_o_________|31.41%|40.17%
167.20|~88OO|____________________o___o_________|33.17%|36.58%
162.80|~924O|========================o=x===x===|34.93%|32.98%
158.40|~968O|________________________o_x_o_x_o_|36.69%|29.39%
154.00|~1O12|________________________o_x_o_x_o_|38.45%|25.8%
149.60|~1O56|________________________o_x_o_x_o_|40.21%|22.2%
145.20|~11OO|________________________o_x_o_x_o_|41.97%|18.61%
140.80|~1144|========================o===o=x=o=|43.73%|15.01%
136.40|~1188|____________________________o_x___|45.48%|11.42%
132.00|~1232|____________________________o_x___|47.24%|7.83%
127.60|~1276|____________________________o_x___|49%|4.23%
123.20|~132O|____________________________o_x___|50.76%|0.64%
118.80|~1364|____________________________o_____|52.52%|-2.96%
Column|~14O8|3_8_3_5_1_2_7_4_105_113_9_5_10105_|
Count
http://iticsoftware.com/postimages/2009-Jul-01/BJF-Trading-Group-GBPJPY_4h30min_091221.PNG
http://iticsoftware.com/postimages/2009-Jul-01/BJF-Trading-Group-GBPJPY_4h30min_091221.xls
Posted by: MDunleavy Dec 27, 2009, 06:05 PM
EURGBP: Corrective Strength Continues To Be Seen
EURGBP: Price extension following its corrective recovery triggered off the 0.8850 level continues to target further upside breaking above the 0.8970/89 levels today. This leaves further upside risk towards its Dec 14’09 high at 0.9047 with a break aiming at the 0.9150 level, its Dec 01’09 high where a hold must be established to resume its recovery initiated at the 0.8832 level, its Nov 17’09 high towards the 0.9239 level, its Oct 26’09 high. Beyond there will turn attention to the 0.9410 level, its Oct 13’09 high. This view is supported by its daily studies which are bullish and pointing to the upside. On the downside, immediate support lies at the 0.8989/70 levels with a turn below there bringing further downside towards the 0.8832 level where a loss will set the stage for the resumption of its declines started at the 0.9410 level and allowing more downside force towards the 0.8698 level.[Written by actionforex]
"P&F EURGBP1440 Box Size 121X3 or(4.57%) CLOSE
Data 0.977 - 0.6129 ~ 92 Month ~ 2806 Day
Database 2000 records 0.89992 (Last Close)
2002-04-19 00~00
2009-12-24 00~00 (GMT+01:00) Paris
http://iticsoftware.com chart"
0.9801|~121||________________________________________|-0.32%|59.91%
0.9680|~242||________________________x_______________|0.92%|57.94%
0.9559|~363||________________________x_o_____________|2.16%|55.96%
0.9438|~484||________________________x_o_____x_______|3.4%|53.99%
0.9317|~6O5||________________________x_o_x___x_o_x___|4.64%|52.02%
0.9196|~726||========================x=o=x=o=x=o=x=o=|5.88%|50.04%
0.9075|~847||________________________x_o_x_o_x_o_x_o_|7.11%|48.07%
0.8954|~968||________________________x_o_x_o_x_o_x_o_|8.35%|46.09%
0.8833|~1O89|========================x=o===o=x=o=x=o=|9.59%|44.12%
0.8712|~121O|________________________x_____o___o_x___|10.83%|42.14%
0.8591|~1331|____________________x___x_________o_x___|12.07%|40.17%
0.8470|~1452|____________________x_o_x_________o_x___|13.31%|38.2%
0.8349|~1573|____________________x_o_x_________o_____|14.54%|36.22%
0.8228|~1694|____________________x_o_________________|15.78%|34.25%
0.8107|~1815|________________x___x___________________|17.02%|32.27%
0.7986|~1936|________________x_o_x___________________|18.26%|30.3%
0.7865|~2O57|________________x_o_x___________________|19.5%|28.32%
0.7744|~2178|________________x_o_x___________________|20.74%|26.35%
0.7623|~2299|________________x_o_____________________|21.98%|24.38%
0.7502|~242O|________________x_______________________|23.21%|22.4%
0.7381|~2541|________________x_______________________|24.45%|20.43%
0.7260|~2662|________________x_______________________|25.69%|18.45%
0.7139|~2783|x___x___________x_______________________|26.93%|16.48%
0.7018|~29O4|x_o_x_o_x_______x_______________________|28.17%|14.5%
0.6897|~3O25|x_o_x_o_x_o_x___x_______________________|29.41%|12.53%
0.6776|~3146|x_o___o_x_o_x_o_x_______________________|30.64%|10.56%
0.6655|~3267|x_____o_x_o_x_o_x_______________________|31.88%|8.58%
0.6534|~3388|x_____o___o___o_________________________|33.12%|6.61%
0.6413|~35O9|x_______________________________________|34.36%|4.63%
0.6292|~363O|x_______________________________________|35.6%|2.66%
0.6171|~3751|x_______________________________________|36.84%|0.69%
0.6050|~3872|________________________________________|38.08%|-1.29%
Column|~3993|9_3_3_5_4_4_3_3_134_8_3_127_4_5_6_9_8_4_|
Count
http://iticsoftware.com/postimages/2009-Aug-03/BJF-Trading-Group-EURGBP_4h30min_091227.PNG
http://iticsoftware.com/postimages/2009-Aug-03/BJF-Trading-Group-EURGBP_4h30min_091227.xls
Posted by: MDunleavy Dec 31, 2009, 01:28 PM

Yen : The JPY is currently trading in a rising channel pattern. Immediate resistance comes around 93.10 levels which if broken then could test next resistance level near 94.20 levels where shorts can be initiated for the target of 90 levels. Bias for USDJPY pair remains strong above 88.40 levels. (USDJPY- 92.36) Neutral.
Aud : AUDUSD is consistently trading below 55days Daily EMA and is having an immediate resistance near 0.9000 levels.Our expectation of Aud below 0.9000 levels should continue the bearish momentum targeting 0.8650 levels.Initiate shorts near 0.9000 levels for the target of 150pips. Stochastic is in overbought region. (AUDUSD - 0.8964) Bearish.[Written by actionforex]
"P&F AUDJPY1440 Box Size 170X4 or(8.31%) CLOSE
Data 107.42 - 56.23 ~ 93 Month ~ 2845 Day
Database 2000 records 82.882 (Last Close)
2002-03-18 00~00
2009-12-31 00~00 (GMT+01:00) Paris
http://iticsoftware.com chart"
108.8|~17O||_________________________________|-1.28%|93.49%
107.1|~34O||__________X_X____________________|0.3%|90.47%
105.4|~51O||__________XoXo___________________|1.88%|87.44%
103.7|~68O||__________XoXo____X______________|3.46%|84.42%
102.0|~85O||__________XoXo____Xo_____________|5.05%|81.4%
100.3|~1O2O|__________XoXo____Xo_____________|6.63%|78.37%
98.60|~119O|__________XoXoX_X_Xo_____________|8.21%|75.35%
96.90|~136O|__________XoXoXoXoXo_____________|9.79%|72.33%
95.20|~153O|________X_XoXoXoXoXo_____________|11.38%|69.3%
93.50|~17OO|________XoXoXoXoXoXo_____________|12.96%|66.28%
91.80|~187O|________XoXoXo_oXoXo_____________|14.54%|63.26%
90.10|~2O4O|______X_XoXo___o_oXo_____________|16.12%|60.23%
88.40|~221O|______XoXo_______o_oX____________|17.71%|57.21%
86.70|~238O|______XoX__________oXo___________|19.29%|54.19%
85.00|~255O|____X_XoX__________oXo___________|20.87%|51.16%
83.30|~272O|____XoXoX__________oXo__________X|22.45%|48.14%
81.60|~289O|____XoXo___________o_o__________X|24.04%|45.12%
79.90|~3O6O|__X_XoX______________o________X_X|25.62%|42.09%
78.20|~323O|__XoXoX______________o________XoX|27.2%|39.07%
76.50|~34OO|__XoXoX______________o________XoX|28.78%|36.05%
74.80|~357O|__XoXoX______________o________XoX|30.37%|33.03%
73.10|~374O|__Xo_o_______________o________XoX|31.95%|30%
71.40|~391O|X_X__________________oX_X_____Xo_|33.53%|26.98%
69.70|~4O8O|XoX__________________oXoXo____X__|35.11%|23.96%
68.00|~425O|_oX__________________oXoXoX___X__|36.7%|20.93%
66.30|~442O|_oX__________________oXoXoXoX_X__|38.28%|17.91%
64.60|~459O|_oX__________________o_o_oXoXoX__|39.86%|14.89%
62.90|~476O|_o_______________________oXoXoX__|41.44%|11.86%
61.20|~493O|_________________________oXoXoX__|43.03%|8.84%
59.50|~51OO|_________________________oXoXoX__|44.61%|5.82%
57.80|~527O|_________________________oXoXoX__|46.19%|2.79%
56.10|~544O|_________________________o_o_o___|47.78%|-0.23%
Column|~561O|251477158411194556914144497766157|
Count|~578O|__O___O___1OO______3_4________4__|
http://iticsoftware.com/postimages/2009-Jul-01/BJF-Trading-Group-AUDJPY_4h1h_091231.PNG
http://iticsoftware.com/postimages/2009-Jul-01/BJF-Trading-Group-AUDJPY_4h1h_091231.xls
Posted by: MDunleavy Jan 2, 2010, 10:49 AM
Dollar Index is currently trading at 77.80 levels and consistantly trading above 55 days EMA. We're remaining bullish on the dollar index as long as 76.80 resistance turned support is held. Further rise is expected to be seen near 80 levels (DI - 77.78) Bullish.[Written by actionforex]
"P&F _DY1440 Box Size 160X3 or(5.05%) CLOSE
Data 118.62 - 71.36 ~ 93 Month ~ 2834 Day
Database 2001 records 77.87 (Last Close)
2002-03-29 00~00
2009-12-31 00~00 (GMT+01:00) Paris
BJF Trading Group chart"
118.4|~16O||________________________________________|0.19%|65.92%
116.8|~32O||________________________________________|1.53%|63.68%
115.2|~48O||__o_____________________________________|2.88%|61.43%
113.6|~64O||__o_____________________________________|4.23%|59.19%
112.0|~8OO||__o_____________________________________|5.58%|56.95%
110.4|~96O||__o_____________________________________|6.93%|54.71%
108.8|~112O|__o_____________________________________|8.28%|52.47%
107.2|~128O|__o_____________________________________|9.63%|50.22%
105.6|~144O|__o_____________________________________|10.98%|47.98%
104.0|~16OO|__o_____________________________________|12.33%|45.74%
102.4|~176O|__o_____________________________________|13.67%|43.5%
100.8|~192O|__o_____________________________________|15.02%|41.26%
99.20|~2O8O|__o_____________________________________|16.37%|39.01%
97.60|~224O|__o_x___________________________________|17.72%|36.77%
96.00|~24OO|__o_x_o_________________________________|19.07%|34.53%
94.40|~256O|__o_x_o_________________________________|20.42%|32.29%
92.80|~272O|__o_x_o_________________________________|21.77%|30.04%
91.20|~288O|__o___o_x___________x___________________|23.12%|27.8%
89.60|~3O4O|______o_x_o_____x___x_o_________________|24.46%|25.56%
88.00|~32OO|______o_x_o_____x_o_x_o_____x___x_______|25.81%|23.32%
86.40|~336O|______o_x_o_____x_o_x_o_____x_o_x_o_x___|27.16%|21.08%
84.80|~352O|______o___o_x___x_o___o_____x_o_x_o_x_o_|28.51%|18.83%
83.20|~368O|__________o_x_o_x_____o_____x_o_x_o_x_o_|29.86%|16.59%
81.60|~384O|__________o_x_o_x_____o_____x_o_x_o___o_|31.21%|14.35%
80.00|~4OOO|__________o___o_______o_x___x_o_x_____o_|32.56%|12.11%
78.40|~416O|______________________o_x_o_x_o_______o_|33.91%|9.87%
76.80|~432O|______________________o_x_o_x_________o_|35.26%|7.62%
75.20|~448O|______________________o_x_o___________o_|36.6%|5.38%
73.60|~464O|______________________o_x_____________o_|37.95%|3.14%
72.00|~48OO|______________________o_x_______________|39.3%|0.9%
70.40|~496O|______________________o_________________|40.65%|-1.35%
Column||||||0_164_8_4_7_3_3_6_3_4_136_3_8_6_6_4_3_8_|
Count
http://iticsoftware.com/postimages/2009-Aug-03/BJF-Trading-Group-DXY_4h30min_0102.PNG
http://iticsoftware.com/postimages/2009-Aug-03/BJF-Trading-Group-DXY_4h30min_0102.xls
Posted by: MDunleavy Jan 8, 2010, 09:10 PM
Gold's recovery stalled after hitting 38.2% retracement of 1227.5 to 1075.2 at 1133.4 and with 4 hours MACD crossed below signal line, intraday bias is turned neutral. With 1115.9 minor support intact, another rise cannot be ruled out and above 1141 will target 61.8% retracement at 1169.3 next. On the downside, however, break of 1115.9 minor support will argue that recovery from 1075.2 might have completed and will flip intraday bias back to the downside for retesting this support.
In the bigger picture, rise from 681 is expected to develop into a set of five wave sequence with first wave completed at 1007.7, second wave triangle consolidation completed at 931.3. Rise from 931.3 is treated as the third wave and has possibly completed at 1227.5 after missing 100% projection of 681 to 1007.7 from 931.3 at 1258. Deeper pull back could now be seen to 1026.9/1072 support zone, or even further to retest 1000 psychological level. But downside should be contained well above 931.3 support and bring up trend resumption to another high above 1227.5.[oilngold]
"P&F GOLD240 Box Size1780X3 or(5.6%) HI/LO
Data 1226.37 - 681.4 ~ 16 Month ~ 476.5 Day
Database 2011 records 1122.27 (Last Close)
2008-09-19 00~00
2010-01-08 12~00 (GMT+01:00) Paris
http://iticsoftware.com chart"
1228.20|~1780||____________________________________________|-0.15%|80.25%
1210.40|~3560||______________________________________x_o___|1.3%|77.63%
1192.60|~5340||__________________________________x___x_o___|2.75%|75.02%
1174.80|~7120||__________________________________x_o_x_o___|4.21%|72.41%
1157.00|~89O0||__________________________________x_o_x_o___|5.66%|69.8%
1139.20|~1O680|__________________________________x_o___o_x_|7.11%|67.19%
1121.40|~12460|__________________________________x_____o_x_|8.56%|64.57%
1103.60|~14240|__________________________________x_____o_x_|10.01%|61.96%
1085.80|~16O20|__________________________________x_____o___|11.46%|59.35%
1068.00|~178O0|__________________________________x_________|12.91%|56.74%
1050.20|~19580|__________________________________x_________|14.37%|54.12%
1032.40|~21360|__________________________________x_________|15.82%|51.51%
1014.60|~23140|__________________________________x_________|17.27%|48.9%
996.80|~24920||______________________x___________x_________|18.72%|46.29%
979.00|~267O0||______________________x_o_____x___x_________|20.17%|43.67%
961.20|~28480||______________________x_o_x___x_o_x_________|21.62%|41.06%
943.40|~3O260||______________________x_o_x_o_x_o_x_________|23.07%|38.45%
925.60|~32O40||______x_______________x_o_x_o_x_o_x_________|24.53%|35.84%
907.80|~33820||__x___x_o_____________x_o_x_o_x_o___________|25.98%|33.23%
890.00|~356O0||__x_o_x_o_____________x_o___o_x_____________|27.43%|30.61%
872.20|~37380||__x_o_x_o_________x___x_____o_______________|28.88%|28%
854.40|~39160||__x_o_x_o_________x_o_x_____________________|30.33%|25.39%
836.60|~4O940||o___o___o_________x_o_x_____________________|31.78%|22.78%
818.80|~42720||o_______o_____x___x_o_______________________|33.23%|20.16%
801.00|~445O0||________o_____x_o_x_________________________|34.69%|17.55%
783.20|~46280||________o_____x_o_x_________________________|36.14%|14.94%
765.40|~48O60||________o_x___x_o_x_________________________|37.59%|12.33%
747.60|~49840||________o_x_o_x_o___________________________|39.04%|9.72%
729.80|~51620||________o_x_o_x_____________________________|40.49%|7.1%
712.00|~534O0||________o_x_o_______________________________|41.94%|4.49%
694.20|~55180||________o___________________________________|43.39%|1.88%
676.40|~56960||____________________________________________|44.85%|-0.73%
Column|~58740||2_4_4_5_134_3_6_4_7_3_106_4_5_6_4_163_4_8_3_|
Count
http://iticsoftware.com/postimages/2009-Aug-03/BJF-Trading-Group-GOLD_30min_2010-Jan-08.PNG
http://iticsoftware.com/postimages/2009-Aug-03/BJF-Trading-Group-GOLD_30min_2010-Jan-08.xls
Posted by: MDunleavy Jan 10, 2010, 10:01 PM
2010 Currency Outlook: USD
After strong rallies in 2008 and early 2009, USD peaked in March. In order to combat the worst recession since the World War II, the Fed reduced the policy rate to an unprecedentedly low level and implemented a series of quantitative easing policies. The 'twin deficits' problem (current account and fiscal deficits) has put USD's status as the reserve currency at risks and triggered investors to dump the currency. Worries about the dollar's future as well as increase in risk appetite as global economic outlook recovered later in 2009 brought the greenback to extremely low levels.
Undervaluation: According Fed's measure, the trade-weighted USD index plummeted -13% against major currencies after making 2.5-year high in March. On annual basis, the gauge dropped -8%, the biggest loss since 2003. Despite modest recovery in December 2009, the dollar index continued hovering at historic lows.
ICE's US dollar index also showed a similar pattern. The valuation is about 1.5 standard deviations below its long-term average. From the viewpoint of mean-reversion, the dollar is poised for a strong rebound.
On a PPP basis, the dollar also looked undervalued when compared with major currencies. The table below shows the PPP values of 8 currencies which were used by Fed in composing the USD Major Currencies Index. Using closing price as of December 2009, USD is undervalued when compared with all 'major currencies'.
However, being cheap is not sufficient to make USD higher. The US needs to show promising economic growth to attract buying.[Written by actionforex]
http://iticsoftware.com/postimages/2009-Jul-01/BJF-Trading-Group-mixAEGN20100110.PNG
http://iticsoftware.com/postimages/2009-Jul-01/BJF-Trading-Group-mixAEGN20100110.xls
Posted by: MDunleavy Jan 15, 2010, 08:40 AM
AUDUSD Outlook
The AUDUSD continued its bullish momentum yesterday. However, as you can see on h4 chart below, price seems to have a good resistance around 0.9325 area, which is a potential top at this phase, a good place to short targeting 0.9170 with a tight stop loss above 0.9325 area. Break above 0.9325 area should trigger a significant bullish momentum targeting 0.9404 area.[Written by actionforex]
"P&F AUDUSD1440 Box Size 125X3 or(4.74%) CLOSE
Data 0.9784 - 0.6033 ~ 21 Month ~ 648 Day
Database 461 records 0.9277 (Last Close)
2008-04-07 00~00
2010-01-15 00~00 (GMT+01:00) Paris
http://iticsoftware.com chart"
0.9875|~125||________________________________________________________|-0.93%|63.68%
0.9750|~25O||______x_________________________________________________|0.35%|61.61%
0.9625|~375||__x___x_o_______________________________________________|1.63%|59.54%
0.9500|~5OO||__x_o_x_o_______________________________________________|2.9%|57.47%
0.9375|~625||__x_o_x_o_______________________________________________|4.18%|55.4%
0.9250|~75O||o===o===o=====================================x===x===x=|5.46%|53.32%
0.9125|~875||________o_____________________________________x_o_x_o_x_|6.74%|51.25%
0.9000|~1OOO|________o_____________________________________x_o_x_o_x_|8.01%|49.18%
0.8875|~1125|________o_____________________________________x_o___o_x_|9.29%|47.11%
0.8750|~125O|________o_____________________________________x_____o_x_|10.57%|45.04%
0.8625|~1375|________o_____________________________________x_____o___|11.85%|42.96%
0.8500|~15OO|________o_____________________________________x_________|13.12%|40.89%
0.8375|~1625|________o_x___________________________________x_________|14.4%|38.82%
0.8250|~175O|________o_x_o_________________________________x_________|15.68%|36.75%
0.8125|~1875|________o_x_o_____________________________x___x_________|16.96%|34.68%
0.8000|~2OOO|________o_x_o_____________________________x_o_x_________|18.23%|32.6%
0.7875|~2125|________o_x_o_____________________________x_o_x_________|19.51%|30.53%
0.7750|~225O|________o___o_____________________________x_o___________|20.79%|28.46%
0.7625|~2375|____________o_____________________________x_____________|22.07%|26.39%
0.7500|~25OO|____________o_____________________________x_____________|23.34%|24.32%
0.7375|~2625|____________o_____________________________x_____________|24.62%|22.24%
0.7250|~275O|____________o_________________________x___x_____________|25.9%|20.17%
0.7125|~2875|____________o_________________x_______x_o_x_____________|27.18%|18.1%
0.7000|~3OOO|____________o_x___x___________x_o_____x_o_x_____________|28.45%|16.03%
0.6875|~3125|____________o_x_o_x_o_x_______x_o_____x_o_______________|29.73%|13.96%
0.6750|~325O|____________o_x_o_x_o_x_o_____x_o_x___x_________________|31.01%|11.88%
0.6625|~3375|____________o_x_o_x_o_x_o_x___x_o_x_o_x_________________|32.29%|9.81%
0.6500|~35OO|____________o_x_o___o_x_o_x_o_x_o_x_o_x_________________|33.57%|7.74%
0.6375|~3625|____________o_______o_x_o_x_o_x_o_x_o_x_________________|34.84%|5.67%
0.6250|~375O|____________________o_x_o___o_x_o___o___________________|36.12%|3.6%
0.6125|~3875|____________________o_x_____o_x_________________________|37.4%|1.52%
0.6000|~4OOO|____________________o_______o___________________________|38.68%|-0.55%
Column|~4125|1_3_3_4_165_165_4_4_8_7_5_3_5_9_7_4_4_8_3_103_123_3_5_5_|
Count
http://iticsoftware.com/postimages/2009-Jun-19/BJF-Trading-Group-AUDUSD_h430min_0115.PNG
http://iticsoftware.com/postimages/2009-Jun-19/BJF-Trading-Group-AUDUSD_h430min_0115.xls
Posted by: MDunleavy Jan 16, 2010, 11:44 AM
The second week of the New Year did not offer much in terms of breakouts from the recent consolidation ranges. Fundamentals reflect a slow recovery and risk appetite also remained subdued this week after some initial rally. Let's take a look at some major currency pairs.
EUR/USD Stalking Consolidation
Daily and 4H: The EUR/USD is heading back to the support of its consolidation. The stochastic in the daily has crossed and today’s price action seems to be very aggressive, though we still have a few hours to go.
Looking at the 4H time-frame, it will be interesting to see if the 78.6% retracement level at 1.4330 can hold. This may give way to a throwback scenario, which does not have to reach 1.4450, but it is a preferred scenario as this will make this previous support into resistance.
If the decline then continues a swing, it is projected to the 1.4200 area. If 1.4200 breaks, this is the decline to start the continuation towards the 1.37-1.38 area (61.8% retracement in the daily time-frame).[Written by CMS Forex]
"P&F EURUSD1440 Box Size 75X3 or(1.6%) HI/LO
Data 1.5135 - 1.2924 ~ 9 Month ~ 275 Day
Database 1050 records 1.4387 (Last Close)
2009-04-15 00~00
2010-01-15 00~00 (GMT+01:00) Paris
http://iticsoftware.com chart"
1.5150|~75|||____________________________|-0.1%|17.22%
1.5075|~15O||_______________________X_X__|0.4%|16.64%
1.5000|~225||_____________________X_XoXo_|0.89%|16.06%
1.4925|~3OO||_____________________XoXoXo_|1.39%|15.48%
1.4850|~375||_____________________XoXo_o_|1.88%|14.9%
1.4775|~45O||___________________X_XoX__o_|2.38%|14.32%
1.4700|~525||___________________XoXoX__o_|2.87%|13.74%
1.4625|~6OO||___________________XoXo___o_|3.37%|13.16%
1.4550|~675||===================Xo=====oX|3.87%|12.58%
1.4475|~75O||___________________X______oX|4.36%|12%
1.4400|~825||_______________X_X_X______oX|4.86%|11.42%
1.4325|~9OO||_______X_______XoXoX______oX|5.35%|10.84%
1.4250|~975||=======Xo====X=XoXoX======o=|5.85%|10.26%
1.4175|~1O5O|_______XoX_X_XoXoXo_________|6.34%|9.68%
1.4100|~1125|_______XoXoXoXoXo___________|6.84%|9.1%
1.4025|~12OO|_____X_XoXoXoXo_____________|7.33%|8.52%
1.3950|~1275|_____XoXoXoXoX______________|7.83%|7.94%
1.3875|~135O|_____XoXo_oXo_______________|8.33%|7.36%
1.3800|~1425|_____Xo___o_________________|8.82%|6.78%
1.3725|~15OO|_____X______________________|9.32%|6.2%
1.3650|~1575|___X_X______________________|9.81%|5.62%
1.3575|~165O|___XoX______________________|10.31%|5.04%
1.3500|~1725|___XoX______________________|10.8%|4.46%
1.3425|~18OO|___Xo_______________________|11.3%|3.88%
1.3350|~1875|___X________________________|11.79%|3.3%
1.3275|~195O|_X_X________________________|12.29%|2.72%
1.3200|~2O25|_XoX________________________|12.78%|2.14%
1.3125|~21OO|_XoX________________________|13.28%|1.56%
1.3050|~2175|oXoX________________________|13.78%|0.97%
1.2975|~225O|oXo_________________________|14.27%|0.39%
1.2900|~2325|o___________________________|14.77%|-0.19%
Column|||||||3549383764554535443836563314|
Count||||||||__________________________1_|
http://iticsoftware.com/postimages/2009-Aug-03/BJF-Trading-Group-EURUSD0116.PNG
http://iticsoftware.com/postimages/2009-Aug-03/BJF-Trading-Group-EURUSD0116.xls
Posted by: MDunleavy Jan 20, 2010, 11:19 AM
New trading strategy
Bought at 129.20, Target: 131.00, Stop: 128.65
Despite intra-day fall to 128.73, as the move from 134.37 is still viewed as retracement of the rise from 127.32, suggesting downside would be limited and bring another rebound later. Above 131.00 would signal low has possibly been formed but break of 131.52 (previous support turned resistance) is needed to confirm low has been formed, then stronger rebound to 132.40/50 and later towards 133.65.[Written by actionforex]
http://iticsoftware.com/postimages/2009-Aug-03/BJF-Trading-Group-EURJPY_0120.PNG
http://iticsoftware.com/postimages/2009-Aug-03/BJF-Trading-Group-EURJPY_0120.xls
Posted by: MDunleavy Jan 21, 2010, 10:56 AM
EURAUD=EURUSD:AUDUSD
EURUSD continued its bearish momentum yesterday, bottomed at 1.4062 and closed at 1.4086.The bias remains to the downside targeting 1.4000 psychological level. Only and only if euro trades below these levels further bearishness till 1.38 could be seen. Immediate resistance is at 1.4120 levels. (EURUSD–1.4094) Neutral
The AUDUSD had a bearish momentum yesterday, bottomed at 0.9068 and closed at 0.9090 and it is currently trading at 0.9130 level.Immediate support near 0.8980 level (100Days Daily EMA) and Immediate resistance at 0.9160 (21 days EMA). Break above that resistance area should trigger further bullish .Buying close to .8900 levels is recommended.(AUDUSD-0.9130) Cautious Bullish [Written by India Forex]
"P&F EURAUD1440 Box Size 180X5 or(4.96%) CLOSE
Data 2.0838 - 1.5447 ~ 92 Month ~ 2808 Day
Database 2000 records 1.54465 (Last Close)
2002-05-15 00~00
2010-01-21 00~00 (GMT+01:00) Paris
http://iticsoftware.com chart"
2.0700|~18O||____________________X_______X___|0.66%|34.01%
2.0520|~36O||____________________XoX_X___Xo__|1.53%|32.84%
2.0340|~54O||____________________XoXoXoX_Xo__|2.39%|31.68%
2.0160|~72O||____________________XoXoXoXoXoX_|3.25%|30.51%
1.9980|~9OO||____________________XoXoXoXoXoXo|4.12%|29.35%
1.9800|~1O8O|____________________XoXoXoXoXoXo|4.98%|28.18%
1.9620|~126O|____________________XoXoXoXoXoXo|5.85%|27.01%
1.9440|~144O|____________________Xo_oXoXoXoXo|6.71%|25.85%
1.9260|~162O|____________________X__oXoXo_oXo|7.57%|24.68%
1.9080|~18OO|____________________X__oXoX__oXo|8.44%|23.52%
1.8900|~198O|____________________X__o_oX__oXo|9.3%|22.35%
1.8720|~216O|====================X====oX==o=o|10.16%|21.19%
1.8540|~234O|X_X_________________X____o_____o|11.03%|20.02%
1.8360|~252O|XoXo________________X__________o|11.89%|18.86%
1.8180|~27OO|XoXo________________X__________o|12.76%|17.69%
1.8000|~288O|XoXo________________X__________o|13.62%|16.53%
1.7820|~3O6O|XoXo________________X__________o|14.48%|15.36%
1.7640|~324O|XoXo__X_____________X__________o|15.35%|14.2%
1.7460|~342O|Xo_oX_XoX___________X__________o|16.21%|13.03%
1.7280|~36OO|X__oXoXoXo__X_______X__________o|17.07%|11.87%
1.7100|~378O|X__oXoXoXo__Xo____X_X__________o|17.94%|10.7%
1.6920|~396O|X__oXoXoXo__Xo__X_XoX__________o|18.8%|9.54%
1.6740|~414O|X__oXoXoXo__XoX_XoXoX__________o|19.67%|8.37%
1.6560|~432O|X__o_oXo_o__XoXoXoXoX__________o|20.53%|7.21%
1.6380|~45OO|X____oX__oX_XoXoXoXoX__________o|21.39%|6.04%
1.6200|~468O|_____oX__oXoXoXoXoXoX__________o|22.26%|4.87%
1.6020|~486O|_____oX__oXoXoXoXoXo___________o|23.12%|3.71%
1.5840|~5O4O|_____oX__oXoXoXoXo_____________o|23.99%|2.54%
1.5660|~522O|_____o___oXoXoXoX______________o|24.85%|1.38%
1.5480|~54OO|=========o=o=o=o===============o|25.71%|0.21%
1.5300|~558O|_______________________________o|26.58%|-0.95%
Column|||||||16615116515511778676276991168182|
Count||||||||3__1_O1__1__OO______6____1O__1_7|
http://iticsoftware.com/postimages/2009-Jul-01/BJF-Trading-Group-EURAUD0121_%281%29.PNG
http://iticsoftware.com/postimages/2009-Jul-01/BJF-Trading-Group-EURAUD0121.xls
Posted by: Nick'Otin Jan 22, 2010, 10:51 PM
Hi.Nice job.
Posted by: MDunleavy Jan 23, 2010, 02:55 PM
GBP/USD: Eyes Range Support at 1.57 - Throwback Offers More Bearish Confirmation
4H: The GBP/USD was showing strong reversal signals, yesterday breaking below 1.62. In the Asian session and early European session, the market had a throwback from 1.6130 to 1.6270 before a heavy drop leading into the US session.
The throwback confirms bearish mode, but we may end the week seeing support at the the channel support level near 1.6050. The stochastic might develop a bullish divergence if this area holds. The market is also at the 61.8%-78.6% retracement zone.
Daily: The daily shows three consecutive sessions of strong bearish action. It looks poised to continue next week.
With this in mind, looking back at the 4H chart, a rally from the 1.6050 level should be expected as a correction rally. The bearish projection in the short/intermediate term is still the 1.57-1.58 area.[Written by CMS Forex]
"P&F GBPUSD1440 Box Size 240X4 or(5.51%) CLOSE
Data 2.1065 - 1.3771 ~ 92 Month ~ 2797 Day
Database 2000 records 1.61112 (Last Close)
2002-05-27 00~00
2010-01-22 00~00 (GMT+01:00) Paris
http://iticsoftware.com chart"
2.1120|~24O||____________________________________________________|-0.26%|53.37%
2.0880|~48O||________________________x___________________________|0.88%|51.62%
2.0640|~72O||________________________x_o_________________________|2.02%|49.88%
2.0400|~96O||________________________x_o_________________________|3.16%|48.14%
2.0160|~12OO|________________________x_o_x_______________________|4.3%|46.39%
1.9920|~144O|________________________x_o_x_o_____________________|5.44%|44.65%
1.9680|~168O|________________________x_o_x_o_____________________|6.57%|42.91%
1.9440|~192O|________________x_______x_o_x_o_____________________|7.71%|41.17%
1.9200|~216O|________________x_o_____x_o___o_____________________|8.85%|39.42%
1.8960|~24OO|________x_______x_o_____x_____o_____________________|9.99%|37.68%
1.8720|~264O|________x_o_x___x_o_____x_____o_____________________|11.13%|35.94%
1.8480|~288O|________x_o_x_o_x_o_____x_____o_x___________________|12.27%|34.2%
1.8240|~312O|________x_o_x_o_x_o_x___x_____o_x_o_________________|13.41%|32.45%
1.8000|~336O|________x_o_x_o_x_o_x_o_x_____o_x_o_________________|14.55%|30.71%
1.7760|~36OO|________x_o_x_o_x_o_x_o_x_____o_x_o_________________|15.69%|28.97%
1.7520|~384O|________x_o___o___o_x_o_x_____o_x_o_________________|16.83%|27.22%
1.7280|~4O8O|________x_________o___o_x_____o___o_________________|17.97%|25.48%
1.7040|~432O|________x_____________o___________o_________________|19.11%|23.74%
1.6800|~456O|====x===x=========================o=========x===x===|20.25%|22%
1.6560|~48OO|____x_o_x_________________________o_________x_o_x_o_|21.39%|20.25%
1.6320|~5O4O|x___x_o_x_________________________o_x_______x_o_x_o_|22.53%|18.51%
1.6080|~528O|x_o_x_o_x_________________________o_x_o_____x_o_x_o_|23.66%|16.77%
1.5840|~552O|x=o=x=o=x=========================o=x=o=====x=o=x=o=|24.8%|15.02%
1.5600|~576O|x_o_x_o___________________________o_x_o_____x_o_____|25.94%|13.28%
1.5360|~6OOO|x_o_______________________________o___o_____x_______|27.08%|11.54%
1.5120|~624O|x_____________________________________o_____x_______|28.22%|9.8%
1.4880|~648O|x_____________________________________o_x___x_______|29.36%|8.05%
1.4640|~672O|x_____________________________________o_x_o_x_______|30.5%|6.31%
1.4400|~696O|______________________________________o_x_o_x_______|31.64%|4.57%
1.4160|~72OO|______________________________________o_x_o_x_______|32.78%|2.82%
1.3920|~744O|______________________________________o_x_o_x_______|33.92%|1.08%
1.3680|~768O|______________________________________o___o_________|35.06%|-0.66%
Column|~792O|8_4_6_5_146_5_5_8_9_4_5_167_4_125_134_115_5_135_5_4_|
Count
http://iticsoftware.com/postimages/2009-Aug-03/BJF-Trading-Group-GBPUSD0123.PNG
http://iticsoftware.com/postimages/2009-Aug-03/BJF-Trading-Group-GBPUSD0123.xls
Posted by: MDunleavy Jan 26, 2010, 09:39 AM
USD/JPY closed higher due to loss taking on Monday as it consolidated some of last week's decline. The high-range close sets the stage for a steady to higher opening on Tuesday. Stochastics and the RSI are oversold but remain neutral to bearish signalling that sideways to lower prices are possible near-term. If it extends last week's decline, the reaction low crossing is the next downside target. Closes above last Wednesday's high crossing would temper the near-term friendly outlook.[Written by HY Markets]
"P&F USDJPY1440 Box Size 130X4 or(4.93%) HI/LO
Data 125.94 - 84.819 ~ 92 Month ~ 2800 Day
Database 2000 records 90.285 (Last Close)
2002-05-28 00~00
2010-01-26 00~00 (GMT+01:00) Paris
http://iticsoftware.com chart"
126.10|~13O||________________________________|-0.13%|48.67%
124.80|~26O||oXoX____________________________|0.91%|47.14%
123.50|~39O||oXoXo________X__________________|1.94%|45.6%
122.20|~52O||oXoXo________Xo_________________|2.97%|44.07%
120.90|~65O||oXoXo____X_X_Xo_________________|4%|42.54%
119.60|~78O||oXo_o____XoXoXo_________________|5.03%|41.01%
118.30|~91O||oX__o____XoXoXo_________________|6.07%|39.47%
117.00|~1O4O|oX__o____XoXoXoX________________|7.1%|37.94%
115.70|~117O|o___o____XoXo_oXo_______________|8.13%|36.41%
114.40|~13OO|____o__X_XoX__oXoX______________|9.16%|34.88%
113.10|~143O|____o__XoXoX__oXoXo_____________|10.2%|33.34%
111.80|~156O|____oX_XoXoX__o_oXo_____________|11.23%|31.81%
110.50|~169O|____oXoXoXoX____oXoX____________|12.26%|30.28%
109.20|~182O|____oXoXoXo_____oXoXo___________|13.29%|28.74%
107.90|~195O|____oXoXoX______o_oXo___________|14.32%|27.21%
106.60|~2O8O|____oXoXoX________oXo___________|15.36%|25.68%
105.30|~221O|____o_oXoX________oXo___________|16.39%|24.15%
104.00|~234O|______o_oX________oXo___________|17.42%|22.61%
102.70|~247O|________o_________oXo___________|18.45%|21.08%
101.40|~26OO|__________________oXo______X____|19.49%|19.55%
100.10|~273O|__________________oXoX_____Xo___|20.52%|18.02%
98.80|~286O||__________________oXoXo__X_Xo___|21.55%|16.48%
97.50|~299O||__________________oXoXo__XoXoX__|22.58%|14.95%
96.20|~312O||__________________o_oXo__XoXoXo_|23.61%|13.42%
94.90|~325O||____________________oXo__XoXoXo_|24.65%|11.89%
93.60|~338O||====================oXoX=Xo=oXoX|25.68%|10.35%
92.30|~351O||____________________oXoXoX__o_oX|26.71%|8.82%
91.00|~364O||____________________o_oXoX____oX|27.74%|7.29%
89.70|~377O||______________________oXoX____oX|28.78%|5.75%
88.40|~39OO||______________________o_o_____oX|29.81%|4.22%
87.10|~4O3O||______________________________oX|30.84%|2.69%
85.80|~416O||==============================o=|31.87%|1.16%
84.50|~429O||________________________________|32.9%|-0.38%
Column|~442O|87541568919946947511179448467496|
Count||||||||____5____4________415___________|
http://iticsoftware.com/postimages/2009-Jun-19/BJF-Trading-Group-USDJPY0126.PNG
http://iticsoftware.com/postimages/2009-Jun-19/BJF-Trading-Group-USDJPY0126.xls
Posted by: MDunleavy Jan 27, 2010, 09:55 AM
Prices on the dollar index reached new highs in the past week, after a break through the 78.45 region. Currently, we are looking for the final moves of a red wave I/A leg, which is an impulse wave. Once an impulse wave I/A finds its highs around 79.50 region, traders should look for a corrective wave II/B reversal, before an up-trend will be able to continue.[Written by TheLFB-Forex.com]
"P&F _DXY15 Box Size 9X3 or(0.35%) CLOSE
Data 78.79 - 76.63 ~ 1 Month ~ 35.69 Day
Database 2060 records 78.58 (Last Close)
2009-12-22 16~45
2010-01-27 09~15 (GMT+01:00) Paris
http://iticsoftware.com chart"
78.75|~9||||_______________________________X________|0.05%|2.77%
78.66|~18|||_______________________________Xo_______|0.16%|2.65%
78.57|~27|||_______________________________Xo____X_X|0.28%|2.53%
78.48|~36|||_______________________________Xo____XoX|0.39%|2.41%
78.39|~45|||o______________________________XoX___XoX|0.51%|2.3%
78.30|~54|||o______________________________XoXoX_Xo_|0.62%|2.18%
78.21|~63|||o______________________________XoXoXoX__|0.74%|2.06%
78.12|~72|||o____X_X_______X_______________XoXoXoX__|0.85%|1.94%
78.03|~81|||o__X_XoXo____X_Xo______________Xo_o_o___|0.96%|1.83%
77.94|~9O|||o__XoXo1o____XoXo______________X________|1.08%|1.71%
77.85|~99|||o__XoXoXo__X_XoXoX_____________X________|1.19%|1.59%
77.76|~1O8||oX_Xo_oXo__XoXo_oXo____________X________|1.31%|1.47%
77.67|~117||oXoX__oXo__XoX__oXo____________X________|1.42%|1.36%
77.58|~126||oXoX__oXo__XoX__oXo____________X________|1.54%|1.24%
77.49|~135||o_oX__oXoX_XoX__o_o____________X________|1.65%|1.12%
77.40|~144||__oX__o_oXoXoX____o____________X________|1.76%|1%
77.31|~153||__o_____oXoXo_____o__________X_X________|1.88%|0.89%
77.22|~162||________oXo_______o__X_______XoX________|1.99%|0.77%
77.13|~171||________oX________o__XoX_____XoX________|2.11%|0.65%
77.04|~18O||________o_________oX_XoXo____XoX________|2.22%|0.54%
76.95|~189||__________________oXoXoXoX_X_XoX________|2.34%|0.42%
76.86|~198||__________________oXoXoXoXoXoXo_________|2.45%|0.3%
76.77|~2O7||__________________o_o_o_oXoXoX__________|2.56%|0.18%
76.68|~216||________________________oXo_o___________|2.68%|0.07%
76.59|~225||________________________o_______________|2.79%|-0.05%
Column||||||1358348815376834741335546433375284433633|
Count|||||||1_______2_________2____________1________|
Posted by: Nick'Otin Jan 28, 2010, 11:28 PM
Hi.Nice job.
Posted by: MDunleavy Jan 31, 2010, 07:05 AM
Daily: The USD/CAD continues to climb in this recent environment of risk aversion and news of China's tightening of regulations which subdued any strength in commodities and thus commodity currencies such as the CAD, AUD, and NZD.
The daily time-frame shows the market struggling to reach the previous top at 1.075. The 1.07 is holding as resistance so far in three attemps this week.
The market may be starting a bullish run in the USD/CAD, but a significant correction would help with timing and could further confirm the bullish mode.
Weekly: The weekly time-frame shows that the 1.10-1.11 area is an important resistance. So if the markey breaks the 1.075 area, this may be the next resistance.
This is also an important area as it may coincide with the 200 and 50 MAs in the Weekly time-frame. We will see then if the current rally is a major correction, or whether a long-term rally is starting to take off.[Written by CMS Forex]
"P&F USDCAD1440 Box Size 225X3 or(5.37%) CLOSE
Data 1.5972 - 0.9161 ~ 92 Month ~ 2810 Day
Database 2000 records 1.0703 (Last Close)
2002-05-21 00~00
2010-01-29 00~00 (GMT+01:00) Paris
http://iticsoftware.com chart"
1.5975|~225||________________________________________________|-0.02%|74.38%
1.5750|~45O||x_______________________________________________|1.39%|71.92%
1.5525|~675||x_o_____________________________________________|2.8%|69.47%
1.5300|~9OO||x_o_____________________________________________|4.21%|67.01%
1.5075|~1125|__o_____________________________________________|5.62%|64.56%
1.4850|~135O|__o_____________________________________________|7.02%|62.1%
1.4625|~1575|__o_____________________________________________|8.43%|59.64%
1.4400|~18OO|__o_____________________________________________|9.84%|57.19%
1.4175|~2O25|__o_____________________________________________|11.25%|54.73%
1.3950|~225O|__o_x___x_______________________________________|12.66%|52.28%
1.3725|~2475|__o_x_o_x_o_____________________________________|14.07%|49.82%
1.3500|~27OO|__o_x_o_x_o_____________________________________|15.48%|47.36%
1.3275|~2925|__o___o_x_o_____________________________________|16.89%|44.91%
1.3050|~315O|______o_x_o_____________________________________|18.29%|42.45%
1.2825|~3375|______o_x_o_____________x___x_______x___________|19.7%|40%
1.2600|~36OO|______o___o_x___________x_o_x_o_x___x_o_________|21.11%|37.54%
1.2375|~3825|__________o_x_o_________x_o_x_o_x_o_x_o_________|22.52%|35.08%
1.2150|~4O5O|__________o_x_o_________x_o_x_o_x_o_x_o_________|23.93%|32.63%
1.1925|~4275|__________o_x_o_________x_o_x_o_x_o___o_________|25.34%|30.17%
1.1700|~45OO|__________o___o_x_______x_o_x_o_______o_________|26.75%|27.72%
1.1475|~4725|______________o_x_o_____x_o___________o_x_______|28.16%|25.26%
1.1250|~495O|______________o_x_o_____x_____________o_x_o_____|29.56%|22.8%
1.1025|~5175|______________o_x_o_____x_____________o_x_o_____|30.97%|20.35%
1.0800|~54OO|==============o===o=====x=============o===o=x===|32.38%|17.89%
1.0575|~5625|__________________o_____x_________________o_x_o_|33.79%|15.43%
1.0350|~585O|__________________o_x___x_________________o_x_o_|35.2%|12.98%
1.0125|~6O75|==================o=x=o=x=================o===o=|36.61%|10.52%
0.9900|~63OO|__________________o_x_o_x_______________________|38.02%|8.07%
0.9675|~6525|__________________o_x_o_________________________|39.43%|5.61%
0.9450|~675O|__________________o_x___________________________|40.83%|3.15%
0.9225|~6975|__________________o_x___________________________|42.24%|0.7%
0.9000|~72OO|__________________o_____________________________|43.65%|-1.76%
Column|||||||3_113_6_6_104_8_4_126_3_146_6_5_4_3_4_9_3_6_3_3_|
Count
http://iticsoftware.com/postimages/2009-Jun-19/BJF-Trading-Group-USDCAD0130.PNG
http://iticsoftware.com/postimages/2009-Jun-19/BJF-Trading-Group-USDCAD0130.xls
Posted by: MDunleavy Feb 1, 2010, 11:55 AM
USDSEK review
=================
http://iticsoftware.com/postimages/2009-Aug-03/BJF-Trading-Group_Excel_Chart_USDSEK0201.PNG
http://iticsoftware.com/postimages/2009-Aug-03/BJF-Trading-Group_Excel_Chart_USDSEK0201.xls
Posted by: MDunleavy Feb 2, 2010, 08:27 AM
The AUDUSD failed to consistently move below 0.8810 yesterday and whipsawed to the upside, topped at 0.8919 and closed at 0.8910. The false breakdown below 0.8810 could produce a bullish momentum but we need a consistent move above 0.8910 to continue the bullish momentum targeting 0.8980 in nearest term, but the bearish scenario in long term should remains intact and only violation to the bearish channel could be seen as potential threat to the bearish scenario. Immediate support at 0.8880. Break below that area should trigger further bearish momentum back towards 0.8810 again.[Written by FX Instructor]
http://iticsoftware.com/postimages/2009-Jul-01/BJF-Trading-Group-AUDUSD0202.PNG
http://iticsoftware.com/postimages/2009-Jul-01/BJF-Trading-Group_Excel_Chart-AUDUSD0202.xls
Posted by: MDunleavy Feb 8, 2010, 09:52 AM
EUR/USD Weekly Outlook
EUR/USD dropped sharply to as low as 1.3585 last week and the strong break of 1.3737 cluster support further confirm our view that three wave consolidation from 1.2329 has completed at 1.5143 already. Initial bias remains on the downside this week for 61.8% retracement of 1.2329 to 1.5143 at 1.3404 first. Break will target 161.8% projection of 1.5143 to 1.4217 from 1.4578 at 1.3076 next. On the upside, above 1.3744 minor resistance will turn intraday bias neutral and bring consolidations. But upside should be limited below 1.4025 resistance and bring fall resumption.
In the bigger picture, three wave rise from 1.2329 is treated as consolidation to fall from 1.6039 only and should have completed at 1.5143 already. Fall from 1.5143 is tentatively treated as resumption of the whole down trend form 1.6039 and should target a new low below 1.2329. Break of 1.4217 resistance is needed to be the first signal of medium term bottoming. Otherwise, outlook will remain bearish even in case of strong rebound.[Written by ActionForex.com]
"P&F EURUSD1440 Box Size 134X4 or(3.83%) CLOSE
Data 1.5997 - 1.1967 ~ 47 Month ~ 1425 Day
Database 1017 records 1.3628 (Last Close)
2006-03-16 00~00
2010-02-08 00~00 (GMT+01:00) Paris
http://iticsoftware.com chart"
1.6080|~134||______________________________________|-0.52%|34.37%
1.5946|~268||______x_______________________________|0.32%|33.25%
1.5812|~4O2||______x_o_x___________________________|1.16%|32.13%
1.5678|~536||______x_o_x_o_________________________|1.99%|31.01%
1.5544|~67O||______x_o_x_o_________________________|2.83%|29.89%
1.5410|~8O4||______x_o_x_o_________________________|3.67%|28.77%
1.5276|~938||______x_o___o_________________________|4.51%|27.65%
1.5142|~1O72|______x_____o_________________________|5.34%|26.53%
1.5008|~12O6|______x_____o_____________________x___|6.18%|25.41%
1.4874|~134O|______x_____o_____________________x_o_|7.02%|24.29%
1.4740|~1474|__x___x_____o_x___________________x_o_|7.86%|23.17%
1.4606|~16O8|__x_o_x_____o_x_o_________________x_o_|8.7%|22.05%
1.4472|~1742|__x_o_x_____o_x_o_________________x_o_|9.53%|20.93%
1.4338|~1876|__x_o_x_____o_x_o_____x___________x_o_|10.37%|19.81%
1.4204|~2O1O|__x_o_______o_x_o_____x_o_____x___x_o_|11.21%|18.69%
1.4070|~2144|__x_________o_x_o_____x_o_____x_o_x_o_|12.05%|17.57%
1.3936|~2278|__x_________o___o_____x_o_____x_o_x_o_|12.88%|16.45%
1.3802|~2412|__x_____________o_____x_o_____x_o_x_o_|13.72%|15.33%
1.3668|~2546|__x_____________o_____x_o_____x_o___o_|14.56%|14.21%
1.3534|~268O|__x_____________o_____x_o_x___x_____o_|15.4%|13.09%
1.3400|~2814|__x_____________o_____x_o_x_o_x_______|16.23%|11.97%
1.3266|~2948|__x_____________o_____x_o_x_o_x_______|17.07%|10.85%
1.3132|~3O82|__x_____________o_____x_o_x_o_x_______|17.91%|9.74%
1.2998|~3216|__x_____________o_____x_o_x_o_x_______|18.75%|8.62%
1.2864|~335O|__x_____________o_x___x_o_x_o_________|19.58%|7.5%
1.2730|~3484|__x_____________o_x_o_x_o_x___________|20.42%|6.38%
1.2596|~3618|__x_____________o_x_o_x_o_x___________|21.26%|5.26%
1.2462|~3752|__x_____________o_x_o_x_o_____________|22.1%|4.14%
1.2328|~3886|__x_____________o___o_________________|22.94%|3.02%
1.2194|~4O2O|o_x___________________________________|23.77%|1.9%
1.2060|~4154|o_x___________________________________|24.61%|0.78%
1.1926|~4288|o_____________________________________|25.45%|-0.34%
Column|||||||3_214135_4_146_184_4_15148_5_104_1011_|100%|-100%
Count
http://iticsoftware.com/postimages/2009-Aug-03/BJF-Trading-Group-EURUSD0208_xls.PNG
http://iticsoftware.com/postimages/2009-Aug-03/BJF-Trading-Group-EURUSD0208.xls
Posted by: MDunleavy Feb 10, 2010, 11:00 AM
EUR/CHF Weekly Outlook
EUR/CHF dropped further to as low as 1.4557 last week and met mentioned 1.4577 key support level. However, the cross the rebounded strongly on SNB intervention and before settling at 1.4667. Initial bias remains neutral this week and we'd expect some more sideway consolidations in near term. The range of the consolidation is not defined yet and another rise to above 1.4820 cannot be ruled out. But we'd expect strong resistance ahead of 1.5 psychological level to limit any rebound attempt.
In the bigger picture, with EUR/CHF still staying well below 55 weeks EMA, fall from 1.5880 is likely still in progress. The test of 1.4577 key support is already done but near term downside should be limited on risk of further intervention from SNB. We'd expect some choppy sideway consolidations below 1.5 psychological level first before down trend finally resume for a test of 1.4315 low. Sustained trading above 1.5 psychological level is needed to invalidate this bearish view.
In the long term picture, the corrective three wave structure of the rise from 1.4391 to 1.6827 is arguing that fall from 1.6827 is resumption of long term down trend from 1.8234. EUR/CHF's failure to take out 55 weeks EMA suggests that whole fall from 1.6827 is still in progress. Sustained break of 1.4577 support will affirm this case and bring another low below 1.4315 to resume the long term down trend.[Written by ActionForex.com]
"P&F EURCHF1440 Box Size 80X4 or(2.05%) CLOSE
Data 1.6796 - 1.4418 ~ 92 Month ~ 2809 Day
Database 2000 records 1.4661 (Last Close)
2002-06-03 00~00
2010-02-10 00~00 (GMT+01:00) Paris
http://iticsoftware.com chart"
1.6800|~8O|||________________________________________|-0.02%|16.52%
1.6720|~16O||________________X_______________________|0.45%|15.97%
1.6640|~24O||______________X_XoX_____________________|0.93%|15.41%
1.6560|~32O||______________XoXoXo____________________|1.41%|14.86%
1.6480|~4OO||______________XoXoXo____________________|1.88%|14.3%
1.6400|~48O||______________XoXoXo____________________|2.36%|13.75%
1.6320|~56O||______________XoXoXoX_X_________________|2.83%|13.19%
1.6240|~64O||____________X_Xo_o_oXoXo________________|3.31%|12.64%
1.6160|~72O||____________XoX____oXoXo________________|3.79%|12.08%
1.6080|~8OO||____________XoX____oXoXo________________|4.26%|11.53%
1.6000|~88O||____________XoX____oXo_o________________|4.74%|10.97%
1.5920|~96O||____________Xo_____oX__o________________|5.22%|10.42%
1.5840|~1O4O|____________X______oX__o____X___________|5.69%|9.86%
1.5760|~112O|____X_____X_X______oX__o____Xo__________|6.17%|9.31%
1.5680|~12OO|__X_Xo____XoX______oX__o____Xo__________|6.64%|8.75%
1.5600|~128O|__XoXo__X_XoX______oX__o____Xo__________|7.12%|8.2%
1.5520|~136O|__XoXoX_XoXoX______oX__o____Xo__________|7.6%|7.64%
1.5440|~144O|__XoXoXoXoXo_______o___o__X_Xo__________|8.07%|7.09%
1.5360|~152O|__Xo_oXoXoX____________o__XoXo______X___|8.55%|6.53%
1.5280|~16OO|__X__oXoXo_____________o__XoXo______XoX_|9.03%|5.98%
1.5200|~168O|__X__oXoX______________o__XoXo______XoXo|9.5%|5.42%
1.5120|~176O|__X__oXoX______________o__Xo_oX_X_X_XoXo|9.98%|4.87%
1.5040|~184O|__X__o_o_______________oX_X__oXoXoXoXoXo|10.45%|4.31%
1.4960|~192O|__X____________________oXoX__oXoXoXoXo_o|10.93%|3.76%
1.4880|~2OOO|__X____________________oXoX__oXoXoXoX__o|11.41%|3.2%
1.4800|~2O8O|__X____________________oXoX__oXoXo_oX__o|11.88%|2.65%
1.4720|~216O|X_X____________________oXo___o_oX__oX__o|12.36%|2.09%
1.4640|~224O|_oX____________________oX______o___oX__o|12.84%|1.54%
1.4560|~232O|_oX____________________oX__________o____|13.31%|0.98%
1.4480|~24OO|_oX____________________oX_______________|13.79%|0.43%
1.4400|~248O|_o_____________________o________________|14.27%|-0.12%
Column|~256O|1414596674641495665114428494915664471548|
Count||||||||__6_________O______51__4_____4______O___|
http://iticsoftware.com/postimages/2009-Aug-03/BJF-Trading-Group-EURCHF0210.PNG
http://iticsoftware.com/postimages/2009-Aug-03/bjf-trading-group-eurchf0210.gif
http://iticsoftware.com/postimages/2009-Aug-03/BJF-Trading-Group-EURCHF0210.xls
Posted by: MDunleavy Feb 11, 2010, 01:01 PM
GBP/JPY
The GBP/JPY pair succeeded in achieving the expected bearishness yesterday, seen on the secondary four-hour chart. We still believe that additional downside movements could be witnessed over intraday basis, supported by the previous explained Elliott scenario. A break of 139.90 will confirm and accelerate the suggested negative scenario.
The trading range for the week is among key support at 135.50 and key resistance at 144.15.
The general trend is to the downside as far as 167.40 remains intact with target at 116.00.
Support: 140.00, 139.25, 138.60, 137.90, 137.25
Resistance: 141.00, 141.50, 142.25, 142.75, 143.45
Recommendation Based on the charts and explanations above our opinion is, selling the pair with a breakout below 139.90 targeting 137.60 and stop loss above 141.60 might be appropriate.[Written by ecPulse.com]
"P&F GBPJPY1440 Box Size 425X3 or(6.89%) CLOSE
Data 251.09 - 118.81 ~ 92 Month ~ 2809 Day
Database 2000 records 140.061 (Last Close)
2002-06-04 00~00
2010-02-11 00~00 (GMT+01:00) Paris
http://iticsoftware.com chart"
250.75|~425||____________________________________________________|0.14%|111.05%
246.50|~85O||____________________________x_______________________|1.83%|107.47%
242.25|~1275|____________________________x_o_____________________|3.52%|103.9%
238.00|~17OO|________________________x___x_o_x___________________|5.21%|100.32%
233.75|~2125|________________________x_o_x_o_x_o_________________|6.91%|96.74%
229.50|~255O|________________________x_o_x_o_x_o_________________|8.6%|93.17%
225.25|~2975|________________________x_o_x_o___o_________________|10.29%|89.59%
221.00|~34OO|________________________x_o_______o_________________|11.98%|86.01%
216.75|~3825|________________________x_________o_________________|13.68%|82.43%
212.50|~425O|____________________x___x_________o_x_______________|15.37%|78.86%
208.25|~4675|____________________x_o_x_________o_x_o_____________|17.06%|75.28%
204.00|~51OO|________x___x___x___x_o_x_________o_x_o_____________|18.75%|71.7%
199.75|~5525|________x_o_x_o_x_o_x_o___________o_x_o_____________|20.45%|68.13%
195.50|~595O|x___x___x_o_x_o_x_o_x_____________o_x_o_____________|22.14%|64.55%
191.25|~6375|x_o_x_o_x_o___o_x_o_______________o___o_____________|23.83%|60.97%
187.00|~68OO|x_o_x_o_x_____o_______________________o_____________|25.52%|57.39%
182.75|~7225|x_o___o_x_____________________________o_____________|27.22%|53.82%
178.50|~765O|______o_______________________________o_____________|28.91%|50.24%
174.25|~8O75|______________________________________o_____________|30.6%|46.66%
170.00|~85OO|______________________________________o_____________|32.3%|43.09%
165.75|~8925|______________________________________o_____________|33.99%|39.51%
161.50|~935O|______________________________________o_____x___x___|35.68%|35.93%
157.25|~9775|======================================o=x===x=o=x=o=|37.37%|32.35%
153.00|~1O2O|______________________________________o_x_o_x_o_x_o_|39.07%|28.78%
148.75|~1O62|______________________________________o_x_o_x_o___o_|40.76%|25.2%
144.50|~11O5|______________________________________o___o_x_____o_|42.45%|21.62%
140.25|~1147|__________________________________________o_x_____o_|44.14%|18.05%
136.00|~119O|==========================================o=x=====o=|45.84%|14.47%
131.75|~1232|__________________________________________o_x_______|47.53%|10.89%
127.50|~1275|__________________________________________o_x_______|49.22%|7.31%
123.25|~1317|__________________________________________o_x_______|50.91%|3.74%
119.00|~136O|__________________________________________o_________|52.61%|0.16%
114.75|~14O2|____________________________________________________|54.3%|-3.42%
Column|~1445|4_3_3_4_6_3_3_4_4_3_5_3_9_4_6_5_3_115_163_9_103_3_6_|
Count
http://iticsoftware.com/postimages/2009-Jul-01/BJF-Trading-Group-GBPJPY0211.PNG
http://iticsoftware.com/postimages/2009-Jul-01/BJF-Trading-Group-GBPJPY0211.xls
Posted by: HGNR Feb 12, 2010, 01:02 AM
Wow...Manual chart... I think you are very good can create a menual chart like that...
BTW what is your basic analisis?...
Thanks
Posted by: MDunleavy Feb 13, 2010, 09:33 PM
NZDUSD review
61.8% retracement ratio of the .7150-.6805 downward move currently limits the upside at .7020 but the kiwi dollar maintains its bid tone against the dollar - thus intra-day studies being bullish while writing this. Extended gains may open .7150 which is a more notable upside barrier. Above the .7100 mark, short-term sentiment turns positive. On the south side - breaching below intra-day support at .6900/30 would cancel the bullish structure, resuming downtrend. Current quote is .6991 @07:00 GMT[Written by Innerfx]
Support: .6950, .6900/30, .6850/60, .6800 and .6750
Resistance: .7000/20, .7100 and .7150
Market sentiment: long term - bullish, medium term - slightly bearish, short term - bearish, intra-day - bullish
"P&F NZDUSD1440 Box Size 121X4 or(7.62%) HI/LO
Data 0.8214 - 0.4485 ~ 92 Month ~ 2809 Day
Database 2000 records 0.69722 (Last Close)
2002-06-05 00~00
2010-02-12 00~00 (GMT+01:00) Paris
http://iticsoftware.com chart"
0.8228|~121||__________________________________|-0.17%|83.46%
0.8107|~242||__________x___x_o_________________|1.3%|80.76%
0.7986|~363||__________x_o_x_o_________________|2.78%|78.06%
0.7865|~484||__________x_o_x_o_________________|4.25%|75.36%
0.7744|~6O5||__________x_o_x_o_________________|5.72%|72.66%
0.7623|~726||__________x_o_x_o_____________x___|7.2%|69.97%
0.7502|~847||__________x_o_x_o_____________x_o_|8.67%|67.27%
0.7381|~968||______x___x_o_x_o_____________x_o_|10.14%|64.57%
0.7260|~1O89|______x_o_x_o_x_o_____________x_o_|11.61%|61.87%
0.7139|~121O|______x_o_x_o_x_o_____________x_o_|13.09%|59.18%
0.7018|~1331|==x===x=o=x=o=x=o=============x=o=|14.56%|56.48%
0.6897|~1452|__x_o_x_o_x_o_x_o_____________x_o_|16.03%|53.78%
0.6776|~1573|__x_o_x_o_x_o_x_o_____________x___|17.51%|51.08%
0.6655|~1694|__x_o_x_o_x_o___o_____________x___|18.98%|48.38%
0.6534|~1815|__x_o_x_o_x_____o_____________x___|20.45%|45.69%
0.6413|~1936|__x_o_x_o_x_____o_____________x___|21.93%|42.99%
0.6292|~2O57|__x_o_x_o_x_____o_x___________x___|23.4%|40.29%
0.6171|~2178|__x_o_x_o_x_____o_x_o_________x___|24.87%|37.59%
0.6050|~2299|__x_o_x_o_x_____o_x_o_x___x___x___|26.35%|34.89%
0.5929|~242O|__x_o___o_______o_x_o_x_o_x_o_x___|27.82%|32.2%
0.5808|~2541|__x_____________o___o_x_o_x_o_x___|29.29%|29.5%
0.5687|~2662|__x_________________o_x_o_x_o_x___|30.76%|26.8%
0.5566|~2783|__x_________________o_x_o_x_o_x___|32.24%|24.1%
0.5445|~29O4|__x_________________o___o_x_o_x___|33.71%|21.4%
0.5324|~3O25|__x_____________________o_x_o_x___|35.18%|18.71%
0.5203|~3146|__x_____________________o___o_x___|36.66%|16.01%
0.5082|~3267|__x_________________________o_x___|38.13%|13.31%
0.4961|~3388|o_x_________________________o_____|39.6%|10.61%
0.4840|~35O9|o_x_______________________________|41.08%|7.92%
0.4719|~363O|o_x_______________________________|42.55%|5.22%
0.4598|~3751|o_________________________________|44.02%|2.52%
0.4477|~3872|__________________________________|45.5%|-0.18%
Column|~3993|4_209_1212181212204_7_5_7_7_9_226_|
Count
http://iticsoftware.com/postimages/2009-Aug-03/BJF-Trading-Group-NzdUsd0213.PNG
http://iticsoftware.com/postimages/2009-Aug-03/BJF-Trading-Group-NzdUsd0213.xls
Posted by: MDunleavy Feb 15, 2010, 06:09 PM
AUDJPY
Friday's breakout above the 80.00 handle was canceled by the news from China's central bank which surprised the markets by saying it is raising reserve requirements by 50 basis points, the 2nd such increase this year. Therefore my strategy to buy on break of 80.00 was affected and a good trade turned bad - from 30 points profit to the stop loss in few minutes. Upside is back in focus now and a re-test of Friday's top is likely. However, in case of extended gains - I expect solid selling within the 81.00-81.20 range. Short-term sentiment is slightly bullish but the whole upward move is, so far, corrective in nature. Current quote is 79.80 @07:20 GMT [Written by Innerfx]
"P&F AUDJPY1440 Box Size 170X4 or(8.31%) HI/LO
Data 107.42 - 56.23 ~ 92 Month ~ 2797 Day
Database 2000 records 80.116 (Last Close)
2002-06-20 00~00
2010-02-15 00~00 (GMT+01:00) Paris
http://iticsoftware.com chart"
108.8|~17O||_____________________________|-1.28%|93.49%
107.1|~34O||_____X_X_____________________|0.3%|90.47%
105.4|~51O||_____XoXo____________________|1.88%|87.44%
103.7|~68O||_____XoXo__X_________________|3.46%|84.42%
102.0|~85O||_____XoXo__Xo________________|5.05%|81.4%
100.3|~1O2O|_____XoXoX_Xo________________|6.63%|78.37%
98.60|~119O|_____XoXoXoXo________________|8.21%|75.35%
96.90|~136O|_____XoXoXoXo________________|9.79%|72.33%
95.20|~153O|_____XoXoXoXo________________|11.38%|69.3%
93.50|~17OO|_____XoXoXoXo________________|12.96%|66.28%
91.80|~187O|_____XoXoXoXo________________|14.54%|63.26%
90.10|~2O4O|___X_XoXo_oXoX_______________|16.12%|60.23%
88.40|~221O|___XoXoX__o_oXo______________|17.71%|57.21%
86.70|~238O|___XoXo_____oXo______________|19.29%|54.19%
85.00|~255O|=X=XoX======oXo==========X=X=|20.87%|51.16%
83.30|~272O|_XoXo_______oXo__________XoXo|22.45%|48.14%
81.60|~289O|_XoX________o_o__________XoXo|24.04%|45.12%
79.90|~3O6O|_XoX__________o________X_XoXo|25.62%|42.09%
78.20|~323O|_XoX__________o________XoXo_o|27.2%|39.07%
76.50|~34OO|=XoX==========o========XoX==o|28.78%|36.05%
74.80|~357O|_Xo___________o________XoX___|30.37%|33.03%
73.10|~374O|_X____________o__X_____XoX___|31.95%|30%
71.40|~391O|_X____________oX_Xo____Xo____|33.53%|26.98%
69.70|~4O8O|_X____________oXoXoX___X_____|35.11%|23.96%
68.00|~425O|oX____________oXoXoXoX_X_____|36.7%|20.93%
66.30|~442O|oX____________oXoXoXoXoX_____|38.28%|17.91%
64.60|~459O|oX____________o_o_oXoXoX_____|39.86%|14.89%
62.90|~476O|o_________________oXoXoX_____|41.44%|11.86%
61.20|~493O|__________________oXoXoX_____|43.03%|8.84%
59.50|~51OO|__________________oXoXoX_____|44.61%|5.82%
57.80|~527O|__________________oXo_oX_____|46.19%|2.79%
56.10|~544O|__________________o___o______|47.78%|-0.23%
Column||||||41694111167915144518767158445|
Count
http://iticsoftware.com/postimages/2009-Aug-03/BJF-Trading-Group-AUDJPY0215.PNG
http://iticsoftware.com/postimages/2009-Aug-03/BJF-Trading-Group-AUDJPY0215.xls
Posted by: MDunleavy Feb 16, 2010, 11:44 AM
CADJPY=USDJPY:CADJPY
---------------------
JPY
Unbelievably slow work, with relatively small daily ranges suggesting a lot of uncertainty at current prices. The Yen is consolidating in the middle of a decent-sized flat-bottomed daily Ichimoku 'cloud'. Fibonacci retracement support at the 61% level will probably limit the downside this week (and maybe the following one too) with prices hopefully holding under the 26-day moving average at 90.62 today. Apart from the 'cloud' all other elements of this chart suggest a short position, and note that the Lagging Span will encounter resistance from the candles next week. The US dollar is not in the least bit oversold against the yen and momentum is neutral. Futures volume is well down on the previous week and open interest too.[Written by Mizuho Corporate Bank]
CAD
The gradual descend that the pair is achieving in attempt to touch the awaited pivotal support at 1.0410, accompanied by momentum indicators entering oversold areas which support our previous expectations heading towards an expected bullish intraday that might require a base to be built on mentioned support before achieving the target for the awaited bullish direction that start at 1.0565 then 1.0650. These expectations require the four hour closing to be above 1.0410 to prevail.[Written by ecPulse.com]
"P&F CADJPY1440 Box Size 180X3 or(5.51%) CLOSE
Data 125.09 - 70.85 ~ 59 Month ~ 1785 Day
Database 1278 records 85.809 (Last Close)
2005-03-29 00~00
2010-02-16 00~00 (GMT+01:00) Paris
http://iticsoftware.com chart"
126.0|~18O||______________________________________|-0.73%|77.84%
124.2|~36O||____________X_________________________|0.71%|75.3%
122.4|~54O||____________Xo________________________|2.15%|72.76%
120.6|~72O||____________Xo________________________|3.59%|70.22%
118.8|~9OO||____________Xo________________________|5.03%|67.68%
117.0|~1O8O|__________X_Xo________________________|6.47%|65.14%
115.2|~126O|__________XoXoX_______________________|7.91%|62.6%
113.4|~144O|__________XoXoXo______________________|9.35%|60.06%
111.6|~162O|__________XoXoXo______________________|10.78%|57.52%
109.8|~18OO|__________XoXoXo______________________|12.22%|54.98%
108.0|~198O|__________XoXo_oX_____________________|13.66%|52.43%
106.2|~216O|______X___Xo___oXoX___________________|15.1%|49.89%
104.4|~234O|__X___XoX_X____oXoXo__________________|16.54%|47.35%
102.6|~252O|__XoX_XoXoX____oXoXoX_________________|17.98%|44.81%
100.8|~27OO|__XoXoXoXoX____o_oXoXo________________|19.42%|42.27%
99.00|~288O|__XoXoXo_oX______oXoXo________________|20.86%|39.73%
97.20|~3O6O|__Xo_o___o_______oXo_o________________|22.3%|37.19%
95.40|~324O|__X______________o___o________________|23.73%|34.65%
93.60|~342O|__X__________________o________________|25.17%|32.11%
91.80|~36OO|__X__________________o________________|26.61%|29.57%
90.00|~378O|==X==================o==========X===X=|28.05%|27.03%
88.20|~396O|__X__________________o________X_Xo__Xo|29.49%|24.49%
86.40|~414O|_oX__________________oX_______XoXoX_Xo|30.93%|21.95%
84.60|~432O|_oX__________________oXo____X_XoXoXoXo|32.37%|19.41%
82.80|~45OO|_o___________________oXo____XoXoXoXoXo|33.81%|16.87%
81.00|~468O|=====================oXo====XoXoXo=o==|35.25%|14.33%
79.20|~486O|_____________________oXo____Xo_o______|36.69%|11.79%
77.40|~5O4O|_____________________oXoX_X_X_________|38.12%|9.24%
75.60|~522O|_____________________oXoXoXoX_________|39.56%|6.7%
73.80|~54OO|_____________________oXoXoXoX_________|41%|4.16%
72.00|~558O|_____________________oXo_o_oX_________|42.44%|1.62%
70.20|~576O|_____________________o_____o__________|43.88%|-0.92%
Column||||||O3143354341619484765319833348355653354|
Count|||||||__2_______1_O________8________________|
http://iticsoftware.com/postimages/2009-Jun-19/BJF-Trading-Group-CADJPY0216.PNG
http://iticsoftware.com/postimages/2009-Jun-19/BJF-Trading-Group-CADJPY0216.xls
Posted by: MDunleavy Feb 17, 2010, 08:49 AM
Canadian dollar continue to be the biggest winner in worldwide concern of sovereign risks due to it's relatively low deficit and healthy fiscal position. Canadian dollar is up 4% against Sterling and 3.9% against Euro. EUR/CAD dipped further to as low as 1.4224 so far as the down trend continued and is still on course for 1.4 psychological level and then 100% projection of 1.7499 to 1.5183 from 1.6006 at 1.3690. A break above 1.4681 resistance is needed to be the first sign of stabilization or outlook will remain bearish.[Written by ActionForex.com]
"P&F EURCAD1440 Box Size 135X5 or(4.39%) HI/LO
Data 1.7499 - 1.3285 ~ 93 Month ~ 2837 Day
Database 2000 records 1.43752 (Last Close)
2002-05-13 00~00
2010-02-17 00~00 (GMT+01:00) Paris
http://iticsoftware.com chart"
1.7550|~135||____________________________________|-0.29%|32.1%
1.7415|~27O||________________________X___________|0.48%|31.09%
1.7280|~4O5||________________________Xo__________|1.25%|30.07%
1.7145|~54O||________________________Xo__________|2.02%|29.06%
1.7010|~675||________________________Xo__________|2.79%|28.04%
1.6875|~81O||________X_______________Xo__X_______|3.57%|27.02%
1.6740|~945||________XoX_____________Xo__Xo______|4.34%|26.01%
1.6605|~1O8O|__X_____XoXoX___________XoX_Xo______|5.11%|24.99%
1.6470|~1215|__Xo____XoXoXo__________XoXoXo______|5.88%|23.97%
1.6335|~135O|__Xo____XoXoXo________X_XoXoXo______|6.65%|22.96%
1.6200|~1485|__XoX___XoXoXo____X_X_XoXoXoXoX_____|7.42%|21.94%
1.6065|~162O|__XoXoX_XoXoXo____XoXoXoXoXoXoXoX___|8.19%|20.93%
1.5930|~1755|X_XoXoXoXoXoXo____XoXoXoXoXoXoXoXoX_|8.97%|19.91%
1.5795|~189O|XoXoXoXoXo_oXo____XoXoXoXo_oXoXoXoXo|9.74%|18.89%
1.5660|~2O25|XoXoXoXoX__oXoX___XoXoXoX__o_oXoXoXo|10.51%|17.88%
1.5525|~216O|XoXo_oXoX__oXoXo__XoXoXoX____oXoXoXo|11.28%|16.86%
1.5390|~2295|XoX__oXoX__o_oXo__Xo_oXoX____o_oXoXo|12.05%|15.84%
1.5255|~243O|XoX__o_oX____oXo__X__oXoX______o_o_o|12.82%|14.83%
1.5120|~2565|Xo_____oX____oXo__X__oXoX__________o|13.6%|13.81%
1.4985|~27OO|X______o_____oXoX_X__oXoX__________o|14.37%|12.8%
1.4850|~2835|X____________oXoXoX__o_o___________o|15.14%|11.78%
1.4715|~297O|X____________oXoXoX________________o|15.91%|10.76%
1.4580|~31O5|X____________oXoXoX________________o|16.68%|9.75%
1.4445|~324O|X____________oXoXoX________________o|17.45%|8.73%
1.4310|~3375|X============oXoXoX================o|18.22%|7.72%
1.4175|~351O|X____________oXoXo__________________|19%|6.7%
1.4040|~3645|_____________oXoX___________________|19.77%|5.68%
1.3905|~378O|_____________oXoX___________________|20.54%|4.67%
1.3770|~3915|_____________oXoX___________________|21.31%|3.65%
1.3635|~4O5O|_____________oXoX___________________|22.08%|2.63%
1.3500|~4185|_____________o_oX___________________|22.85%|1.62%
1.3365|~432O|_______________o____________________|23.62%|0.6%
1.3230|~4455|____________________________________|24.4%|-0.41%
Column|~459O|161857681871921116166111116791676651|
Count|~4725||4_1_____4__O_3672_5__O1192___1_____2|
http://iticsoftware.com/postimages/2009-Jun-19/BJF-Trading-Group-EURCAD0217.PNG
http://iticsoftware.com/postimages/2009-Jun-19/BJF-Trading-Group-EURCAD0217.xls
Posted by: MDunleavy Feb 18, 2010, 11:08 PM
Although the greenback rose to as high as 1.0827 today, as the currency pair retreated after failing to break resistance at 1.0829, suggesting further consolidation within 1.0647-1.0829 range would take place and below the convergence of the Tenkan-Sen and Kijun-Sen (now both at 1.0737) would bring another corrective fall to 1.0680 but said lower level should remain intact, bring another rally later. Above said resistance would confirm upmove from 2009 low of 0.9910 has resumed and extend gain towards 1.0870 (1.236 times projection of 0.9910 to 1.0509 measuring from 1.0130) but the greenback should falter well below 1.0939 (50% Fibonacci retracement of 1.1967 to 0.9910).
In view of this, we are still looking to buy dollar on pullback for such rise. Only breach of support at 1.0609 would confirm top has been formed and risk retracement to 1.0562 (38.2% Fibonacci retracement of 1.0130 to 1.0829) but reckon support at 1.0497 would remain intact.[Written by ActionForex]
"P&F USDCHF1440 Box Size 200X3 or(4.78%) CLOSE
Data 1.5248 - 0.9861 ~ 92 Month ~ 2800 Day
Database 2000 records 1.07766 (Last Close)
2002-06-20 00~00
2010-02-18 00~00 (GMT+01:00) Paris
BJF Trading Group"
http://iticsoftware.com chart"
1.5200|~2OO||_____________________________________|0.31%|54.14%
1.5000|~4OO||X_X__________________________________|1.63%|52.11%
1.4800|~6OO||_oXo_________________________________|2.94%|50.09%
1.4600|~8OO||_oXo_________________________________|4.25%|48.06%
1.4400|~1OOO|_o_o_________________________________|5.56%|46.03%
1.4200|~12OO|___o_________________________________|6.87%|44%
1.4000|~14OO|___oX_X______________________________|8.18%|41.97%
1.3800|~16OO|___oXoXo_____________________________|9.5%|39.95%
1.3600|~18OO|___oXoXoX____________________________|10.81%|37.92%
1.3400|~2OOO|___oXoXoXo___________________________|12.12%|35.89%
1.3200|~22OO|___o_oXoXo__________X_X______________|13.43%|33.86%
1.3000|~24OO|_____oXo_oX_______X_XoXo_____________|14.74%|31.83%
1.2800|~26OO|_____o___oXoX_X___XoXoXo_____________|16.05%|29.8%
1.2600|~28OO|_________oXoXoXo__XoXoXoX____________|17.37%|27.78%
1.2400|~3OOO|_________oXoXoXo__XoXo_oXoX__________|18.68%|25.75%
1.2200|~32OO|_________o_o_o_oX_Xo___oXoXo____X____|19.99%|23.72%
1.2000|~34OO|_______________oXoX____oXoXo____Xo___|21.3%|21.69%
1.1800|~36OO|_______________oXoX____o_o_o____XoX__|22.61%|19.66%
1.1600|~38OO|_______________oXoX________o____XoXo_|23.92%|17.64%
1.1400|~4OOO|_______________oXo_________oX___XoXo_|25.24%|15.61%
1.1200|~42OO|_______________o___________oXoX_XoXo_|26.55%|13.58%
1.1000|~44OO|___________________________oXoXoXoXo_|27.86%|11.55%
1.0800|~46OO|___________________________o_oXoXoXo_|29.17%|9.52%
1.0600|~48OO|_____________________________oXo_oXoX|30.48%|7.49%
1.0400|~5OOO|_____________________________oX__o_oX|31.79%|5.47%
1.0200|~52OO|_____________________________oX____oX|33.11%|3.44%
1.0000|~54OO|_____________________________oX____oX|34.42%|1.41%
0.9800|~56OO|_____________________________o_____o_|35.73%|-0.62%
Column|~58OO|1339466537443338548454474438387389714|
Count||||||||___________________________________O_|
http://iticsoftware.com/postimages/2009-Jul-01/BJF-Trading-Group-USDCHF0208.PNG
http://img192.imageshack.us/i/bjftradinggroupdxy0208.gif/
http://iticsoftware.com/postimages/2009-Jul-01/BJF-Trading-Group-USDCHF0208.xls
Posted by: MDunleavy Feb 20, 2010, 07:49 PM
The main support 1.0410 stood strong against continuous attempts from the pair to bearishly reverse, where it rebounded and completed forming the bullish technical pattern that comes inline with the bullish pattern, shown yesterday, where the pair achieved more bullish movement. We expect an overall bullish direction over an intraday direction, which will start with the breach of the mentioned neckline to head towards main targets that start 1.0565 then 1.0650. It is vital that 1.0410 areas remain intact, which are vital factors in achieving the awaited bullish direction.
The trading range for today is among the key support at 1.0350 and the key resistance at 1.0650.
The general trend is to the downside as far as 1.1870 remains intact with targets at 1.0000.
[Written by ecPulse.com]
"P&F USDCAD1440 Box Size 225X3 or(5.38%) HI/LO
Data 1.6054 - 0.9058 ~ 94 Month ~ 2856 Day
Database 2038 records 1.0391 (Last Close)
2002-04-26 00~00
2010-02-19 00~00 (GMT+01:00) Paris
http://iticsoftware.com chart"
1.6200|~225||________________________________________|-0.91%|78.85%
1.5975|~45O||x_______________________________________|0.49%|76.36%
1.5750|~675||x_o_____________________________________|1.89%|73.88%
1.5525|~9OO||x_o_____________________________________|3.3%|71.4%
1.5300|~1125|x_o_____________________________________|4.7%|68.91%
1.5075|~135O|__o_____________________________________|6.1%|66.43%
1.4850|~1575|__o_____________________________________|7.5%|63.94%
1.4625|~18OO|__o_____________________________________|8.9%|61.46%
1.4400|~2O25|__o_____________________________________|10.3%|58.98%
1.4175|~225O|__o_x___________________________________|11.7%|56.49%
1.3950|~2475|__o_x_o_x_______________________________|13.11%|54.01%
1.3725|~27OO|__o_x_o_x_o_____________________________|14.51%|51.52%
1.3500|~2925|__o___o_x_o_____________________________|15.91%|49.04%
1.3275|~315O|______o_x_o_____________________________|17.31%|46.56%
1.3050|~3375|______o_x_o_____________________x_______|18.71%|44.07%
1.2825|~36OO|______o___o_________x___x___x___x_o_____|20.11%|41.59%
1.2600|~3825|__________o_x_______x_o_x_o_x_o_x_o_____|21.51%|39.1%
1.2375|~4O5O|__________o_x_o_____x_o_x_o_x_o_x_o_____|22.92%|36.62%
1.2150|~4275|__________o_x_o_____x_o_x_o___o_x_o_____|24.32%|34.14%
1.1925|~45OO|__________o___o_____x_o_x_____o___o_____|25.72%|31.65%
1.1700|~4725|______________o_x___x_o_x_________o_x___|27.12%|29.17%
1.1475|~495O|______________o_x_o_x_o___________o_x_o_|28.52%|26.68%
1.1250|~5175|______________o_x_o_x_____________o_x_o_|29.92%|24.2%
1.1025|~54OO|______________o___o_x_____________o_x_o_|31.33%|21.72%
1.0800|~5625|__________________o_x_____________o___o_|32.73%|19.23%
1.0575|~585O|__________________o_x_________________o_|34.13%|16.75%
1.0350|~6O75|__________________o_x_________________o_|35.53%|14.26%
1.0125|~63OO|__________________o_x___________________|36.93%|11.78%
0.9900|~6525|__________________o_x___________________|38.33%|9.3%
0.9675|~675O|__________________o_x___________________|39.73%|6.81%
0.9450|~6975|__________________o_x___________________|41.14%|4.33%
0.9225|~72OO|__________________o_____________________|42.54%|1.84%
0.9000|~7425|________________________________________|43.94%|-0.64%
Column|~765O|4_1136_5_9_3_7_3_1116_6_6_3_3_4_5_104_6_|
Count
http://iticsoftware.com/postimages/2009-Jul-01/BJF-Trading-Group-USDCAD0220.PNG http://iticsoftware.com/postimages/2009-Jul-01/bjf-trading-group-0220.gif
http://iticsoftware.com/postimages/2009-Jul-01/BJF-Trading-Group-USDCAD0220.xls
Posted by: MDunleavy Feb 24, 2010, 08:54 AM
GBP/USD closed higher due to short covering on Tuesday signalling a possible end to the two-day bounce off the 50% retracement level of the 2008-2009-rally crossing. The mid-range close sets the stage for a steady opening on Wednesday. Stochastics and the RSI are diverging but are turning neutral to bearish hinting that additional weakness is possible. If it extends the decline off January's high, the 62% retracement level of 2009's rally crossing is the next downside target. Closes above the 20-day moving average crossing are needed to confirm that a short-term low has been posted.[Written by HY Markets]
"P&F GBPUSD1440 Box Size 250X3 or(4.33%) HI/LO
Data 2.1161 - 1.3502 ~ 92 Month ~ 2799 Day
Database 2000 records 1.54478 (Last Close)
2002-06-27 00~00
2010-02-24 00~00 (GMT+01:00) Paris
http://iticsoftware.com chart"
2.1250|~25O||_____________________________________|-0.42%|57.38%
2.1000|~5OO||_________________X___________________|0.76%|55.53%
2.0750|~75O||_________________Xo__________________|1.94%|53.68%
2.0500|~1OOO|_______________X_Xo__________________|3.12%|51.83%
2.0250|~125O|_______________XoXoX_________________|4.31%|49.98%
2.0000|~15OO|_______________XoXoXo________________|5.49%|48.13%
1.9750|~175O|_______________Xo_oXo________________|6.67%|46.27%
1.9500|~2OOO|_________X_____X__o_o________________|7.85%|44.42%
1.9250|~225O|_________Xo____X____o________________|9.03%|42.57%
1.9000|~25OO|_____X___Xo__X_X____o________________|10.21%|40.72%
1.8750|~275O|_____XoX_Xo__XoX____o________________|11.39%|38.87%
1.8500|~3OOO|_____XoXoXo__XoX____oX_______________|12.58%|37.02%
1.8250|~325O|_____XoXoXoX_Xo_____oXo______________|13.76%|35.17%
1.8000|~35OO|_____XoXoXoXoX______oXo______________|14.94%|33.31%
1.7750|~375O|_____XoXo_oXoX______oXo______________|16.12%|31.46%
1.7500|~4OOO|_____Xo___o_oX______o_o______________|17.3%|29.61%
1.7250|~425O|_____X______o_________o______________|18.48%|27.76%
1.7000|~45OO|=====X================o==========X===|19.66%|25.91%
1.6750|~475O|___X_X________________o__________XoX_|20.84%|24.06%
1.6500|~5OOO|_X_XoX________________oX_________XoXo|22.03%|22.2%
1.6250|~525O|_XoXoX________________oXo________XoXo|23.21%|20.35%
1.6000|~55OO|_XoXoX________________oXo________XoXo|24.39%|18.5%
1.5750|~575O|oXoXo_________________oXo________Xo_o|25.57%|16.65%
1.5500|~6OOO|oXo===================o=oX=X=====X==o|26.75%|14.8%
1.5250|~625O|o_______________________oXoXoX___X___|27.93%|12.95%
1.5000|~65OO|________________________oXoXoXo__X___|29.11%|11.09%
1.4750|~675O|________________________o_oXoXoX_X___|30.3%|9.24%
1.4500|~7OOO|__________________________o_o_oXoX___|31.48%|7.39%
1.4250|~725O|______________________________oXoX___|32.66%|5.54%
1.4000|~75OO|______________________________oXoX___|33.84%|3.69%
1.3750|~775O|______________________________o_o____|35.02%|1.84%
1.3500|~8OOO|_____________________________________|36.2%|-0.01%
Column|||||||3545416547834739356314147344436441545|
Count||||||||_____3______________1_2__________3___|
http://iticsoftware.com/postimages/2009-Jul-01/BJF-Trading-Group-GbpUsd0224.PNG
http://iticsoftware.com/postimages/2009-Jul-01/BJF-Trading-Group-GbpUsd0224.xls
http://iticsoftware.com/postimages/2009-Jul-01/bjf-trading-group-gbpusd0224.gif
Posted by: MDunleavy Feb 25, 2010, 06:36 PM
As discussed before, Gold's choppy recovery from 1044.5 should have completed at 1131.5 already after failing to sustain above 1126.4 resistance. Intraday bias remains on the downside for the moment for 1044.5 low and below to extend the whole correction from 1227.5. On the upside, above 1108.8 minor resistance will turn intraday bias neutral again. Also, note that break of 1131.5 resistance now should confirm that fall from 1227.5 has completed with three waves down to 1044.5 and should bring retest of this high.
In the bigger picture, outlook remains broadly unchanged. Price actions from 1227.5 are treated as corrections to rise from 931.3 only. Hence, even in case of another fall, downside is expected to be contained by 100% projection of 1227.2 to 1075.2 from 1163 at 1010.7, which is close to 1000 psychological level and bring long term up trend resumption. Decisive break of 1163 resistance will indicate that such correction has already completed and the long term up trend is set to resume for another high above 1227.5.[Written by Oil N' Gold]
"P&F GOLD1440 Box Size30X2 or(7.98%) CLOSE
Data 1215.1 - 288.39 ~ 96 Month ~ 2943 Day
Database 2000 records 1094.73 (Last Close)
2002-02-04 00~00
2010-02-25 00~00 (GMT+01:00) Paris
http://iticsoftware.com chart"
1200.00|~3OOO|____________________________________X____|1.24%|316.1%
1170.00|~6OOO|____________________________________Xo___|3.71%|305.7%
1140.00|~9OOO|____________________________________XoX__|6.18%|295.3%
1110.00|~12OO|====================================XoXoX|8.65%|284.9%
1080.00|~15OO|____________________________________Xo_oX|11.12%|274.49%
1050.00|~18OO|====================================X==o=|13.59%|264.09%
1020.0|~21OOO|____________________________________X____|16.06%|253.69%
990.00|~24OOO|________________X_____________X_____X____|18.53%|243.29%
960.00|~27OOO|________________Xo__X_________Xo__X_X____|20.99%|232.88%
930.00|~3OOOO|________________XoX_Xo________XoX_XoX____|23.46%|222.48%
900.00|~33OOO|______________X_XoXoXoX_X_____XoXoXo_____|25.93%|212.08%
870.00|~36OOO|______________XoXoXoXoXoXo__X_Xo_oX______|28.4%|201.67%
840.00|~39OOO|______________Xo_o_o_oXoXo__XoX__o_______|30.87%|191.27%
810.00|~42OOO|______________X______oXo_oX_Xo___________|33.34%|180.87%
780.00|~45OOO|______________X______oX__oXoX____________|35.81%|170.47%
750.00|~48OOO|______________X______oX__oXo_____________|38.28%|160.06%
720.00|~51OOO|______________X______o___oX______________|40.75%|149.66%
690.00|~54OOO|________X___X_X__________o_______________|43.21%|139.26%
660.00|~57OOO|________XoX_XoX__________________________|45.68%|128.86%
630.00|~6OOOO|________XoXoXo___________________________|48.15%|118.45%
600.00|~63OOO|________XoXoX____________________________|50.62%|108.05%
570.00|~66OOO|______X_XoXo_____________________________|53.09%|97.65%
540.00|~69OOO|______XoXo_______________________________|55.56%|87.25%
510.00|~72OOO|______Xo_________________________________|58.03%|76.84%
480.00|~75OOO|______X__________________________________|60.5%|66.44%
450.00|~78OOO|____X_X__________________________________|62.97%|56.04%
420.00|~81OOO|__X_XoX__________________________________|65.43%|45.64%
390.00|~84OOO|__XoXo___________________________________|67.9%|35.23%
360.00|~87OOO|X_Xo_____________________________________|70.37%|24.83%
330.00|~9OOOO|XoX______________________________________|72.84%|14.43%
300.00|~93OOO|Xo_______________________________________|75.31%|4.03%
270.00|~96OOO|_________________________________________|77.78%|-6.38%
Column||||||||32423262654342925533486337424264234214232|
Count|||||||||____________________________________O____|
http://iticsoftware.com/postimages/2009-Jun-19/BJF-Trading-Group-Cold0225.PNG http://iticsoftware.com/postimages/2009-Aug-03/bjf-trading-group-gold0225.gif
http://iticsoftware.com/postimages/2009-Jun-19/BJF-Trading-Group-Cold0225.xls
Posted by: MDunleavy Feb 27, 2010, 09:00 PM
The GBP/CAD has been trading close to a bearish trend-line except one time as it crossed its trend but the bulls hadn't enough power to reverse the trend finally. After the GBP touched its first pivot resistance point which is on the same level as the trend-line the bears take control again and boosted the downward movement as the MACD tumbled. If also the pivot point will break it may clear the way through the 1.5925 level.
"P&F GBPCAD1440 Box Size 300X4 or(5.8%) CLOSE
Data 2.5359 - 1.6017 ~ 92 Month ~ 2814 Day
Database 2000 records 1.60165 (Last Close)
2002-06-14 00~00
2010-02-26 00~00 (GMT+01:00) Paris
http://iticsoftware.com chart"
2.5500|~3OO||____________________________________________________________|-0.56%|59.21%
2.5200|~6OO||____x___x___________________________________________________|0.63%|57.33%
2.4900|~9OO||x___x_o_x_o_x_______________________________________________|1.81%|55.46%
2.4600|~12OO|x_o_x_o_x_o_x_o_____________________________________________|2.99%|53.59%
2.4300|~15OO|x_o_x_o_x_o_x_o_____________________________________________|4.18%|51.71%
2.4000|~18OO|x_o_x_o_x_o_x_o_________x___________________________________|5.36%|49.84%
2.3700|~21OO|x_o_x_o_x_o___o_x___x___x_o_________________________________|6.54%|47.97%
2.3400|~24OO|x_o___o_x_____o_x_o_x_o_x_o_________________________________|7.73%|46.09%
2.3100|~27OO|x_____o_x_____o_x_o_x_o_x_o_x_______________________________|8.91%|44.22%
2.2800|~3OOO|x_____o_x_____o_x_o_x_o_x_o_x_o_____________________________|10.09%|42.35%
2.2500|~33OO|______o_x_____o_x_o___o___o_x_o_____________________________|11.27%|40.48%
2.2200|~36OO|______o_x_____o_x_________o_x_o_____________________________|12.46%|38.6%
2.1900|~39OO|______o_x_____o___________o_x_o_____________________________|13.64%|36.73%
2.1600|~42OO|______o___________________o_x_o_____________________________|14.82%|34.86%
2.1300|~45OO|__________________________o_x_o_____________________________|16.01%|32.98%
2.1000|~48OO|__________________________o_x_o_____________________________|17.19%|31.11%
2.0700|~51OO|__________________________o_x_o_x___________________________|18.37%|29.24%
2.0400|~54OO|__________________________o_x_o_x_o_x___x___x_______________|19.56%|27.36%
2.0100|~57OO|__________________________o_x_o_x_o_x_o_x_o_x_o_____________|20.74%|25.49%
1.9800|~6OOO|__________________________o___o_x_o_x_o_x_o_x_o_____________|21.92%|23.62%
1.9500|~63OO|______________________________o_x_o_x_o_x_o_x_o_____________|23.1%|21.75%
1.9200|~66OO|______________________________o_x_o___o___o_x_o_____________|24.29%|19.87%
1.8900|~69OO|______________________________o___________o_x_o_x___x_______|25.47%|18%
1.8600|~72OO|__________________________________________o___o_x_o_x_o_____|26.65%|16.13%
1.8300|~75OO|______________________________________________o_x_o_x_o_____|27.84%|14.25%
1.8000|~78OO|______________________________________________o_x_o_x_o_____|29.02%|12.38%
1.7700|~81OO|______________________________________________o___o_x_o_x___|30.2%|10.51%
1.7400|~84OO|__________________________________________________o_x_o_x_o_|31.39%|8.63%
1.7100|~87OO|__________________________________________________o_x_o_x_o_|32.57%|6.76%
1.6800|~9OOO|__________________________________________________o___o_x_o_|33.75%|4.89%
1.6500|~93OO|______________________________________________________o_x_o_|34.93%|3.02%
1.6200|~96OO|______________________________________________________o___o_|36.12%|1.14%
1.5900|~99OO|__________________________________________________________o_|37.3%|-0.73%
Column|~1O2O|8_5_6_12125_4_106_4_4_4_5_1411146_5_4_4_4_6_6_9_4_7_7_9_5_6_|
Count
http://iticsoftware.com/postimages/2009-Jul-01/BJF-Trading-Group-CbpCad0227.PNG http://iticsoftware.com/postimages/2009-Jul-01/bjf-trading-group-0227.gif
http://iticsoftware.com/postimages/2009-Jul-01/BJF-Trading-Group-CbpCad0227.xls
Posted by: MDunleavy Mar 2, 2010, 09:22 PM
EUR/USD is in a downtrend, after peaking at 1.5146 (Nov.25,2009). Technical indicators are neutral, and trading is situated below the 50- and 200-Day SMA, currently projected at 1.4793 and 1.4169.
Yesterday's break below 1.3550 cleared the road for another test at 1.3342-60 support area. The failure of that test shows, that the pair is still in the consolidation pattern below 1.3696. We continue to expect a break below 1.3442, which will mark the end of the prolonged corrective phase and will target directly 1.3231, en route to 1.3061.
"P&F EURUSD1440 Box Size 2250X3 or(5.26%) HI/LO
Data 1.5997 - 0.9663 ~ 92 Month ~ 2787 Day
Database 2000 records 1.3567 (Last Close)
2002-07-15 00~00
2010-03-02 00~00 (GMT+01:00) Paris
http://iticsoftware.com chart"
1.5975|~225||________________x_____o_x_______________________|0.14%|65.32%
1.5750|~45O||____________x_o_x_o_x_o_x_o_____________________|1.54%|62.99%
1.5525|~675||____________x_o_x_o_x_____o_____________________|2.95%|60.66%
1.5300|~9OO||____________x_____o_______o_____________________|4.36%|58.34%
1.5075|~1125|____________x_____________o_________________x___|5.76%|56.01%
1.4850|~135O|____________x_____________o_x_______________x_o_|7.17%|53.68%
1.4625|~1575|____________x_____________o_x_o_____x_______x_o_|8.58%|51.35%
1.4400|~18OO|____________x_____________o_x_o_____x_o_____x_o_|9.98%|49.02%
1.4175|~2O25|____________x_____________o_x_o_____x_o_____x_o_|11.39%|46.69%
1.3950|~225O|____________x_____________o___o_____x_o_____x_o_|12.8%|44.37%
1.3725|~2475|____________x_________________o_____x_o_x___x_o_|14.2%|42.04%
1.3500|~27OO|________x___x_________________o_____x_o_x_o_x_o_|15.61%|39.71%
1.3275|~2925|________x_o_x_________________o_x___x_o_x_o_x___|17.02%|37.38%
1.3050|~315O|________x_o_x_________________o_x_o_x_o_x_o_____|18.42%|35.05%
1.2825|~3375|____x___x_o_x_________________o_x_o_x_o_x_______|19.83%|32.72%
1.2600|~36OO|____x_o_x_o_x_________________o_x_o___o_________|21.24%|30.39%
1.2375|~3825|____x_o_x_o_x_________________o_________________|22.64%|28.07%
1.2150|~4O5O|____x_o_x_o_x___________________________________|24.05%|25.74%
1.1925|~4275|x___x_o___o_x___________________________________|25.45%|23.41%
1.1700|~45OO|x_o_x_____o_____________________________________|26.86%|21.08%
1.1475|~4725|x_o_x___________________________________________|28.27%|18.75%
1.1250|~495O|x_o_x___________________________________________|29.67%|16.42%
1.1025|~5175|x_o_x___________________________________________|31.08%|14.1%
1.0800|~54OO|x_o_____________________________________________|32.49%|11.77%
1.0575|~5625|x_______________________________________________|33.89%|9.44%
1.0350|~585O|x_______________________________________________|35.3%|7.11%
1.0125|~6O75|x_______________________________________________|36.71%|4.78%
0.9900|~63OO|x_______________________________________________|38.11%|2.45%
0.9675|~6525|________________________________________________|39.52%|0.12%
0.9450|~675O|________________________________________________|40.93%|-2.2%
Column|||||||105_9_4_7_8_182_3_3_2_2_2_9_4_114_3_9_9_5_3_9_7_|
Count
http://iticsoftware.com/postimages/2009-Aug-03/BJF-Trading-Group-EurUsd0302.PNG http://iticsoftware.com/postimages/2009-Aug-03/bjf-trading-group-eurusd0302-2.gif
http://iticsoftware.com/postimages/2009-Aug-03/BJF-Trading-Group-EurUsd0302.xls
Posted by: MDunleavy Mar 4, 2010, 09:25 AM
Current level-0,9070
Longer term bias remains neutral to bullish for the pair, closing above both bearish trendlines confirms some upside for the week ahead.
Intraday: the pair keeps pushing up supported by the 1 hour 50 moving average. Lower highs on shorter time frames suggest a dip before challenging 0,9150.
"P&F EURGBP1440 Box Size 120X3 or(4.49%) CLOSE
Data 0.977 - 0.6251 ~ 93 Month ~ 2808 Day
Database 2000 records 0.90707 (Last Close)
2002-06-26 00~00
2010-03-04 00~00 (GMT+01:00) Paris
http://iticsoftware.com chart"
0.9840|~12O||__________________________________________________|-0.72%|57.41%
0.9720|~24O||____________________________x_____________________|0.51%|55.5%
0.9600|~36O||____________________________x_o___________________|1.74%|53.58%
0.9480|~48O||____________________________x_o___________________|2.97%|51.66%
0.9360|~6OO||____________________________x_o_x___x_____________|4.2%|49.74%
0.9240|~72O||____________________________x_o_x_o_x_o_x_________|5.42%|47.82%
0.9120|~84O||____________________________x_o_x_o_x_o_x_o_x_____|6.65%|45.9%
0.9000|~96O||____________________________x_o_x_o_x_o_x_o_x_o_x_|7.88%|43.98%
0.8880|~1O8O|____________________________x_o_x_o_x_o_x_o_x_o_x_|9.11%|42.06%
0.8760|~12OO|____________________________x_o___o_x_o_x_o___o_x_|10.34%|40.14%
0.8640|~132O|____________________________x_____o___o_x_____o___|11.57%|38.22%
0.8520|~144O|________________________x___x_________o_x_________|12.79%|36.3%
0.8400|~156O|________________________x_o_x_________o___________|14.02%|34.38%
0.8280|~168O|________________________x_o_x_____________________|15.25%|32.46%
0.8160|~18OO|____________________x___x_o_______________________|16.48%|30.54%
0.8040|~192O|________________x___x_o_x_________________________|17.71%|28.62%
0.7920|~2O4O|________________x_o_x_o_x_________________________|18.94%|26.7%
0.7800|~216O|________________x_o_x_o_x_________________________|20.16%|24.78%
0.7680|~228O|________________x_o___o___________________________|21.39%|22.86%
0.7560|~24OO|________________x_________________________________|22.62%|20.94%
0.7440|~252O|________________x_________________________________|23.85%|19.02%
0.7320|~264O|________________x_________________________________|25.08%|17.1%
0.7200|~276O|x_______________x_________________________________|26.31%|15.18%
0.7080|~288O|x_o_x___________x_________________________________|27.53%|13.26%
0.6960|~3OOO|x_o_x_o_x___x___x_________________________________|28.76%|11.34%
0.6840|~312O|x_o_x_o_x_o_x_o_x_________________________________|29.99%|9.42%
0.6720|~324O|x_o_x_o_x_o_x_o_x_________________________________|31.22%|7.5%
0.6600|~336O|x_o_x_o___o___o_x_________________________________|32.45%|5.58%
0.6480|~348O|x_o___________o___________________________________|33.67%|3.66%
0.6360|~36OO|x_________________________________________________|34.9%|1.74%
0.6240|~372O|__________________________________________________|36.13%|-0.18%
Column|||||||8_6_5_4_3_3_3_4_133_4_4_7_3_138_5_6_6_8_7_4_3_4_3_|
Count
http://iticsoftware.com/postimages/2009-Jul-01/BJF-Trading-Group-EurGbp0304.PNG http://iticsoftware.com/postimages/2009-Jul-01/bjf-trading-group-eurgbp0304.gif
http://iticsoftware.com/postimages/2009-Jul-01/BJF-Trading-Group-EurGbp0304.xls
Posted by: MDunleavy Mar 6, 2010, 11:35 AM
The USDJPY has soared since yesterday’s low…over 200 pips. The rally has reached the 50% retracement of the decline from 9217. This level is reinforced by a congestion zone. After seeing steady gains throughout the week, the Yen was battered following a better than expected U.S. Non-farm payroll report. USD/JPY soared over 200 pips to erase of all of the week’s losses for the pair which had diverged from rising equity markets prior to the move.
"P&F USDJPY1440 Box Size 135X4 or(5.13%) HI/LO
Data 125.75 - 84.819 ~ 92 Month ~ 2800 Day
Database 2000 records 90.27 (Last Close)
2002-07-05 00~00
2010-03-05 00~00 (GMT+01:00) Paris
http://iticsoftware.com chart"
125.55|~135||_X_X__________________________|0.16%|48.02%
124.20|~27O||_XoXo_________________________|1.23%|46.43%
122.85|~4O5||_XoXo________X________________|2.31%|44.84%
121.50|~54O||_XoXo______X_Xo_______________|3.38%|43.25%
120.15|~675||_Xo_o____X_XoXo_______________|4.45%|41.65%
118.80|~81O||oX__o____XoXoXo_______________|5.53%|40.06%
117.45|~945||oX__o____XoXoXoX______________|6.6%|38.47%
116.10|~1O8O|o___o____XoXo_oXo_____________|7.67%|36.88%
114.75|~1215|____o__X_XoX__oXoX____________|8.75%|35.29%
113.40|~135O|____o__XoXoX__oXoXo___________|9.82%|33.7%
112.05|~1485|____oX_XoXoX__o_oXo___________|10.89%|32.1%
110.70|~162O|____oXoXoXoX____oXo___________|11.97%|30.51%
109.35|~1755|____oXoXoXo_____oXoX__________|13.04%|28.92%
108.00|~189O|____oXoXoX______o_oXo_________|14.12%|27.33%
106.65|~2O25|____oXoXoX________oXo_________|15.19%|25.74%
105.30|~216O|____o_oXoX________oXo_________|16.26%|24.15%
103.95|~2295|______o_oX________oXo_________|17.34%|22.56%
102.60|~243O|________o_________oXo_________|18.41%|20.96%
101.25|~2565|__________________oXo____X____|19.48%|19.37%
99.90|~27OO||__________________oXoX___Xo___|20.56%|17.78%
98.55|~2835||__________________oXoXo__Xo___|21.63%|16.19%
97.20|~297O||__________________oXoXo__XoX__|22.7%|14.6%
95.85|~31O5||__________________o_oXo__XoXo_|23.78%|13.01%
94.50|~324O||____________________oXoX_XoXo_|24.85%|11.41%
93.15|~3375||____________________oXoXoXoXoX|25.92%|9.82%
91.80|~351O||____________________o_oXoXo_oX|27%|8.23%
90.45|~3645||______________________oXoX__oX|28.07%|6.64%
89.10|~378O||______________________oXoX__oX|29.15%|5.05%
87.75|~3915||______________________o_o___oX|30.22%|3.46%
86.40|~4O5O||____________________________oX|31.29%|1.86%
85.05|~4185||____________________________o_|32.37%|0.27%
83.70|~432O||______________________________|33.44%|-1.32%
Column|||||||374415689189458475111695517496|
Count||||||||____5____3________4O3____O____|
http://iticsoftware.com/postimages/2009-Aug-03/BJF-Trading-Group-UsdJpy0306.PNG http://iticsoftware.com/postimages/2009-Aug-03/bjf-trading-group-usdjpy0306-2.png
http://iticsoftware.com/postimages/2009-Aug-03/BJF-Trading-Group-UsdJpy0306.xls
Posted by: MDunleavy Mar 10, 2010, 06:29 PM
The dollar index moved into long mode in early December and found buying support and momentum as equity markets lost direction.
Also in effective terms the dollar has lost momentum, as witnessed by the correction lower in the DXY index from its mid-February 81.342 high. As a result, speculative long USD positions have been trimmed.
"P&F _DY1440 Box Size 70X4 or(3.42%) CLOSE
Data 92.33 - 71.36 ~ 75 Month ~ 2285 Day
Database 1614 records 80.56 (Last Close)
2003-11-17 00~00
2010-02-18 00~00 (GMT+01:00) Paris
http://iticsoftware.com chart"
91.70|~7O|||____X_______X______________________|0.68%|28.5%
91.00|~14O||X___Xo______Xo_____________________|1.44%|27.52%
90.30|~21O||Xo__Xo____X_XoX____________________|2.2%|26.54%
89.60|~28O||_o__XoX___XoXoXo___________________|2.96%|25.56%
88.90|~35O||_o__XoXo__XoXoXo______________X____|3.71%|24.58%
88.20|~42O||_o__XoXo__XoXoXo______________Xo___|4.47%|23.6%
87.50|~49O||_oX_XoXo__XoXo_o____________X_Xo___|5.23%|22.62%
86.80|~56O||_oXoXo_o__XoX__oX_X_______X_XoXo___|5.99%|21.64%
86.10|~63O||_oXoX__o__Xo___oXoXo______XoXoXoX__|6.75%|20.66%
85.40|~7OO||_oXoX__o__X____oXoXo______XoXoXoXo_|7.51%|19.67%
84.70|~77O||_o_o___oX_X____oXoXoX_____XoXoXoXo_|8.26%|18.69%
84.00|~84O||_______oXoX____oXo_oXo____Xo_oXoXo_|9.02%|17.71%
83.30|~91O||_______oXoX____o___oXo____X__oXoXo_|9.78%|16.73%
82.60|~98O||_______oXoX________oXo____X__oXo_o_|10.54%|15.75%
81.90|~1O5O|_______oXoX________o_o____X__oX__o_|11.3%|14.77%
81.20|~112O|_______oXo___________o____X__oX__o_|12.05%|13.79%
80.50|~119O|=======o=============o====X==oX==oX|12.81%|12.81%
79.80|~126O|_____________________o__X_X__oX__oX|13.57%|11.83%
79.10|~133O|_____________________o__XoX__oX__oX|14.33%|10.85%
78.40|~14OO|_____________________o__XoX__o___oX|15.09%|9.87%
77.70|~147O|_____________________oX_XoX______oX|15.85%|8.88%
77.00|~154O|_____________________oXoXoX______oX|16.6%|7.9%
76.30|~161O|_____________________oXoXoX______oX|17.36%|6.92%
75.60|~168O|_____________________oXoXo_______oX|18.12%|5.94%
74.90|~175O|_____________________oXoX________oX|18.88%|4.96%
74.20|~182O|_____________________o_oX________o_|19.64%|3.98%
73.50|~189O|_______________________oX__________|20.39%|3%
72.80|~196O|_______________________oX__________|21.15%|2.02%
72.10|~2O3O|_______________________oX__________|21.91%|1.04%
71.40|~21OO|_______________________oX__________|22.67%|0.06%
70.70|~217O|_______________________o___________|23.43%|-0.92%
Column||||||29441741651686415447415116145119519|
Count|||||||____O__3__3____O_____5_O3_6__35__7_|
http://iticsoftware.com/postimages/2009-Aug-03/BJF-Trading-Group-DXY0310.PNG http://iticsoftware.com/postimages/2009-Aug-03/bjf-trading-group-dxy0310-2.gif
http://iticsoftware.com/postimages/2009-Aug-03/BJF-Trading-Group-DXY0310.xls
Posted by: MDunleavy Mar 13, 2010, 10:04 AM
While upside moment is diminishing in crude oil, further rise is still in favor with 80.16 minor support index. Current rally from 69.50 could extend further to retest 83.95 high. Nevertheless, break of 80.16 will indicate that a short term top is already in place and deeper pull back should be seen to 38.2% retracement of 69.50 to 83.03 at 77.86 and below.[Written by Oil N' Gold]
In the bigger picture, crude oil was supported above mentioned 68.59 key support and thus, there was no confirmation of medium term reversal. The strong rebound from 69.50 dampened our bearish view and argue that medium term rise from 33.2 might not be over yet. Nevertheless, as such rise from 33.2 is treated as a correction to whole decline from 147.27 only, even in case of another high above 83.95, we'd continue to expect strong resistance near to 50% retracement of 147.27 to 33.2 at 90.24 to bring reversal. On the downside, though, break of 69.50 support will now indicate that crude oil has topped out in medium term already and turn outlook bearish.
"P&F O I L (brent) Box Size40X3 or(13.77%) CLOSE
Data 147.53 - 26.7 ~ 79 Month ~ 2412 Day
Database 1650 records 79.69 (Last Close)
2003-08-04 00~00
2010-03-12 00~00 (GMT+01:00) Paris
http://iticsoftware.com chart"
148.0|~4OO||________________________________________________|-0.32%|454.31%
144.0|~8OO||______________________x_________________________|2.39%|439.33%
140.0|~12OO|______________________x_o_______________________|5.1%|424.34%
136.0|~16OO|______________________x_o_______________________|7.82%|409.36%
132.0|~2OOO|__________________x___x_o_______________________|10.53%|394.38%
128.0|~24OO|__________________x_o_x_o_______________________|13.24%|379.4%
124.0|~28OO|__________________x_o_x_o_______________________|15.95%|364.42%
120.0|~32OO|__________________x_o___o_______________________|18.66%|349.44%
116.0|~36OO|__________________x_____o_______________________|21.37%|334.46%
112.0|~4OOO|__________________x_____o_______________________|24.08%|319.48%
108.0|~44OO|__________________x_____o_______________________|26.79%|304.49%
104.0|~48OO|__________________x_____o_x_____________________|29.51%|289.51%
100.0|~52OO|__________________x_____o_x_o___________________|32.22%|274.53%
96.00|~56OO|______________x___x_____o_x_o___________________|34.93%|259.55%
92.00|~6OOO|______________x_o_x_____o_x_o___________________|37.64%|244.57%
88.00|~64OO|______________x_o_x_____o___o___________________|40.35%|229.59%
84.00|~68OO|______________x_o___________o___________________|43.06%|214.61%
80.00|~72OO|______________x_____________o_____________x___x_|45.77%|199.63%
76.00|~76OO|__________x___x_____________o_____________x_o_x_|48.49%|184.64%
72.00|~8OOO|__________x_o_x_____________o_________x___x_o_x_|51.2%|169.66%
68.00|~84OO|__________x_o_x_____________o_________x_o_x_o___|53.91%|154.68%
64.00|~88OO|______x___x_o_x_____________o_________x_o_x_____|56.62%|139.7%
60.00|~92OO|______x_o_x_o_x_____________o_x_______x_o_______|59.33%|124.72%
56.00|~96OO|______x_o_x_o_x_____________o_x_o_____x_________|62.04%|109.74%
52.00|~1OOO|______x_o___o_x_____________o_x_o_x___x_________|64.75%|94.76%
48.00|~1O4O|__x___x_____o_______________o___o_x_o_x_________|67.46%|79.78%
44.00|~1O8O|__x_o_x_________________________o_x_o_x_________|70.18%|64.79%
40.00|~112O|__x_o_x_________________________o___o_x_________|72.89%|49.81%
36.00|~116O|__x_o_______________________________o___________|75.6%|34.83%
32.00|~12OO|__x_____________________________________________|78.31%|19.85%
28.00|~124O|__x_____________________________________________|81.02%|4.87%
24.00|~128O|o_______________________________________________|83.73%|-10.11%
Column||||||1_6_3_7_3_6_7_123_123_6_144_143_5_3_4_9_3_5_3_3_|
Count
http://iticsoftware.com/postimages/2009-Jun-19/BJF-Trading-Group-Oil0312.PNG
http://iticsoftware.com/postimages/2009-Jun-19/BJF-Trading-Group-Oil0312.xls
Posted by: MDunleavy Mar 15, 2010, 09:34 AM
AUDJPY
Last week retreat after prolonged hesitation against 83.00 has been short lived and the Aussie dollar is again testing recent highs while writing these lines. Bullish momentum is formed on both intra-day and short-term charts, upside being favored while 82.30 limits losses on pullbacks. 84.00/25 is in the cards, if 83.30 breaks.
"P&F AUDJPY1440 Box Size 170X4 or(8.35%) HI/LO
Data 107.86 - 55.11 ~ 92 Month ~ 2797 Day
Database 2000 records 82.852 (Last Close)
2002-07-18 00~00
2010-03-15 00~00 (GMT+01:00) Paris
http://iticsoftware.com chart"
108.8|~17O||______________________________|-0.87%|97.42%
107.1|~34O||_____X_X______________________|0.7%|94.34%
105.4|~51O||_____XoXo_____________________|2.28%|91.25%
103.7|~68O||_____XoXo__X__________________|3.86%|88.17%
102.0|~85O||_____XoXo__Xo_________________|5.43%|85.08%
100.3|~1O2O|_____XoXoX_Xo_________________|7.01%|82%
98.60|~119O|_____XoXoXoXo_________________|8.59%|78.91%
96.90|~136O|_____XoXoXoXo_________________|10.16%|75.83%
95.20|~153O|_____XoXoXoXo_________________|11.74%|72.75%
93.50|~17OO|_____XoXoXoXo_________________|13.31%|69.66%
91.80|~187O|_____XoXoXoXo_________________|14.89%|66.58%
90.10|~2O4O|___X_XoXo_oXoX________________|16.47%|63.49%
88.40|~221O|___XoXoX__o_oXo_______________|18.04%|60.41%
86.70|~238O|___XoXo_____oXo_______________|19.62%|57.32%
85.00|~255O|_X_XoX______oXo__________X_X__|21.19%|54.24%
83.30|~272O|_XoXo_______oXo__________XoXoX|22.77%|51.15%
81.60|~289O|_XoX________o_o__________XoXoX|24.35%|48.07%
79.90|~3O6O|_XoX__________o________X_XoXoX|25.92%|44.98%
78.20|~323O|_XoX__________o________XoXo_oX|27.5%|41.9%
76.50|~34OO|_XoX__________o________XoX__o_|29.07%|38.81%
74.80|~357O|_Xo___________o________XoX____|30.65%|35.73%
73.10|~374O|_X____________o__X_____XoX____|32.23%|32.64%
71.40|~391O|_X____________oX_Xo____Xo_____|33.8%|29.56%
69.70|~4O8O|_X____________oXoXoX___X______|35.38%|26.47%
68.00|~425O|_X____________oXoXoXoX_X______|36.96%|23.39%
66.30|~442O|oX____________oXoXoXoXoX______|38.53%|20.3%
64.60|~459O|oX____________o_o_oXoXoX______|40.11%|17.22%
62.90|~476O|o_________________oXoXoX______|41.68%|14.14%
61.20|~493O|__________________oXoXoX______|43.26%|11.05%
59.50|~51OO|__________________oXoXoX______|44.84%|7.97%
57.80|~527O|__________________oXo_oX______|46.41%|4.88%
56.10|~544O|__________________o___o_______|47.99%|1.8%
54.40|~561O|______________________________|49.56%|-1.29%
Column||||||316941111679151445187671584454|
Count|||||||_3___422O___3_5___O____4______|
http://iticsoftware.com/postimages/2009-Aug-03/BJF-Trading-Group-AudJpy0315.PNG http://iticsoftware.com/postimages/2009-Aug-03/bjf-trading-group-audjpy0315.gif
http://iticsoftware.com/postimages/2009-Aug-03/BJF-Trading-Group-AudJpy0315.xls
Posted by: MDunleavy Mar 17, 2010, 10:48 AM
AUD/NZD extended the correction from 1.3210 and dipped to as low as 1.2873 so far. Some more down would possibly be seen in the cross in near term as correction extends further towards 50% retracement of 1.2408 to 1.3120 at 1.2764 and the development will possibly limit Aussie's gain against Dollar and Yen. Nevertheless, we'd expect the correction to end near to 1.2764 and by then Aussie will start to outperform Kiwi again.
"P&F AUDNZD1440 Box Size 90X5 or(3.82%) HI/LO
Data 1.3121 - 1.0432 ~ 92 Month ~ 2799 Day
Database 2001 records 1.29087 (Last Close)
2002-07-18 00~00
2010-03-17 00~00 (GMT+01:00) Paris
http://iticsoftware.com chart"
1.3050|~9O|||______________________________________________x_|0.54%|25.1%
1.2960|~18O||__________________________x___________________x_|1.23%|24.23%
1.2870|~27O||__________________________x_o_________x___x___x_|1.91%|23.37%
1.2780|~36O||__________________________x_o_________x_o_x_o_x_|2.6%|22.51%
1.2690|~45O||__________________________x_o_________x_o_x_o_x_|3.28%|21.64%
1.2600|~54O||__________________________x_o_________x_o_x_o_x_|3.97%|20.78%
1.2510|~63O||__________________________x_o_________x_o_x_o_x_|4.66%|19.92%
1.2420|~72O||______________x___x_______x_o_________x_o_x_o_x_|5.34%|19.06%
1.2330|~81O||______________x_o_x_o_____x_o_________x_o_x_o_x_|6.03%|18.19%
1.2240|~9OO||______________x_o_x_o_____x_o_____x___x_o_x_o_x_|6.71%|17.33%
1.2150|~99O||______________x_o_x_o_____x_o_____x_o_x_o_x_o_x_|7.4%|16.47%
1.2060|~1O8O|______________x_o_x_o_x___x_o_____x_o_x_o___o_x_|8.09%|15.61%
1.1970|~117O|______________x_o_x_o_x_o_x_o_____x_o_x_____o___|8.77%|14.74%
1.1880|~126O|______________x_o_x_o_x_o_x_o_____x_o_x_________|9.46%|13.88%
1.1790|~135O|__x___x_______x_o___o_x_o_x_o_____x_o_x_________|10.14%|13.02%
1.1700|~144O|__x_o_x_o_____x_____o_x_o_x_o_____x_o___________|10.83%|12.15%
1.1610|~153O|o_x_o_x_o_____x_____o_x_o_x_o_____x_____________|11.52%|11.29%
1.1520|~162O|__x_o_x_o_____x_____o_x_o_x_o_____x_____________|12.2%|10.43%
1.1430|~171O|__x_o_x_o_____x_____o_x_o_x_o_x___x_____________|12.89%|9.57%
1.1340|~18OO|__x_o_x_o_____x_____o_x_o_x_o_x_o_x_____________|13.57%|8.7%
1.1250|~189O|____o_x_o_____x_____o_x_o_x_o_x_o_x_____________|14.26%|7.84%
1.1160|~198O|____o_x_o_x___x_____o_x_o___o_x_o_x_____________|14.95%|6.98%
1.1070|~2O7O|____o_x_o_x_o_x_____o_x_____o_x_o_x_____________|15.63%|6.12%
1.0980|~216O|____o_x_o_x_o_x_____o_______o_x_o_x_____________|16.32%|5.25%
1.0890|~225O|____o_x_o_x_o_x_____________o_x_o_______________|17%|4.39%
1.0800|~234O|____o_x_o_x_o_x_____________o_x_________________|17.69%|3.53%
1.0710|~243O|____o___o_x_o_x_____________o___________________|18.38%|2.66%
1.0620|~252O|________o_x_o_x_________________________________|19.06%|1.8%
1.0530|~261O|____________o_x_________________________________|19.75%|0.94%
1.0440|~27OO|____________o___________________________________|20.43%|0.08%
1.0350|~279O|________________________________________________|21.12%|-0.79%
Column|||||||1_6_1_1_1_7_8_2_7_7_1_1_1_2_2_8_6_1_6_1_9_9_1_1_|
Count|~297O||____2_2_3_____2_____6_2_0_0_5_____5___3_____0_2_|
http://iticsoftware.com/postimages/2009-Jul-01/BJF-Trading-Group-AudNzd0317.PNG http://iticsoftware.com/postimages/2009-Jul-01/bjf-trading-group-audnzd0317.gif
http://iticsoftware.com/postimages/2009-Jul-01/BJF-Trading-Group-AudNzd0317.xls
Posted by: MDunleavy Mar 20, 2010, 09:15 AM
Chart: AUDUSD
AUDUSD was unable to maintain prices above 0.9200. That area now acts as resistance and we look for potential follow through lower if risk aversion continues. The strong swoon in commodities, especially gold is also worth nothing today. There are a cluster of support points in the 0.9085 to 0.9035 area that are the next major focus. A failure of those could lead to a test of the 200-day SMA now down below 0.8800.
"P&F AUDUSD1440 Box Size 150X3 or(5.97%) HI/LO
Data 0.9849 - 0.5228 ~ 92 Month ~ 2810 Day
Database 2000 records 0.91526 (Last Close)
2002-07-09 00~00
2010-03-19 00~00 (GMT+01:00) Paris
http://iticsoftware.com chart"
0.9750|~15O||____________________________________|1.01%|86.5%
0.9600|~3OO||_____________Xo_____________________|2.53%|83.63%
0.9450|~45O||___________x_Xo_____________________|4.05%|80.76%
0.9300|~6OO||_________x_XoXo________________x_X__|5.57%|77.89%
0.9150|~75O||_________XoXoXo________________XoXoX|7.1%|75.02%
0.9000|~9OO||_________XoXo_o________________XoXoX|8.62%|72.15%
0.8850|~1O5O|_______X_XoX__o________________Xo_oX|10.14%|69.28%
0.8700|~12OO|_______XoXoX__o________________X__o_|11.67%|66.41%
0.8550|~135O|_______xoXo___o________________X____|13.19%|63.54%
0.8400|~15OO|_______xoX____oX_______________x____|14.71%|60.67%
0.8250|~165O|_______Xox____oXo____________X_X____|16.24%|57.8%
0.8100|~18OO|_______XoX____oXo____________XoX____|17.76%|54.93%
0.7950|~195O|_X___X_XoX____o_o____________XoX____|19.28%|52.07%
0.7800|~21OO|_Xo__Xoxo_______o____________Xo_____|20.8%|49.2%
0.7650|~225O|_Xo__xoX________o____________X______|22.33%|46.33%
0.7500|~24OO|_Xo__Xox________o____________X______|23.85%|43.46%
0.7350|~255O|_xoX_XoX________o____________x______|25.37%|40.59%
0.7200|~27OO|_xoxoXoX________o__X_____X___X______|26.9%|37.72%
0.7050|~285O|_XoXoXo_________oX_XoX___xo__x______|28.42%|34.85%
0.6900|~3OOO|_xo_o___________oXoXoXoX_Xo__X______|29.94%|31.98%
0.6750|~315O|_X______________oXoXoXoXoXoX_X______|31.47%|29.11%
0.6600|~33OO|_X______________oXoXo_oXoxoXoX______|32.99%|26.24%
0.6450|~345O|_x______________o_o___oXoXoXoX______|34.51%|23.37%
0.6300|~36OO|_x____________________oXoXo_o_______|36.03%|20.5%
0.6150|~375O|_x____________________o_o___________|37.56%|17.64%
0.6000|~39OO|_X__________________________________|39.08%|14.77%
0.5850|~4O5O|_X__________________________________|40.6%|11.9%
0.5700|~42OO|_x__________________________________|42.13%|9.03%
0.5550|~435O|oX__________________________________|43.65%|6.16%
0.5400|~45OO|oX__________________________________|45.17%|3.29%
0.5250|~465O|o___________________________________|46.7%|0.42%
0.5100|~48OO|____________________________________|48.22%|-2.45%
Column|||||||317337617156341314454365576331313343|
Count||||||||_8_____2_O____2_3____________3_O____|
http://iticsoftware.com/postimages/2009-Jun-19/BJF-Trading-Group-AudUsd0320.PNG http://iticsoftware.com/postimages/2009-Jun-19/bjf-trading-group-audusd2.gif http://iticsoftware.com/postimages/2009-Jun-19/bjf-trading-group-audusd3.gif
http://iticsoftware.com/postimages/2009-Jun-19/BJF-Trading-Group-AudUsd0320.xls
Posted by: MDunleavy Mar 21, 2010, 09:05 AM
A week of risk appetite has benefitted commodity dollars and sunk the yen as the carry trade takes center stage. Optimism is showing signs of fading as markets take inventory of current valuations in light in the anniversary on the 2009 bottom. Prices may have outpaced underlining fundamentals which could lead to a retracement of risky assets which would set up the CAD/JPY for a failed test of the upper bound of the current range.
"P&F CADJPY1440 Box Size1 80X3 or(5.51%) HI/LO
Data 125.09 - 70.85 ~ 92 Month ~ 2796 Day
Database 2000 records 88.962 (Last Close)
2002-07-23 00~00
2010-03-19 00~00 (GMT+01:00) Paris
http://iticsoftware.com chart"
126.0|~18O||_______________________________________|-0.73%|77.84%
124.2|~36O||____________X__________________________|0.71%|75.3%
122.4|~54O||____________Xo_________________________|2.15%|72.76%
120.6|~72O||____________Xo_________________________|3.59%|70.22%
118.8|~9OO||____________Xo_________________________|5.03%|67.68%
117.0|~1O8O|__________X_Xo_________________________|6.47%|65.14%
115.2|~126O|__________XoXoX________________________|7.91%|62.6%
113.4|~144O|__________XoXoXo_______________________|9.35%|60.06%
111.6|~162O|__________XoXoXo_______________________|10.78%|57.52%
109.8|~18OO|__________XoXoXo_______________________|12.22%|54.98%
108.0|~198O|__________XoXo_oX______________________|13.66%|52.43%
106.2|~216O|________X_XoX__oXoX____________________|15.1%|49.89%
104.4|~234O|______X_XoXo___oXoXo___________________|16.54%|47.35%
102.6|~252O|______XoXoX____o_oXoX__________________|17.98%|44.81%
100.8|~27OO|______XoXoX______oXoXo_________________|19.42%|42.27%
99.00|~288O|______XoXo_______oXoXo_________________|20.86%|39.73%
97.20|~3O6O|______Xo_________o_o_o_________________|22.3%|37.19%
95.40|~324O|______X______________o_________________|23.73%|34.65%
93.60|~342O|______X______________o_________________|25.17%|32.11%
91.80|~36OO|______X______________o_________________|26.61%|29.57%
90.00|~378O|======X==============oX=========X===X=X|28.05%|27.03%
88.20|~396O|X___X_X______________oXo______X_XoX_XoX|29.49%|24.49%
86.40|~414O|Xo__XoX______________oXoX_____XoXoXoXoX|30.93%|21.95%
84.60|~432O|XoX_XoX______________oXoXo____XoXoXoXoX|32.37%|19.41%
82.80|~45OO|XoXoXo_______________o_oXo____XoXoXoXo_|33.81%|16.87%
81.00|~468O|XoXoX==================oXo====XoXo=o===|35.25%|14.33%
79.20|~486O|Xo_o___________________oXoX_X_Xo_______|36.69%|11.79%
77.40|~5O4O|X______________________oXoXoXoX________|38.12%|9.24%
75.60|~522O|X______________________oXoXoXoX________|39.56%|6.7%
73.80|~54OO|_______________________oXo_oXoX________|41%|4.16%
72.00|~558O|_______________________o___o_oX________|42.44%|1.62%
70.20|~576O|_____________________________o_________|43.88%|-0.92%
Column||||||853353145417194736553141873445156544544|
Count|||||||______2___O_1________1_O______O________|
http://iticsoftware.com/postimages/2009-Jul-01/BJF-Trading-Group-CadJpy0321.PNG http://iticsoftware.com/postimages/2009-Jul-01/bjf-trading-group-cadjpy0321-2.gif
http://iticsoftware.com/postimages/2009-Jul-01/BJF-Trading-Group-CadJpy0321.xls
Posted by: MDunleavy Mar 23, 2010, 09:56 PM
We'd talked bout Euro's weakness against commodity currencies in our weekly report and the outlook of Sterling is no better from that. GBP/CAD edged lower to 1.5172 yesterday and the down trend remains in force for 100% projection of 1.9299 to 1.6233 from 1.7890 at 1.4842. A break above 1.5552 resistance is needed to be first signal of bottoming or outlook will remain bearish.
"P&F GBPCAD1440 Box Size 330X3 or(4.87%) HI/LO
Data 2.5471 - 1.5172 ~ 92 Month ~ 2813 Day
Database 2000 records 1.53001 (Last Close)
2002-07-10 00~00
2010-03-23 00~00 (GMT+01:00) Paris
http://iticsoftware.com chart"
2.5410|~33O||__________________________________|0.24%|67.48%
2.5080|~66O||__X_XoX_X_________________________|1.54%|65.3%
2.4750|~99O||X_XoXoXoXo________________________|2.83%|63.13%
2.4420|~132O|XoXoXoXoXo________________________|4.13%|60.95%
2.4090|~165O|XoXo_oXoXo________________________|5.42%|58.78%
2.3760|~198O|_o___oXo_oX_X_X___________________|6.72%|56.6%
2.3430|~231O|_____oX__oXoXoXoX_________________|8.01%|54.43%
2.3100|~264O|_____oX__oXoXoXoXo________________|9.31%|52.25%
2.2770|~297O|_____oX__oXo_o_oXo________________|10.6%|50.08%
2.2440|~33OO|_____oX__oX____oXo________________|11.9%|47.9%
2.2110|~363O|_____oX__o_____oXo________________|13.2%|45.73%
2.1780|~396O|_____o_________oXo________________|14.49%|43.55%
2.1450|~429O|_______________oXo________________|15.79%|41.38%
2.1120|~462O|_______________oXo________________|17.08%|39.2%
2.0790|~495O|_______________oXoX_______________|18.38%|37.03%
2.0460|~528O|_______________oXoXoX_X_X_________|19.67%|34.85%
2.0130|~561O|_______________oXoXoXoXoXo________|20.97%|32.68%
1.9800|~594O|_______________o_oXoXoXoXo________|22.26%|30.5%
1.9470|~627O|_________________oXo_o_oXo________|23.56%|28.33%
1.9140|~66OO|_________________o_____oXoX___X___|24.86%|26.15%
1.8810|~693O|_______________________o_oXo__Xo__|26.15%|23.98%
1.8480|~726O|_________________________oXoX_Xo__|27.45%|21.8%
1.8150|~759O|_________________________o_oXoXo__|28.74%|19.63%
1.7820|~792O|___________________________oXoXoX_|30.04%|17.45%
1.7490|~825O|___________________________o_oXoXo|31.33%|15.28%
1.7160|~858O|_____________________________oXoXo|32.63%|13.1%
1.6830|~891O|_____________________________o_oXo|33.92%|10.93%
1.6500|~924O|_______________________________o_o|35.22%|8.75%
1.6170|~957O|_________________________________o|36.52%|6.58%
1.5840|~99OO|_________________________________o|37.81%|4.4%
1.5510|~1O23|_________________________________o|39.11%|2.23%
1.5180|~1O56|_________________________________o|40.4%|0.05%
1.4850|~1O89|__________________________________|41.7%|-2.12%
Column|||||||3343311449533331115433355735357848|
Count||||||||_____1O________213________________|
http://iticsoftware.com/postimages/2009-Jun-19/BJF-Trading-Group-GbpCad0323.PNG http://iticsoftware.com/postimages/2009-Jun-19/bjf-trading-group-cbpcad0323-2.gif
http://iticsoftware.com/postimages/2009-Jun-19/BJF-Trading-Group-GbpCad0323.xls
Posted by: MDunleavy Mar 25, 2010, 09:21 AM
Dollar index's strong break of 81.34 resistance confirms that whole medium term rise from 74.19 has resumed and should now be targeting 61.8% projection of 76.60 to 81.34 from 79.51 at 82.43 next. Meanwhile, in case of retreat, dollar index should be contained by 80.55 support and bring rally resumption.
"P&F _DY1440 Box Size1 250X3 or(4.17%) CLOSE
Data 108.69 - 71.36 ~ 93 Month ~ 2834 Day
Database 2000 records 81.85 (Last Close)
2002-06-21 00~00
2010-03-25 00~00 (GMT+01:00) Paris
http://iticsoftware.com chart"
108.75|~125|______________________________|-0.06%|52.4%
107.50|~25O|_X_X__________________________|1.09%|50.64%
106.25|~375|oXoXo_________________________|2.24%|48.89%
105.00|~5OO|o_oXo_________________________|3.39%|47.14%
103.75|~625|__o_o_________________________|4.55%|45.39%
102.50|~75O|____o_________________________|5.7%|43.64%
101.25|~875|____oX________________________|6.85%|41.89%
100.0|~1OOO|____oXo_______________________|8%|40.13%
98.75|~1125|____oXoX______________________|9.15%|38.38%
97.50|~125O|____o_oXo_____________________|10.3%|36.63%
96.25|~1375|______oXo_____________________|11.45%|34.88%
95.00|~15OO|______oXo_____________________|12.6%|33.13%
93.75|~1625|______oXo_____________________|13.75%|31.38%
92.50|~175O|______oXo_____________________|14.9%|29.62%
91.25|~1875|______o_oX_____X______________|16.05%|27.87%
90.00|~2OOO|________oXo__X_Xo_____________|17.2%|26.12%
88.75|~2125|========oXo==XoXo========X====|18.35%|24.37%
87.50|~225O|________oXo__XoXo______X_Xo___|19.5%|22.62%
86.25|~2375|________oXo__Xo_o______XoXoX__|20.65%|20.87%
85.00|~25OO|________oXoX_X__oX_____XoXoXo_|21.8%|19.11%
83.75|~2625|________o_oXoX__oXo____XoXoXo_|22.95%|17.36%
82.50|~275O|__________oXoX__oXo____XoXo_o_|24.1%|15.61%
81.25|~2875|==========oXo===o=o====XoX==oX|25.25%|13.86%
80.00|~3OOO|__________o_______o__X_XoX__oX|26.4%|12.11%
78.75|~3125|__________________o__XoXo___oX|27.55%|10.36%
77.50|~325O|__________________oX_XoX____oX|28.7%|8.6%
76.25|~3375|__________________oXoXoX____oX|29.85%|6.85%
75.00|~35OO|__________________oXoXo_____oX|31%|5.1%
73.75|~3625|==================o=oX======o=|32.15%|3.35%
72.50|~375O|____________________oX________|33.3%|1.6%
71.25|~3875|____________________o_________|34.45%|-0.15%
Column||||||223383861694373483935741785316|
Count|||||||________2______________O____O_|
http://iticsoftware.com/postimages/2009-Aug-03/BJF-Trading-Group-DXY_0325xls.PNG http://iticsoftware.com/postimages/2009-Aug-03/bjf-trading-group-dxy_0325xls.gif
http://iticsoftware.com/postimages/2009-Aug-03/BJF-Trading-Group-DXY_0325.xls
Posted by: MDunleavy Mar 30, 2010, 11:00 AM
The EUR/AUD has been trading in a bearish trend-channel since the beginning of February and fell to a new all-time low. As you can see, the Bollinger Bands contracted like a bottle neck before the currency pair began its youngest bearish movement. From a technical point of view it seems that there are currently no more support levels. Also the MACD reversed and could show a bearish perspective.
"P&F EURAUD1440 Box Size 225X4 or(5.04%) HI/LO
Data 2.1126 - 1.4599 ~ 92 Month ~ 2808 Day
Database 2000 records 1.47038 (Last Close)
2002-07-22 00~00
2010-03-30 00~00 (GMT+01:00) Paris
http://iticsoftware.com chart"
2.1150|~225||______________________________________|-0.11%|44.87%
2.0925|~45O||______________________X_X_______X_____|0.95%|43.33%
2.0700|~675||______________________XoXoX_X___Xo____|2.02%|41.79%
2.0475|~9OO||______________________XoXoXoXoX_Xo____|3.08%|40.25%
2.0250|~1125|______________________XoXoXoXoXoXoX___|4.15%|38.71%
2.0025|~135O|______________________XoXoXoXoXoXoXoX_|5.21%|37.17%
1.9800|~1575|______________________XoXoXoXoXoXoXoXo|6.28%|35.63%
1.9575|~18OO|______________________XoXoXoXoXoXoXoXo|7.34%|34.08%
1.9350|~2O25|______________________Xo_oXoXoXo_oXoXo|8.41%|32.54%
1.9125|~225O|______________________X__o_oXoX__oXo_o|9.47%|31%
1.8900|~2475|______________________X____o_oX__oX__o|10.54%|29.46%
1.8675|~27OO|__X___________________X______o___o___o|11.6%|27.92%
1.8450|~2925|X_Xo__________________X______________o|12.67%|26.38%
1.8225|~315O|XoXo________________X_X______________o|13.73%|24.84%
1.8000|~3375|XoXo________________XoX______________o|14.8%|23.3%
1.7775|~36OO|_oXo____X___________XoX______________o|15.86%|21.75%
1.7550|~3825|_oXoX___XoX_________XoX______________o|16.93%|20.21%
1.7325|~4O5O|_o_oXo__XoXoX_X___X_Xo_______________o|17.99%|18.67%
1.7100|~4275|___oXo__XoXoXoXoX_XoX________________o|19.06%|17.13%
1.6875|~45OO|___oXoX_XoXoXoXoXoXoX________________o|20.12%|15.59%
1.6650|~4725|___o_oXoXo_oXoXoXoXoX________________o|21.19%|14.05%
1.6425|~495O|_____oXoX__oXoXoXoXoX________________o|22.25%|12.51%
1.6200|~5175|_____oXoX__oXoXoXoXo_________________o|23.32%|10.97%
1.5975|~54OO|_____o_oX__oXoXoXo___________________o|24.38%|9.43%
1.5750|~5625|_______o___o_oXoX____________________o|25.45%|7.88%
1.5525|~585O|=============o=o=====================o|26.51%|6.34%
1.5300|~6O75|_____________________________________o|27.58%|4.8%
1.5075|~63OO|_____________________________________o|28.64%|3.26%
1.4850|~6525|_____________________________________o|29.71%|1.72%
1.4625|~675O|_____________________________________o|30.77%|0.18%
1.4400|~6975|______________________________________|31.84%|-1.36%
Column|||||||35694745954878887565941778788985717542|
Count||||||||______________________6__________O___4|
[size="2"][/size]
http://iticsoftware.com/postimages/2009-Jul-01/BJF-Trading-Group-EurAud_0303.PNG http://iticsoftware.com/postimages/2009-Jul-01/bjf-trading-group-euraud_0303-2.gif
http://iticsoftware.com/postimages/2009-Jul-01/BJF-Trading-Group-EurAud_0303.xls
Posted by: MDunleavy Apr 1, 2010, 08:27 AM
EUR/USD's corrective rise from 1.3266 might still be in progress but we'd continue to anticipate strong resistance at 1.3570 to conclude the correction and bring fall resumption. Below 1.3384 will flip intraday bias back to the downside for retesting 1.3266 first. However, note that decisive break of 1.3570 will indicate that the five wave sequence from 1.5143 is completed and stronger rebound should then be seen to 1.3817 resistance and above.
"P&F EURUSD1440 Box Size 20X3 or(4.68%) HI/LO
Data 1.6038 - 0.9607 ~ 92 Month ~ 2796 Day
Database 2000 records 1.35043 (Last Close)
2002-08-05 00~00
2010-04-01 00~00 (GMT+01:00) Paris
http://iticsoftware.com chart"
1.6200|~2OO||______________________________________________|-1.01%|68.63%
1.6000|~4OO||__________________x___x_______________________|0.24%|66.55%
1.5800|~6OO||__________________x_o_x_o_____________________|1.48%|64.46%
1.5600|~8OO||__________________x_o_x_o_____________________|2.73%|62.38%
1.5400|~1OOO|__________________x_o___o_____________________|3.98%|60.3%
1.5200|~12OO|__________________x_____o_____________________|5.23%|58.22%
1.5000|~14OO|__________________x_____o_________________x___|6.47%|56.14%
1.4800|~16OO|__________________x_____o_x_______________x_o_|7.72%|54.05%
1.4600|~18OO|__________________x_____o_x_o_____x_______x_o_|8.97%|51.97%
1.4400|~2OOO|__________________x_____o_x_o_____x_o_____x_o_|10.21%|49.89%
1.4200|~22OO|__________________x_____o_x_o_____x_o_____x_o_|11.46%|47.81%
1.4000|~24OO|__________________x_____o___o_____x_o_____x_o_|12.71%|45.73%
1.3800|~26OO|__________________x_________o_____x_o_____x_o_|13.95%|43.65%
1.3600|~28OO|__________x_______x_________o_____x_o_x___x_o_|15.2%|41.56%
1.3400|~3OOO|__________x_o_x___x_________o_____x_o_x_o_x_o_|16.45%|39.48%
1.3200|~32OO|__________x_o_x_o_x_________o_x___x_o_x_o_x___|17.7%|37.4%
1.3000|~34OO|__________x_o_x_o_x_________o_x_o_x_o_x_o_____|18.94%|35.32%
1.2800|~36OO|______x___x_o___o_x_________o_x_o_x_o_x_______|20.19%|33.24%
1.2600|~38OO|______x_o_x_____o_x_________o_x_o_x_o_________|21.44%|31.15%
1.2400|~4OOO|______x_o_x_____o_x_________o___o_____________|22.68%|29.07%
1.2200|~42OO|______x_o_x_____o_x___________________________|23.93%|26.99%
1.2000|~44OO|______x_o_x_____o_x___________________________|25.18%|24.91%
1.1800|~46OO|__x___x_o_______o_____________________________|26.42%|22.83%
1.1600|~48OO|__x_o_x_______________________________________|27.67%|20.75%
1.1400|~5OOO|__x_o_x_______________________________________|28.92%|18.66%
1.1200|~52OO|__x_o_x_______________________________________|30.17%|16.58%
1.1000|~54OO|__x_o_x_______________________________________|31.41%|14.5%
1.0800|~56OO|__x_o_________________________________________|32.66%|12.42%
1.0600|~58OO|__x___________________________________________|33.91%|10.34%
1.0400|~6OOO|__x___________________________________________|35.15%|8.25%
1.0200|~62OO|__x___________________________________________|36.4%|6.17%
1.0000|~64OO|o_x___________________________________________|37.65%|4.09%
0.9800|~66OO|o_x___________________________________________|38.9%|2.01%
0.9600|~68OO|______________________________________________|40.14%|-0.07%
Column|||||||2_1_5_1_5_9_4_3_8_2_3_3_1_4_1_4_4_1_1_5_3_1_8_|
Count||||||||__1___0___________1_____0___2_____1_0_____0___|
http://iticsoftware.com/postimages/2009-Jun-19/BJF-Trading-Group-EurUsd_0401.PNG http://iticsoftware.com/postimages/2009-Jun-19/bjf-trading-group-eurusd_0401-2.gif
http://iticsoftware.com/postimages/2009-Jun-19/BJF-Trading-Group-EurUsd_0401.xls
Posted by: MDunleavy Apr 3, 2010, 09:24 PM
Intraday bias in GBP/USD remains on the upside for the moment. Rise from 1.4798 is treated as the third leg of consolidation pattern that started at 1.4783 and is possibly targeting 1.5381 resistance. Nevertheless, upside should be limited by 38.2% retracement of 1.6456 to 1.4783 at 1.5422 to conclude the consolidation and bring down trend resumption. On the downside, below 1.5118 minor support will flip intraday bias back to the downside. Decisive break of 1.4783 low will confirm that whole decline from 1.6456 has resumed and should target 200% projection of 1.6875 to 1.5829 from 1.6456 at 1.4364.
In the bigger picture, there is no change in our bearish view. That is, medium term rebound from 1.3503, which is treated as a correction to down trend from 2.1161, has completed at 1.7043 already. Fall from there is tentatively treated as resumption of the down trend from 2.1161 and should target a new low below 1.3503. On the upside, break of 1.5814 resistance is needed to invalidate this view. Otherwise, outlook will remain bearish.[Written by ActionForex.com]
"P&F GBPUSD1440 Box Size 250X3 or(4.33%) HI/LO
Data 2.1161 - 1.3502 ~ 92 Month ~ 2797 Day
Database 2000 records 1.51921 (Last Close)
2002-08-05 00~00
2010-04-02 00~00 (GMT+01:00) Paris
http://iticsoftware.com chart"
2.1250|~25O||_____________________________________|-0.42%|57.38%
2.1000|~5OO||_________________X___________________|0.76%|55.53%
2.0750|~75O||_________________Xo__________________|1.94%|53.68%
2.0500|~1OOO|_______________X_Xo__________________|3.12%|51.83%
2.0250|~125O|_______________XoXoX_________________|4.31%|49.98%
2.0000|~15OO|_______________XoXoXo________________|5.49%|48.13%
1.9750|~175O|_______________Xo_oXo________________|6.67%|46.27%
1.9500|~2OOO|_________X_____X__o_o________________|7.85%|44.42%
1.9250|~225O|_________Xo____X____o________________|9.03%|42.57%
1.9000|~25OO|_____X___Xo__X_X____o________________|10.21%|40.72%
1.8750|~275O|_____XoX_Xo__XoX____o________________|11.39%|38.87%
1.8500|~3OOO|_____XoXoXo__XoX____oX_______________|12.58%|37.02%
1.8250|~325O|_____XoXoXoX_Xo_____oXo______________|13.76%|35.17%
1.8000|~35OO|_____XoXoXoXoX______oXo______________|14.94%|33.31%
1.7750|~375O|_____XoXo_oXoX______oXo______________|16.12%|31.46%
1.7500|~4OOO|_____Xo___o_oX______o_o______________|17.3%|29.61%
1.7250|~425O|_____X______o_________o______________|18.48%|27.76%
1.7000|~45OO|_____X________________o__________X___|19.66%|25.91%
1.6750|~475O|___X_X________________o__________XoX_|20.84%|24.06%
1.6500|~5OOO|_X_XoX________________oX_________XoXo|22.03%|22.2%
1.6250|~525O|_XoXoX________________oXo________XoXo|23.21%|20.35%
1.6000|~55OO|_XoXoX________________oXo________XoXo|24.39%|18.5%
1.5750|~575O|oXoXo_________________oXo________Xo_o|25.57%|16.65%
1.5500|~6OOO|oXo___________________o_oX_X_____X__o|26.75%|14.8%
1.5250|~625O|o_______________________oXoXoX___X__o|27.93%|12.95%
1.5000|~65OO|________________________oXoXoXo__X__o|29.11%|11.09%
1.4750|~675O|________________________o_oXoXoX_X___|30.3%|9.24%
1.4500|~7OOO|__________________________o_o_oXoX___|31.48%|7.39%
1.4250|~725O|______________________________oXoX___|32.66%|5.54%
1.4000|~75OO|______________________________oXoX___|33.84%|3.69%
1.3750|~775O|______________________________o_o____|35.02%|1.84%
1.3500|~8OOO|_____________________________________|36.2%|-0.01%
Column|||||||3545416547834739356314147344436441547|
Count||||||||_____3______________1_2__________3___|
http://iticsoftware.com/postimages/2009-Jun-19/BJF-Trading-Group-GbpUsd_0404.PNG http://iticsoftware.com/postimages/2009-Jun-19/bjf-trading-group-gbpusd_0404-2.gif
http://iticsoftware.com/postimages/2009-Jun-19/BJF-Trading-Group-GbpUsd_0404.xls
Posted by: MDunleavy Apr 6, 2010, 10:01 AM
The short term picture remains positive as the pair continues its strong upward movement. So far the rise is limited by the resistance at 94.70, which is 38.2% FIbo retracement of the 110.64-84.71 drop, and if broken successfully next targets will be the resistances at 96.80 and 97.70, which is 50.0% Fibo retracement of the mentioned drop. On the downside, support is seen at 93.80, followed by 91.80 and 90.20.
"P&F USD
JPY1440 Box Size 130X4 or(4.94%) HI/LO
Data 125.75 - 84.819 ~ 92 Month ~ 2800 Day
Database 2000 records 94.031 (Last Close)
2002-08-06 00~00
2010-04-06 00~00 (GMT+01:00) Paris
http://iticsoftware.com chart"
126.1|~13O||_________________________________|-0.28%|48.67%
124.8|~26O||XoX______________________________|0.76%|47.14%
123.5|~39O||XoXo________X____________________|1.79%|45.6%
122.2|~52O||XoXo________Xo___________________|2.82%|44.07%
120.9|~65O||XoXo____X_X_Xo___________________|3.86%|42.54%
119.6|~78O||Xo_o____XoXoXo___________________|4.89%|41.01%
118.3|~91O||X__o____XoXoXo___________________|5.92%|39.47%
117.0|~1O4O|___o____XoXoXoX__________________|6.96%|37.94%
115.7|~117O|___o____XoXo_oXo_________________|7.99%|36.41%
114.4|~13OO|___o__X_XoX__oXoX________________|9.03%|34.88%
113.1|~143O|___o__XoXoX__oXoXo_______________|10.06%|33.34%
111.8|~156O|___oX_XoXoX__o_oXo_______________|11.09%|31.81%
110.5|~169O|___oXoXoXoX____oXoX______________|12.13%|30.28%
109.2|~182O|___oXoXoXo_____oXoXo_____________|13.16%|28.74%
107.9|~195O|___oXoXoX______o_oXo_____________|14.19%|27.21%
106.6|~2O8O|___oXoXoX________oXo_____________|15.23%|25.68%
105.3|~221O|___o_oXoX________oXo_____________|16.26%|24.15%
104.0|~234O|_____o_oX________oXo_____________|17.3%|22.61%
102.7|~247O|_______o_________oXo_____________|18.33%|21.08%
101.4|~26OO|=================oXo======X======|19.36%|19.55%
100.1|~273O|_________________oXoX_____Xo_____|20.4%|18.02%
98.80|~286O|_________________oXoXo__X_Xo_____|21.43%|16.48%
97.50|~299O|_________________oXoXo__XoXoX____|22.47%|14.95%
96.20|~312O|_________________o_oXo__XoXoXo___|23.5%|13.42%
94.90|~325O|___________________oXo__XoXoXo___|24.53%|11.89%
93.60|~338O|===================oXoX=Xo=oXoX=X|25.57%|10.35%
92.30|~351O|___________________oXoXoX__o_oXoX|26.6%|8.82%
91.00|~364O|___________________o_oXoX____oXoX|27.63%|7.29%
89.70|~377O|_____________________oXoX____oXoX|28.67%|5.75%
88.40|~39OO|_____________________o_o_____oXo_|29.7%|4.22%
87.10|~4O3O|_____________________________oX__|30.74%|2.69%
85.80|~416O|=============================o===|31.77%|1.16%
84.50|~429O|_________________________________|32.8%|-0.38%
Column||||||654156891994694751117944846749644|
Count|||||||___5____4________415_____________|
http://iticsoftware.com/postimages/2009-Aug-03/BJF-Trading-Group-UsdJpy_0406.PNG http://iticsoftware.com/postimages/2009-Aug-03/bjf-trading-group-usdjpy_0406-2.gif
http://iticsoftware.com/postimages/2009-Aug-03/BJF-Trading-Group-UsdJpy_0406.xls
Posted by: MDunleavy Apr 7, 2010, 09:04 AM
AUDUSD Outlook
The AUDUSD made a significant bullish momentum, break above the broadening formation, confirms the bullish continuation scenario after RBA raised the rate at 4.25% as expected. The bias is bullish in nearest term targeting 0.9326 - 0.9404 area. Immediate support at 0.9250. Break below that area could trigger further bearish correction testing the upper line of the broadening formation. A movement back inside the formation should lead us into no trading zone as direction would become unclear.
"P&F AUDUSD1440 Box Size 150X3 or(5.98%) HI/LO
Data 0.9784 - 0.5276 ~ 93 Month ~ 2812 Day
Database 2000 records 0.92673 (Last Close)
2002-07-26 00~00
2010-04-07 00~00 (GMT+01:00) Paris
http://iticsoftware.com chart"
0.9900|~15O||___________________________________|-1.19%|87.64%
0.9750|~3OO||____________X______________________|0.35%|84.8%
0.9600|~45O||____________Xo_____________________|1.88%|81.96%
0.9450|~6OO||__________X_Xo_____________________|3.41%|79.11%
0.9300|~75O||________X_XoXo________________X_X__|4.95%|76.27%
0.9150|~9OO||________XoXoXo________________XoXoX|6.48%|73.43%
0.9000|~1O5O|________XoXo_o________________XoXoX|8.01%|70.58%
0.8850|~12OO|______X_XoX__o________________Xo_oX|9.55%|67.74%
0.8700|~135O|______XoXoX__o________________X__o_|11.08%|64.9%
0.8550|~15OO|______XoXo___o________________X____|12.61%|62.05%
0.8400|~165O|______XoX____oX_______________X____|14.15%|59.21%
0.8250|~18OO|______XoX____oXo____________X_X____|15.68%|56.37%
0.8100|~195O|______XoX____oXo____________XoX____|17.21%|53.53%
0.7950|~21OO|X___X_XoX____o_o____________XoX____|18.74%|50.68%
0.7800|~225O|Xo__XoXo_______o____________Xo_____|20.28%|47.84%
0.7650|~24OO|Xo__XoX________o____________X______|21.81%|45%
0.7500|~255O|Xo__XoX________o____________X______|23.34%|42.15%
0.7350|~27OO|XoX_XoX________o____________X______|24.88%|39.31%
0.7200|~285O|XoXoXoX________o__X_____X___X______|26.41%|36.47%
0.7050|~3OOO|XoXoXo_________oX_XoX___Xo__X______|27.94%|33.62%
0.6900|~315O|Xo_o___________oXoXoXoX_Xo__X______|29.48%|30.78%
0.6750|~33OO|X______________oXoXoXoXoXoX_X______|31.01%|27.94%
0.6600|~345O|X______________oXoXo_oXoXoXoX______|32.54%|25.09%
0.6450|~36OO|X______________o_o___oXoXoXoX______|34.08%|22.25%
0.6300|~375O|X____________________oXoXo_o_______|35.61%|19.41%
0.6150|~39OO|X____________________o_o___________|37.14%|16.57%
0.6000|~4O5O|X__________________________________|38.68%|13.72%
0.5850|~42OO|X__________________________________|40.21%|10.88%
0.5700|~435O|X__________________________________|41.74%|8.04%
0.5550|~45OO|X__________________________________|43.27%|5.19%
0.5400|~465O|X__________________________________|44.81%|2.35%
0.5250|~48OO|___________________________________|46.34%|-0.49%
Column|~495O|17337617156351314454365576331313343|
Count|~51OO||8_____2_O____2_3____________3_O____|
http://iticsoftware.com/postimages/2009-Jun-19/BJF-Trading-Group-AudUsd_0407.PNG http://iticsoftware.com/postimages/2009-Jun-19/bjf-trading-group-audusd_0407-2.gif
http://iticsoftware.com/postimages/2009-Jun-19/BJF-Trading-Group-AudUsd_0407.xls
Posted by: MDunleavy Apr 8, 2010, 10:28 AM
On the daily chart, although the New Zealand dollar retreated from 0.7180 to 0.6964, as price has rebounded from there, suggesting as long as this support holds, consolidation with mild upside bias remains and break of said resistance would bring stronger rebound to indicated upside target at 0.7221 (50% Fibonacci retracement of 0.7635 to 0.6807) and possibly towards 0.7319 (61.8% Fibonacci retracement) but reckon key resistance at 0.7445 would continue to hold.
"P&F NZDUSD1440 Box Size 1250X3 or(5.91%) HI/LO
Data 0.8214 - 0.4485 ~ 93 Month ~ 2809 Day
Database 2000 records 0.70291 (Last Close)
2002-07-30 00~00
2010-04-08 00~00 (GMT+01:00) Paris
http://iticsoftware.com chart"
0.8125|~125||___________________X___________________|1.08%|81.16%
0.8000|~25O||_________Xo________Xo__________________|2.61%|78.37%
0.7875|~375||_________Xo____X_X_Xo__________________|4.13%|75.59%
0.7750|~5OO||_________Xo__X_XoXoXo__________________|5.65%|72.8%
0.7625|~625||_________Xo__XoXoXoXo____________X_____|7.17%|70.01%
0.7500|~75O||_________Xo__XoXo_o_o____________XoX___|8.69%|67.22%
0.7375|~875||___X_____Xo__Xo_____o____________XoXoX_|10.21%|64.44%
0.7250|~1OOO|___Xo____XoX_X______o____________XoXoXo|11.74%|61.65%
0.7125|~1125|___XoX___XoXoX______o____________Xo_oXo|13.26%|58.86%
0.7000|~125O|_X_XoXo__XoXoX______o____________X__o_o|14.78%|56.08%
0.6875|~1375|_XoXoXo__XoXo_______oX___________X____o|16.3%|53.29%
0.6750|~15OO|_XoXo_o__Xo_________oXo__________X_____|17.82%|50.5%
0.6625|~1625|_XoX__o__X__________oXo__________X_____|19.35%|47.71%
0.6500|~175O|_XoX__o__X__________o_o__________X_____|20.87%|44.93%
0.6375|~1875|_XoX__oX_X____________o__________X_____|22.39%|42.14%
0.6250|~2OOO|_XoX__oXoX____________oX_________X_____|23.91%|39.35%
0.6125|~2125|_XoX__oXoX____________oXoX_______X_____|25.43%|36.57%
0.6000|~225O|_Xo___o_o_____________oXoXoX_____X_____|26.95%|33.78%
0.5875|~2375|_X____________________o_oXoXo__X_X_____|28.48%|30.99%
0.5750|~25OO|_X______________________oXoXo__XoX_____|30%|28.21%
0.5625|~2625|_X______________________oXoXo__XoX_____|31.52%|25.42%
0.5500|~275O|_X______________________oXoXo__Xo______|33.04%|22.63%
0.5375|~2875|_X______________________o_oXoX_X_______|34.56%|19.84%
0.5250|~3OOO|_X________________________o_oXoX_______|36.08%|17.06%
0.5125|~3125|_X__________________________oXoX_______|37.61%|14.27%
0.5000|~325O|_X__________________________o_o________|39.13%|11.48%
0.4875|~3375|_X_____________________________________|40.65%|8.7%
0.4750|~35OO|_X_____________________________________|42.17%|5.91%
0.4625|~3625|oX_____________________________________|43.69%|3.12%
0.4500|~375O|o______________________________________|45.22%|0.33%
Column|||||||228153933114373433351383767683373143434|
Count||||||||_O_1_____61_________3____________7_____|
http://iticsoftware.com/postimages/2009-Jul-01/BJF-Trading-Group-NadUsd_0408.PNG http://iticsoftware.com/postimages/2009-Jul-01/bjf-trading-group-nadusd_0408-2.gif
http://iticsoftware.com/postimages/2009-Jul-01/BJF-Trading-Group-NadUsd_0408.xls
Posted by: MDunleavy Apr 10, 2010, 06:00 PM
Strategy : Stand aside.
Despite intra-day brief bounce to 1.0763, as dollar quickly retreated from there on the back of euro’s strength, suggesting downside risk remains for retracement of recent rise from 1.0435 and current breach of the Kijun-Sen also adds credence to this view, then weakness to 1.0652 (38.2% Fibonacci retracement of 1.0435 to 1.0786) and possibly towards 1.0611 (50% Fibonacci retracement of 1.0435 to 1.0786) would be seen, however, reckon support at 1.0576-84 would limit downside today.
Only above said intra-day resistance at 1.0763 would revive our bullishness for test of 1.0786, then 1.0810, break of latter level would signal upmove from 0.9910 has resumed for retest of 1.0899 top next week.
"P&F USDCHF1440 Box Size 175X3 or(4.21%) HI/LO
Data 1.5311 - 0.9634 ~ 92 Month ~ 2800 Day
Database 2000 records 1.06561 (Last Close)
2002-08-09 00~00
2010-04-09 00~00 (GMT+01:00) Paris
http://iticsoftware.com chart"
1.5400|~175||________________________________________|-0.58%|59.85%
1.5225|~35O||_X_X____________________________________|0.56%|58.03%
1.5050|~525||_XoXo___________________________________|1.7%|56.22%
1.4875|~7OO||o_oXo___________________________________|2.85%|54.4%
1.4700|~875||o_o_o___________________________________|3.99%|52.58%
1.4525|~1O5O|____o___________________________________|5.13%|50.77%
1.4350|~1225|____o___________________________________|6.28%|48.95%
1.4175|~14OO|____o__X________________________________|7.42%|47.14%
1.4000|~1575|____oX_Xo_______________________________|8.56%|45.32%
1.3825|~175O|____oXoXo_______________________________|9.71%|43.5%
1.3650|~1925|____oXoXoX______________________________|10.85%|41.69%
1.3475|~21OO|____oXoXoXo_____________________________|11.99%|39.87%
1.3300|~2275|____o_oXoXo_____________________________|13.13%|38.05%
1.3125|~245O|______oXo_oX_______X_X__________________|14.28%|36.24%
1.2950|~2625|______o___oXo____X_XoXo_________________|15.42%|34.42%
1.2775|~28OO|__________oXoX___XoXoXo_________________|16.56%|32.6%
1.2600|~2975|__________oXoXo__XoXo_oX________________|17.71%|30.79%
1.2425|~315O|__________oXoXo__XoX__oXoX______________|18.85%|28.97%
1.2250|~3325|__________o_o_oX_Xo___oXoXo____X________|19.99%|27.15%
1.2075|~35OO|______________oXoX____o_oXo____Xo_______|21.14%|25.34%
1.1900|~3675|______________oXoX______o_o____Xo__X____|22.28%|23.52%
1.1725|~385O|==============oXoX========o====Xo==XoX==|23.42%|21.7%
1.1550|~4O25|______________oXo_________oX___Xo__XoXo_|24.56%|19.89%
1.1375|~42OO|______________o___________oXoX_Xo__XoXo_|25.71%|18.07%
1.1200|~4375|__________________________oXoXoXo__Xo_o_|26.85%|16.25%
1.1025|~455O|__________________________o_oXoXoX_X__o_|27.99%|14.44%
1.0850|~4725|============================oXo=oXoX==oX|29.14%|12.62%
1.0675|~49OO|____________________________oX__oXoX__oX|30.28%|10.81%
1.0500|~5O75|____________________________oX__o_o___oX|31.42%|8.99%
1.0325|~525O|____________________________oX________oX|32.56%|7.17%
1.0150|~5425|____________________________oX________oX|33.71%|5.36%
0.9975|~56OO|============================oX========o=|34.85%|3.54%
0.9800|~5775|____________________________o___________|35.99%|1.72%
0.9625|~595O|________________________________________|37.14%|-0.09%
Column|||||||2233146763855385484533634383193813384315|
Count||||||||____1_______________________O___O_____O_|
http://iticsoftware.com/postimages/2009-Aug-03/BJF-Trading-Group-UsdChf_0410_%281%29.PNG http://iticsoftware.com/postimages/2009-Aug-03/bjf-trading-group-usdchf_0410-2.gif
http://iticsoftware.com/postimages/2009-Aug-03/BJF-Trading-Group-UsdChf_0410.xls
Posted by: MDunleavy Apr 14, 2010, 09:29 AM
The underlying MT direction is bearish while the daily bias is bearish. Therefore the main risk is lower. Ensure that key resistances levels hold. Note key support levels that would suggest continuation of the bearish move. Consider confirming this with a bearish set up pattern in price or important that you consider either bullish or bearish set up patterns in indicators or lower time frame charts to support S&R breaks.
"P&F USDCAD15 Box Size 10X4 or(0.39%) HI/LO
Data 1.0302 - 0.9977 ~ 1 Month ~ 29.05 Day
Database 2000 records 0.99813 (Last Close)
2010-03-16 08~45
2010-04-14 10~00 (GMT+01:00) Paris
http://iticsoftware.com chart"
1.0300|~1O|||___________X___________________|0.02%|3.24%
1.0290|~2O|||___________Xo__________________|0.12%|3.14%
1.0280|~3O|||_________X_Xo__________________|0.21%|3.04%
1.0270|~4O|||_________XoXo__________________|0.31%|2.94%
1.0260|~5O|||_________XoXo__________________|0.41%|2.84%
1.0250|~6O|||_________XoXo__________________|0.5%|2.74%
1.0240|~7O|||_____X___XoXo__________________|0.6%|2.64%
1.0230|~8O|||_____Xo__XoXo__________________|0.7%|2.54%
1.0220|~9O|||_____XoX_XoXoX_________________|0.8%|2.44%
1.0210|~1OO||_____XoXoXoXoXoX_______________|0.89%|2.34%
1.0200|~11O||_____XoXoXoXoXoXo______________|0.99%|2.24%
1.0190|~12O||_____XoXoXoXoXoXoX_____________|1.09%|2.13%
1.0180|~13O||o__X_XoXoXoXo_oXoXo____________|1.18%|2.03%
1.0170|~14O||o__XoXo_oXo___oXoXo____________|1.28%|1.93%
1.0160|~15O||o__XoX__o_____o_oXo____________|1.38%|1.83%
1.0150|~16O||o__XoX__________oX4____________|1.48%|1.73%
1.0140|~17O||o__XoX__________oXo____________|1.57%|1.63%
1.0130|~18O||oX_XoX__________o_o____________|1.67%|1.53%
1.0120|~19O||oXoXoX____________oX___________|1.77%|1.43%
1.0110|~2OO||oXoXoX____________oXo__________|1.86%|1.33%
1.0100|~21O||oXoXoX____________oXoX_________|1.96%|1.23%
1.0090|~22O||oXo_oX____________oXoXo________|2.06%|1.13%
1.0080|~23O||oX__oX____________oXoXoX___X___|2.15%|1.03%
1.0070|~24O||o___o_____________o_oXoXoX_Xo__|2.25%|0.93%
1.0060|~25O||____________________oXoXoXoXoX_|2.35%|0.83%
1.0050|~26O||____________________oXoXoXoXoXo|2.45%|0.73%
1.0040|~27O||____________________oXoXoXoXoXo|2.54%|0.63%
1.0030|~28O||____________________oXoXo_oXoXo|2.64%|0.53%
1.0020|~29O||____________________oXoX__o_oXo|2.74%|0.43%
1.0010|~3OO||____________________oXoX____o_o|2.83%|0.33%
1.0000|~31O||____________________oXo_______o|2.93%|0.23%
0.9990|~32O||____________________oX________o|3.03%|0.13%
0.9980|~33O||____________________o__________|3.13%|0.03%
0.9970|~34O||_______________________________|3.22%|-0.07%
Column|||||||1649117561111465861511185456757|
Count||||||||2___17___2132_____2_42O________|
http://iticsoftware.com/postimages/2009-Aug-03/BJF-Trading-Group-UsdCad_0414.PNG http://iticsoftware.com/postimages/2009-Aug-03/bjf-trading-group-usdcad_0414-2.gif
http://iticsoftware.com/postimages/2009-Aug-03/BJF-Trading-Group-UsdCad_0414.xls
Posted by: MDunleavy Apr 17, 2010, 10:11 AM
Gold is still bounded in choppy sideway trading below 1170.7 and intraday bias remains neutral. Another fall might be seen but downside should be contained by 38.2% retracement of 1084.8 to 1170.7 at 1137.9 and bring rally resumption. Break of 1170.7 will target 100% projection of 1044.5 to 1145.8 from 1084.8 at 1186 level next.
In the bigger picture, price actions from 1227.5 are treated as correction to rise from 931.3 only, no doubt. The lack of impulsive structure of rise from 1044.5 argues it's possibly part of consolidation from 1227.5, rather than resumption of the long term up trend. Hence upside will likely be limited by 1227.5 high and bring at least one more fall before the consolidation concludes. On the downside, below 1084.8 support will indicate that the third leg of consolidations has started and should then target 1044.5 again.
"P&F GOLD1440 Box Size 30X2 or(7.89%) HI/LO
Data 1226.37 - 295.35 ~ 97 Month ~ 2943 Day
Database 2000 records 1137.11 (Last Close)
2002-03-26 00~00
2010-04-16 00~00 (GMT+01:00) Paris
http://docs.google.com/View?id=dcftkq53_137ckfzs8f6 chart"
http://iticsoftware.com/postimages/2009-Jul-01/BJF-Trading-Group-Gold_0417.PNG http://iticsoftware.com/postimages/2009-Jul-01/bjf-trading-group-gold_0417-2.gif
http://iticsoftware.com/postimages/2009-Jul-01/BJF-Trading-Group-Gold_0417.xls
Posted by: MDunleavy Apr 18, 2010, 06:38 PM
Commodity were hit hard with crude oil down to close at 83.24 while gold closed at 1136.9. Dollar managed to recover earlier losses against major currencies. While the sharp reversal in dollar pairs and yen crosses worth mentioning, it must be noted that the moves were not enough to confirm reversal in recent decline in the neither currencies yet. For example, the dollar index, which closed the week at 80.77, is still way off recent high of 82.24. Follow through selling in stocks and commodities is needed to push dollar and yen through near term resistance to confirm reversal.
"P&F _DY1440 Box Size1 30X2 or(2.89%) HI/LO
Data 109.24 - 70.7 ~ 93 Month ~ 2832 Day
Database 2000 records 80.77 (Last Close)
2002-07-15 00~00
2010-04-16 00~00 (GMT+01:00) Paris
http://docs.google.com/View?id=dcftkq53_137ckfzs8f6 chart"
http://iticsoftware.com/postimages/2009-Jul-01/BJF-Trading-Group-Dxy_0418.PNG http://iticsoftware.com/postimages/2009-Jul-01/bjf-trading-group-dxy_0418.gif
http://iticsoftware.com/postimages/2009-Jul-01/BJF-Trading-Group-Dxy_0418.xls
Posted by: MDunleavy Apr 20, 2010, 07:19 AM
GBPCAD Review and Outlook
=========================
GBPCAD=GbpUsdXUsdCad
GBP/USD closed higher due to short covering on Monday. The high-range close sets the stage for a steady to higher opening on Tuesday. Stochastics and the RSI are neutral signalling that sideways to higher prices are possible near-term. If it extends last week's decline, March's high crossing is the next downside target. Closes above the 20-day moving average crossing are needed to confirm a short-term low has been posted.
Long term bias for the USD/CAD bearish, the weekly close below 1,0250 signals further declines. Forming a base around parity.
"P&F GBPCAD1440 Box Size 300X3 or(4.65%) HI/LO
Data 2.3563 - 1.5115 ~ 58 Month ~ 1762 Day
Database 1303 records 1.5535 (Last Close)
2005-06-23 00~00
2010-04-20 00~00 (GMT+01:00) Paris
http://docs.google.com/View?id=dcftkq53_137ckfzs8f6 chart"
http://iticsoftware.com/postimages/2009-Jul-01/BJF-Trading-Group-GbpCad_0420.PNG http://iticsoftware.com/postimages/2009-Jul-01/bjf-trading-group-gbpcad_0420-2.gif
http://iticsoftware.com/postimages/2009-Jul-01/BJF-Trading-Group-GbpCad_0420.xls
Posted by: MDunleavy Apr 20, 2010, 11:46 PM
Crude Oil Falls As Inventories Are Seen High And Plenty Of Supply
Analysis - Commodity Market Commentaries
Written by Finotec | Tue Apr 20 10 01:13 ET
OPEC violating production quotas at the same time as demand from industrialized nations stagnates is spurring bets in the oil market that the 13-month rally in crude is coming to an end. It's a bubble and we don't know when it's going to go bust, but it's just a question of time,' said Eugen Weinberg, a senior analyst with Commerzbank AG in Frankfurt. 'So enjoy the party but stay close to the door.' U.S. demand will drop 9.4 percent to average 18.84 million barrels a day this year, from a record 20.8 million in 2005, the Energy Department said on April 6. The U.S. uses more than twice as much crude as China, the second-biggest consumer. India is fourth. Crude oil is trading at $83.40 as of 21:25pm, London-Time, with a bearish trend. Crude's Pool-Position is 33% Long, meaning that most Finotec clients are selling the commodity.
"P&F O I L (brent) Box Size4X3 or(13.77%) CLOSE
Data 147.53 - 26.7 ~ 80 Month ~ 2450 Day
Database 1676 records 85.25 (Last Close)
2003-08-04 00~00
2010-04-19 00~00 (GMT+01:00) Paris
http://docs.google.com/View?id=dcftkq53_137ckfzs8f6 chart"
http://iticsoftware.com/postimages/2009-Jul-01/BJF-Trading-Group-Oil_0421.PNG
http://iticsoftware.com/postimages/2009-Jul-01/BJF-Trading-Group-Oil_0421.xls
Posted by: MDunleavy Apr 24, 2010, 06:04 PM
What's In Store for the EUR and the USD Next Week?
At the end of a volatile trading week which has seen a turmoil in Greek bonds and has culminated with a formal request from Greece for financial aid from the EU and IMF, I explore the important economic events for the week ahead and ponder what they may bring for the EUR and the USD, I examine this morning's EUR strengthening and analyze the latest trend developments with the EUR/USD, EUR/JPY and EUR/GBP currency pairs, I note the bullish breakout of the USD vs. JPY, I examine the weakness of the GBP and CAD after series of disappointing economic reports from the U.K. and Canada.
This is my forecast!
"P&F EURUSD1440 Box Size 200X3 or(4.68%) HI/LO
Data 1.6038 - 0.9607 ~ 92 Month ~ 2796 Day
Database 2000 records 1.33811 (Last Close)
2002-08-27 00~00
2010-04-23 00~00 (GMT+01:00) Paris
http://docs.google.com/View?id=dcftkq53_137ckfzs8f6 chart"
http://iticsoftware.com/postimages/2009-Jun-19/BJF-Trading-Group-EurUsd_0424-MT.PNG http://iticsoftware.com/postimages/2009-Jun-19/BJF-Trading-Group-EurUsd_0424.PNG
http://iticsoftware.com/postimages/2009-Jun-19/BJF-Trading-Group-EurUsd_0424.xls
Posted by: MDunleavy Apr 27, 2010, 09:42 AM
EUR/CHF Weekly Outlook
Despite dipping to 1.4294 briefly, there was no follow through selling and EUR/CHF recovered back into familiar range. Outlook is turned neutral again and more choppy sideway trading might be seen. On the downside, break of 1.4294 will argue that rebound from 1.4143 is completed at 1.4465 already and turn bias to the downside for this support first. On the upside, above 1.4386 will suggest that stronger recovery might be seen. But after all, we'd continue to expect strong resistance near to 1.4557 support turned resistance to limit upside and bring fall resumption sooner or later.
"P&F EURCHF1440 Box Size 100X3 or(1.94%) HI/LO
Data 1.6827 - 1.4144 ~ 92 Month ~ 2811 Day
Database 2000 records 1.43556 (Last Close)
2002-08-16 00~00
2010-04-27 00~00 (GMT+01:00) Paris
http://docs.google.com/View?id=dcftkq53_152grsnq5c3 chart"
http://iticsoftware.com/postimages/2009-Jun-19/BJF-Trading-Group-EurChf_0427.PNG http://iticsoftware.com/postimages/2009-Jun-19/bjf-trading-group-eurchf_0427-2.gif
http://iticsoftware.com/postimages/2009-Jun-19/BJF-Trading-Group-EurChf_0427.xls
Posted by: MDunleavy May 1, 2010, 09:13 PM
The pound reverThe pound reversed below the new support level at $1.53, warning of a bull trap.
Expect another test of $1.48.
Recovery above $1.53, however, would signal a rally to $1.60, confirmed if the declining trendline is broken.
"P&F GBPUSD1440 Box Size 250X3 or(4.33%) HI/LO
Data 2.1161 - 1.3502 ~ 91 Month ~ 2797 Day
Database 2000 records 1.52649 (Last Close)
2002-09-02 00~00
2010-04-30 00~00 (GMT+01:00) Paris
http://docs.google.com/View?id=dcftkq53_152grsnq5c3 chart"
http://iticsoftware.com/postimages/2009-Jul-01/BJF-Trading-Group-GbpUsd_0105.PNG
http://iticsoftware.com/postimages/2009-Jul-01/BJF-Trading-Group-GbpUsd_0105.xls
Posted by: MDunleavy May 4, 2010, 08:18 AM
EURJPY Outlook
As you can see in charts below, the lower line of the bullish channel did a good job preventing further bearish pressure and keep the bullish scenario intact. The bias is neutral in nearest term as we haven't see significant bullish momentum so far. Immediate resistance at 125.65. Break above that area could trigger further bullish momentum targeting 126.50 region. Initial support at 124.66 (current low). Break below that area could trigger further downside pressure re-testing the lower line of the bullish channel once again.
"P&F EURJPY1440 Box Size200X3 or(4.25%) HI/LO
Data 169.97 - 112.16 ~ 37 Month ~ 1152 Day
Database 825 records 124.7 (Last Close)
2007-03-05 00~00
2010-04-30 00~00 (GMT+01:00) Paris
http://docs.google.com/View?id=dcftkq53_152grsnq5c3 chart"
http://iticsoftware.com/postimages/2009-Jul-01/BJF-Trading-Group-EURJPY_0504.PNG
http://iticsoftware.com/postimages/2009-Jul-01/BJF-Trading-Group-EURJPY_0504.xls
Posted by: MDunleavy May 5, 2010, 06:23 PM
USDJPY is currently trading 94.70 levels. A break above 94.30(2 days close), we could target 97-98 levels. Weekly close above 92 levels has increased chances for a bearish move for the yen currency. Importers hold for medium term covers. (USDJPY- 94.70). Long Term (3-6 months) target 98 and higher.We just need a conistent break of 94.30 to make thes happen.
"P&F USDJPY1440 Box Size 140X4 or(5.32%) HI/LO
Data 125.75 - 84.819 ~ 92 Month ~ 2800 Day
Database 2000 records 94.26 (Last Close)
2002-09-04 00~00
2010-05-05 00~00 (GMT+01:00) Paris
http://docs.google.com/View?id=dcftkq53_152grsnq5c3 chart"
http://iticsoftware.com/postimages/2009-Aug-03/BJF-Trading-Group-UsdJpy_0505.PNG
http://iticsoftware.com/postimages/2009-Aug-03/BJF-Trading-Group-UsdJpy_0505.xls
Posted by: MDunleavy May 11, 2010, 04:30 PM
After crossing the bearish trend line inside the upward trend channel, the NZD/USD pulled back from its horizontal resistance line around 0.7310. It was the markets' fifth touch with the lower line of the channel before it recovered back to its current price. If the market breaks the horizontal resistance around 0.7310, we might see further gains. Otherwise, it might continue its bullish zigzag phase inside the bullish channel.
"P&F NZDUSD1440 Box Size 125X3 or(5.83%) HI/LO
Data 0.8214 - 0.4644 ~ 93 Month ~ 2811 Day
Database 2000 records 0.71823 (Last Close)
2002-08-30 00~00
2010-05-11 00~00 (GMT+01:00) Paris
http://docs.google.com/View?id=dcftkq53_152grsnq5c3 chart"
http://iticsoftware.com/postimages/2009-Aug-03/BJF-Trading-Group-NzdUsd_0511.PNG
http://iticsoftware.com/postimages/2009-Aug-03/BJF-Trading-Group-NzdUsd_0511.xls
Posted by: MDunleavy May 12, 2010, 09:29 PM
Trade Idea: EURNZD - Sell at 1.800 Target: 1.6400, Stop: 1.8200
=============================================
We are going into a period of potentially unusual price action at the beginning
of the week. An extended holiday for US, UK and New Zealand markets will warp
liquidity which could lead to untimely breakouts or simply a drop back into
congestion bands. This presents significant risk to all range-based strategies;
but EURNZD may have a better grounding for holding its congestion.
"P&F EURNZD1440 Box Size 300X3 or(4.27%) HI/LO
Data 2.5792 - 1.6343 ~ 84 Month ~ 2562 Day
Database 1833 records 1.7729 (Last Close)
2003-05-07 00~00
2010-05-12 00~00 (GMT+01:00) Paris
http://docs.google.com/View?id=dcftkq53_152grsnq5c3 chart"
http://iticsoftware.com/postimages/2009-Jul-01/BJF-Trading-Group-EURNZD_0512.PNG
http://iticsoftware.com/postimages/2009-Jul-01/BJF-Trading-Group-EURNZD_0512.xls
Posted by: MDunleavy May 14, 2010, 07:46 AM
Trade Idea: USDCHF - Sell at 1.1120 Target: 1.0920, Stop: 1.1200
===============================================
The pair is still fluctuating around pivotal resistance 1.1120; whereas the bullish technical pattern is still intact and awaits a start signal that will be achieve through building a base above 1.1120. MA 50 is supporting the pair to move to the upside, therefore we expect a bullish intraday trend that targets 1.1250 – 1.1290 and requires the four hour close above 1.1050.
"P&F USDCHF1440 Box Size 200X3 or(4.83%) HI/LO
Data 1.5176 - 0.9644 ~ 92 Month ~ 2787 Day
Database 2001 records 1.1172 (Last Close)
2002-09-26 00~00
2010-05-14 00~00 (GMT+01:00) Paris
http://iticsoftware.com chart"
1.5200|~2OO||____________________________________________________|-0.16%|57.61%
1.5000|~4OO||o___________________________________________________|1.16%|55.54%
1.4800|~6OO||o___________________________________________________|2.48%|53.46%
1.4600|~8OO||o___________________________________________________|3.8%|51.39%
1.4400|~1OOO|o_____+_____________________________________________|5.11%|49.32%
1.4200|~12OO|o_____x_+___________________________________________|6.43%|47.24%
1.4000|~14OO|o_x___x_o_+_________________________________________|7.75%|45.17%
1.3800|~16OO|o_x_o_x_o_x_+_______________________________________|9.07%|43.09%
1.3600|~18OO|o_x_o_x_o_x_o_+_____________________________________|10.38%|41.02%
1.3400|~2OOO|o___o_x_o_x_o___+_____________+_____________________|11.7%|38.95%
1.3200|~22OO|____o_x_o___o_x___+_______x___x_+___________________|13.02%|36.87%
1.3000|~24OO|____o_x_____o_x_o___+_x___x_o_x_o_+_________________|14.34%|34.8%
1.2800|~26OO|____o_______o_x_o_____x_o_x_o_x_o___+_______________|15.66%|32.73%
1.2600|~28OO|____________o_x_o_____x_o_x_o_+_o_x___+_____________|16.97%|30.65%
1.2400|~3OOO|____________o_x_o_____x_o___+___o_x_o___+___________|18.29%|28.58%
1.2200|~32OO|____________o___o_x___x___+_____o_x_o_____x_________|19.61%|26.5%
1.2000|~34OO|________________o_x_o_x_+_______o___o_____x_o_______|20.93%|24.43%
1.1800|~36OO|________________o_x_o_x_____________o_____x_o_x_____|22.25%|22.36%
1.1600|~38OO|________________o_x_o_______________o_____x_o_x_o___|23.56%|20.28%
1.1400|~4OOO|________________o_+_________________o_x___x_o_x_o_+_|24.88%|18.21%
1.1200|~42OO|________________+___________________o_x_o_x_o_x_o_x_|26.2%|16.13%
1.1000|~44OO|____________________________________o_x_o_x_o_x_o_x_|27.52%|14.06%
1.0800|~46OO|____________________________________o_x_o___o_x_o_x_|28.84%|11.99%
1.0600|~48OO|____________________________________o_x_____o_x_o_x_|30.15%|9.91%
1.0400|~5OOO|____________________________________o_x_____o___o_x_|31.47%|7.84%
1.0200|~52OO|____________________________________o_x_________o_x_|32.79%|5.77%
1.0000|~54OO|____________________________________o_x_________o_+_|34.11%|3.69%
0.9800|~56OO|____________________________________o___________+___|35.42%|1.62%
0.9600|~58OO|____________________________________________________|36.74%|-0.46%
Column|||||||9_3_6_7_5_3_8_5_9_4_3_7_3_4_3_3_6_3_1_8_3_7_9_7_9_6_|
Count||||||||____________________________________4_______________|
http://iticsoftware.com/postimages/2009-Jun-19/BJF-Trading-Group-UsdChf_0513.PNG
http://iticsoftware.com/postimages/2009-Jun-19/BJF-Trading-Group-UsdChf_0513.xls
Posted by: MDunleavy May 16, 2010, 01:46 PM
Trade Idea:EUR/USD - Buy-stop at 1.2650 Target: 1.2800 ; Stop: 1.2575
======================================================================
Price action on EUR/USD, a chart of which is shown, has just broken down swiftly below the key 1.2500 support level, establishing a new 18-month low and lending a significant additional bearish bias to this strongly downtrending currency pair.
A continuation of the steep overall downtrend has now been confirmed, with price currently targeting a key downside support target in the 1.2300 price region.
Any substantial breakdown below 1.2300 could potentially begin to target the technically- and psychologically-important 1.2000 level, which is also around a 161.8% Fibonacci extension of the most recent bearish run.
The broken 1.2500 level should now serve as tentative upside resistance within the context of the strong current downtrend.
"P&F EURUSD1440 Box Size 200X3 or(4.68%) HI/LO
Data 1.6038 - 0.9607 ~ 92 Month ~ 2796 Day
Database 2000 records 1.23566 (Last Close)
2002-09-17 00~00
2010-05-14 00~00 (GMT+01:00) Paris
http://docs.google.com/View?id=dcftkq53_152grsnq5c3 chart"
http://iticsoftware.com/postimages/2009-Jun-19/BJF-Trading-Group-EURUSD_0515.png
http://iticsoftware.com/postimages/2009-Jun-19/BJF-Trading-Group-EURUSD_0515.xls
Posted by: MDunleavy May 19, 2010, 10:03 AM
Trade Idea: GBP\JPY - Sell-Limin at 133.20; Target: 126.10 ; Stop: 135.00
=========================================================================
The GBPJPY attempted to push higher yesterday, topped at 134.79 but whipsawed to the downside, bottomed at 131.82 and hit 130.40 earlier today in Asian session. The bias is bearish in nearest term testing 129.89 area. However price is already in oversold area so watch out for potential upside correction testing 133.00 resistance area. Break above that area could lead us into no trading zone as direction would become unclear but the main scenario remains to the downside and I still prefer short on rallies strategy at this phase.
"P&F GBPJPY1440 Box Size400X3 or(6.49%) HI/LO
Data 251.09 - 118.785 ~ 92 Month ~ 2812 Day
Database 2001 records 131.555 (Last Close)
2002-09-06 00~00
2010-05-19 00~00 (GMT+01:00) Paris
http://iticsoftware.com chart"
252.00|~4OO||________________+_______________________________|-0.36%|112.15%
248.00|~8OO||________________x_o_____________________________|1.23%|108.78%
244.00|~12OO|________________x_o_+___________________________|2.82%|105.41%
240.00|~16OO|____________x___x_o_x_+_________________________|4.42%|102.05%
236.00|~2OOO|____________x_o_x_o_x_o_+_______________________|6.01%|98.68%
232.00|~24OO|____________x_o_x_o_x_o___+_____________________|7.6%|95.31%
228.00|~28OO|____________x_o_x_o_x_o_____+___________________|9.2%|91.94%
224.00|~32OO|____________x_o___o_x_o_______+_________________|10.79%|88.58%
220.00|~36OO|____________x_____o___o_________+_______________|12.38%|85.21%
216.00|~4OOO|____________x_________o___________+_____________|13.98%|81.84%
212.00|~44OO|____________x_______+_o_x___________+___________|15.57%|78.47%
208.00|~48OO|____x_______x_____+___o_x_o___________+_________|17.16%|75.11%
204.00|~52OO|____x_o_x___x___+_____o_x_o_____________+_______|18.75%|71.74%
200.00|~56OO|____x_o_x_o_x_+_______o_x_o_______________+_____|20.35%|68.37%
196.00|~6OOO|x___x_o_x_o_x_________o___o_________________+___|21.94%|65%
192.00|~64OO|x_o_x_o___o_______________o___________________+_|23.53%|61.64%
188.00|~68OO|x_o_x___+_________________o_____________________|25.13%|58.27%
184.00|~72OO|__o_x_+___________________o_____________________|26.72%|54.9%
180.00|~76OO|__o_+_____________________o_x___________________|28.31%|51.53%
176.00|~8OOO|__+_______________________o_x_o_________________|29.91%|48.17%
172.00|~84OO|__________________________o_x_o_________________|31.5%|44.8%
168.00|~88OO|__________________________o___o_________________|33.09%|41.43%
164.00|~92OO|______________________________o_x_______________|34.68%|38.06%
160.00|~96OO|______________________________o_x_o_x___x_______|36.28%|34.7%
156.00|~1OOO|______________________________o_x_o_x_o_x_o_____|37.87%|31.33%
152.00|~1O4O|______________________________o_x_o_x_o_x_o_x___|39.46%|27.96%
148.00|~1O8O|______________________________o_x_o_x_o___o_x_o_|41.06%|24.59%
144.00|~112O|______________________________o_x_o_x_____o_x_o_|42.65%|21.23%
140.00|~116O|______________________________o___o_x_____o___o_|44.24%|17.86%
136.00|~12OO|__________________________________o_x_______+_o_|45.84%|14.49%
132.00|~124O|__________________________________o_x_____+___o_|47.43%|11.13%
128.00|~128O|__________________________________o_x___+_____+_|49.02%|7.76%
124.00|~132O|__________________________________o_x_+_________|50.62%|4.39%
120.00|~136O|__________________________________o_+___________|52.21%|1.02%
116.00|~14OO|__________________________________+_____________|53.8%|-2.34%
Column|||||||3_4_7_4_3_3_1_4_6_8_5_1_4_1_3_1_6_1_1_3_3_5_3_5_|
Count||||||||____________2_________1___1___O___1_O___________|
http://iticsoftware.com/postimages/2009-Jul-01/BJF-Trading-Group-MainGbpJpy_0509.PNG
http://iticsoftware.com/postimages/2009-Jul-01/BJF-Trading-Group-GbpJpy_0519.xls
Posted by: MDunleavy May 25, 2010, 03:00 PM
Trade Idea:EUR/GBP - Sell Limit at 85.30 Target: 84.00 ; Stop:86.10
==========================================
The royal pair closed negatively yesterday below the initial support levels-turned into resistance at 0.8605-. Consequently, it might retest the broken downtrend line of the descending channel before resuming the bullishness, which is based on the suggested double bottom formation. We are not sure that the above mentioned trend line could assist the pair to consolidate once more as the indicators shows consecutive negative signs. Thus, we need more confirmation and therefore our outlook will be neutral until we see a stable move above 0.8605 zones.
The trading range for today is among the key support at 0.8420 and key resistance now at 0.8720
"P&F EURGBP1440 Box Size 120X3 or(4.49%) HI/LO
Data 0.9799 - 0.6244 ~ 92 Month ~ 2808 Day
Database 2000 records 0.85229 (Last Close)
2002-09-16 00~00
2010-05-25 00~00 (GMT+01:00) Paris
http://docs.google.com/View?id=dcftkq53_152grsnq5c3 MDunleavy chart"
http://iticsoftware.com/postimages/201005/BJF-Trading-Group-EurGbp20100525.PNG
http://iticsoftware.com/postimages/201005/BJF-Trading-Group-EurGbp0525.xls
Posted by: MDunleavy May 26, 2010, 07:20 PM
Trade Idea: USD/CAD - Buy Limit at 1.044; Target: 1.084 ; Stop: 1.028.
=================================================
Since the middle of May, the USD/CAD has been trading in a bullish trend. Recently, the prices rebounded at its upper Fibonacci Fan and could recover at its Fan around 1.0645 (50.0). Now it seems that the USD could start a pull back. Important is a breakthrough of the 61.8 Fan. Also the crossing Stoch indicator through the signal line from below may indicate a further bullish trend.
"P&F USDCAD1440 Box Size 200X3 or(4.79%) HI/LO
Data 1.5995 - 0.9056 ~ 92 Month ~ 2812 Day
Database 2000 records 1.06469 (Last Close)
2002-09-13 00~00
2010-05-26 00~00 (GMT+01:00) Paris
http://iticsoftware.com MDunleavy chart"
1.6000|~2OO||+_____________________________________________|-0.03%|76.68%
1.5800|~4OO||x_o___________________________________________|1.22%|74.47%
1.5600|~6OO||__o_+_________________________________________|2.47%|72.26%
1.5400|~8OO||__o___+_______________________________________|3.72%|70.05%
1.5200|~1OOO|__o_____+_____________________________________|4.97%|67.84%
1.5000|~12OO|__o_______+___________________________________|6.22%|65.64%
1.4800|~14OO|__o_________+_________________________________|7.47%|63.43%
1.4600|~16OO|__o___________+_______________________________|8.72%|61.22%
1.4400|~18OO|__o_____________+_____________________________|9.97%|59.01%
1.4200|~2OOO|__o_______________+___________________________|11.22%|56.8%
1.4000|~22OO|__o_x___x___________+_________________________|12.47%|54.59%
1.3800|~24OO|__o_x_o_x_o___________+_______________________|13.72%|52.39%
1.3600|~26OO|__o_x_o_x_o_____________+_____________________|14.97%|50.18%
1.3400|~28OO|__o___o_x_o_______________+___________________|16.22%|47.97%
1.3200|~3OOO|______o_x_o_________________+_______+_________|17.47%|45.76%
1.3000|~32OO|______o_x_o_____________x_____+_x___x_+_______|18.72%|43.55%
1.2800|~34OO|______o___o_____________x_o_x___x_o_x_o_+_____|19.97%|41.34%
1.2600|~36OO|__________o_x___________x_o_x_o_x_o_x_o___+___|21.23%|39.13%
1.2400|~38OO|__________o_x_o_________x_o_x_o_x_o_x_o_____+_|22.48%|36.93%
1.2200|~4OOO|__________o_x_o_________x_o_x_o___o_x_o_______|23.73%|34.72%
1.2000|~42OO|__________o_x_o_____x___x_o_x_____o_x_o_______|24.98%|32.51%
1.1800|~44OO|__________o___o_x___x_o_x_o_x_____o___o_______|26.23%|30.3%
1.1600|~46OO|______________o_x_o_x_o_x_o___________o_x_____|27.48%|28.09%
1.1400|~48OO|______________o_x_o_x_o_______________o_x_o___|28.73%|25.88%
1.1200|~5OOO|______________o_x_o_x_________________o_x_o___|29.98%|23.67%
1.1000|~52OO|______________o___o_x_________________o_x_o___|31.23%|21.47%
1.0800|~54OO|==================o=x===============+=o===o=x=|32.48%|19.26%
1.0600|~56OO|__________________o_x_____________+_______o_x_|33.73%|17.05%
1.0400|~58OO|__________________o_x___________+_________o_x_|34.98%|14.84%
1.0200|~6OOO|__________________o_x_________+___________o_x_|36.23%|12.63%
1.0000|~62OO|==================o=x=======+=============o=+=|37.48%|10.42%
0.9800|~64OO|__________________o_x_____+_______________+___|38.73%|8.22%
0.9600|~66OO|__________________o_x___+_____________________|39.98%|6.01%
0.9400|~68OO|__________________o_x_+_______________________|41.23%|3.8%
0.9200|~7OOO|__________________o_+_________________________|42.48%|1.59%
0.9000|~72OO|__________________+___________________________|43.73%|-0.62%
Column|~74OO|1_1_3_6_6_1_4_8_4_1_1_3_8_7_6_3_4_6_6_1_4_8_4_|
Count||~76OO|__3_______1_______3_4_________________1_______|
http://iticsoftware.com/postimages/201005/BJF-Trading-Group-UsdCad0526.PNG
http://iticsoftware.com/postimages/201005/BJF-Trading-Group-UsdCad0526.xls
Posted by: MDunleavy May 28, 2010, 09:10 AM
Trade Idea: GOLD - Sell at 1212/1218 Target: 1182/1176 ; Stop: 1236
==================================================
Gold's pull back from 1249.7 has possibly completed at 1166 already. Intraday bias remains
mildly on the upside for 1249.7 resistance first. Break will confirm up trend resumption for
1300 psychological level next. However, note that firm break of 1170.7 will argue that whole
rise from 1044.5 is completed and will turn outlook bearish for 1124.3 support instead.
"P&F GOLD1 Box Size $0.5X4 or(0.17%) CLOSE
Data 1218.21 - 1205.91 ~ 0 Month ~ 1.63 Day
Database 2198 records 1212.59 (Last Close)
2010-05-26 17~03
2010-05-28 08~09 (GMT+01:00) Paris
http://docs.google.com/View?id=dcftkq53_152grsnq5c3 MDunleavy chart"
1218.00|~5O|||__________________x_+_______________________________________|0.02%|1%
1217.50|~1OO||__________________x_o_+_____________________________________|0.06%|0.96%
1217.00|~15O||__________________x_o___+___________________________________|0.1%|0.92%
1216.50|~2OO||__________________x_o_x___+_______________+_________________|0.14%|0.88%
1216.00|~25O||__________________x_o_x_o___+_____________x_+_______________|0.18%|0.84%
1215.50|~3OO||__________________x_o_x_o_____+___________x_o_+_____________|0.22%|0.8%
1215.00|~35O||__________________x_o_x_o_______+_________x_o___+___________|0.26%|0.75%
1214.50|~4OO||__________________x_o___o_________+_______x_o_____+_________|0.3%|0.71%
1214.00|~45O||o=============x===x=====o=====x=====+=====x=o=======+=====+=|0.35%|0.67%
1213.50|~5OO||o_x___________x_o_x_____o_____x_o_____+___x_o_x_______+___x_|0.39%|0.63%
1213.00|~55O||o_x_o_x_______x_o_x_____o_x___x_o_____x_+_x_o_x_o_______+_x_|0.43%|0.59%
1212.50|~6OO||o_x_o_x_o_x___x_o_x_____o_x_o_x_o_____x_o_x_o_x_o_x___x___x_|0.47%|0.55%
1212.00|~65O||o_x_o_x_o_x_o_x_o_x_____o_x_o_x_o_____x_o_x_o_x_o_x_o_x_o_x_|0.51%|0.51%
1211.50|~7OO||o_x_o_x_o_x_o_x_o_x_____o_x_o_x_o_____x_o_x_o_x_o_x_o_x_o_x_|0.55%|0.46%
1211.00|~75O||o_x_o___o_x_o_x_o_x_____o_x_o_x_o_____x_o_x_o_x_o_x_o_x_o_x_|0.59%|0.42%
1210.50|~8OO||o_______o_x_o___o_x_____o___o_x_o_____x_o_x_o___o___o_+_o_x_|0.63%|0.38%
1210.00|~85O||========o=======o=x=========o===o=====x=o===========+===o=x=|0.67%|0.34%
1209.50|~9OO||________________o_______________o_x___x___________+_____o_x_|0.71%|0.3%
1209.00|~95O||________________________________o_x_o_x_________+_______o_x_|0.76%|0.26%
1208.50|~1OOO|________________________________o_x_o_x_______+_________o_x_|0.8%|0.21%
1208.00|~1O5O|________________________________o_x_o_x_____+___________o_+_|0.84%|0.17%
1207.50|~11OO|________________________________o_x_o_x___+_____________+___|0.88%|0.13%
1207.00|~115O|________________________________o_x_o_x_+___________________|0.92%|0.09%
1206.50|~12OO|________________________________o_x_o_+_____________________|0.96%|0.05%
1206.00|~125O|________________________________o_x_+_______________________|1%|0.01%
1205.50|~13OO|________________________________o_+_________________________|1.04%|-0.03%
|~135O||||||||________________________________+___________________________|100%|-100%
Column||~14OO|8_6_5_4_6_5_4_7_9_1_7_4_1_5_6_8_1_8_6_1_6_1_1_6_6_4_4_4_9_1_|
Count|||~145O|__________________7_____2_______7_____3___2_1_____________1_|
http://iticsoftware.com/postimages/201005/BJF-Trading-Group-Gold0528.PNG http://iticsoftware.com/postimages/201005/BJF-TGGold0528.PNG
http://iticsoftware.com/postimages/201005/BJF-Trading-Group-Gold0528.xls
Posted by: MDunleavy May 29, 2010, 08:32 PM
Trade Idea: EUR/AUD - Sell at 1.4490; Target: 1.3930 ; Stop: 1.4630.
==================================================
EUR/AUD's sharp fall last week suggests that medium term down trend is resuming and a break of
1.4490 support will confirm this case and target lower trend line support (now at 1.4280) or
further to 1.3930 (last low). While some recovery might be seen, break of 1.5400 resistance is
needed to be the first sign of bottoming. Otherwise, outlook in EUR/AUD will remain bearish.
"P&F EURAUD1440 Box Size 250X3 or(4.28%) HI/LO
Data 2.1126 - 1.3928 ~ 48 Month ~ 1479 Day
Database 1050 records 1.44786 (Last Close)
2006-05-10 00~00
2010-05-28 00~00 (GMT+01:00) Paris
http://docs.google.com/View?id=dcftkq53_152grsnq5c3 MDunleavy chart"
2.1000|~25O||________________x___x___________________x_+_________________|0.6%|50.78%
2.0750|~5OO||________________x_o_x_o_____x___________x_o_+_______________|1.78%|48.98%
2.0500|~75O||________________x_o_x_o_x___x_o_____x___x_o___+_____________|2.96%|47.19%
2.0250|~1OOO|________________x_o_x_o_x_o_x_o_____x_o_x_o_x___+___________|4.15%|45.39%
2.0000|~125O|________________x_o_x_o_x_o_x_o_____x_o_x_o_x_o_x_+_________|5.33%|43.6%
1.9750|~15OO|________________x_o_x_o_x_o_x_o_____x_o_x_o_x_o_x_o_+_______|6.51%|41.8%
1.9500|~175O|________________x_o_x_o_x_o_x_o_____x_o___o_x_o_x_o___+_____|7.7%|40.01%
1.9250|~2OOO|________________x_o___o_x_o_x_o_x___x_____o_x_o___o_____+___|8.88%|38.21%
1.9000|~225O|________________x_____o___o___o_x_o_x_____o_x_____o_______+_|10.06%|36.42%
1.8750|~25OO|________________x_____________o_x_o_x_____o_______o_________|11.25%|34.62%
1.8500|~275O|================x=============o=+=o===============o=========|12.43%|32.83%
1.8250|~3OOO|________________x_____________+___________________o_________|13.61%|31.03%
1.8000|~325O|________________x___________+_____________________o_x_______|14.8%|29.24%
1.7750|~35OO|________________x_________+_______________________o_x_o_____|15.98%|27.44%
1.7500|~375O|________________x_______+_________________________o_x_o_____|17.16%|25.65%
1.7250|~4OOO|x===x=======x===x=====+===========================o===o=====|18.35%|23.85%
1.7000|~425O|x_o_x_o_x___x_o_x___+_________________________________o_____|19.53%|22.06%
1.6750|~45OO|x_o_x_o_x_o_x_o_x_+___________________________________o_____|20.71%|20.26%
1.6500|~475O|__o_x_o_x_o_x_o_x_____________________________________o_____|21.9%|18.47%
1.6250|~5OOO|__o_x_o_x_o_x_o_______________________________________o_____|23.08%|16.67%
1.6000|~525O|__o_x_o_x_o_+_________________________________________o_____|24.26%|14.88%
1.5750|~55OO|__o_x_o_x_+___________________________________________o_____|25.45%|13.08%
1.5500|~575O|==o===o=+=============================================o=====|26.63%|11.29%
1.5250|~6OOO|______+_______________________________________________o_x___|27.81%|9.49%
1.5000|~625O|______________________________________________________o_x_o_|29%|7.7%
1.4750|~65OO|______________________________________________________o_x_o_|30.18%|5.9%
1.4500|~675O|______________________________________________________o_x_o_|31.36%|4.11%
1.4250|~7OOO|______________________________________________________o_x_+_|32.55%|2.31%
1.4000|~725O|______________________________________________________o_+___|33.73%|0.52%
1.3750|~75OO|______________________________________________________+_____|
Column|~775O|3_7_7_7_6_4_5_4_1_7_7_8_6_6_7_9_3_3_8_4_6_9_6_4_3_1_3_1_5_3_|
Count||~8OOO|________________9_________________________________1___6_____|
http://iticsoftware.com/postimages/201005/BJF-Trading-Group-EurAud0528.PNG
http://iticsoftware.com/postimages/201005/BJF-Trading-Group-EurAud0528.xls
Posted by: MDunleavy Jun 1, 2010, 08:55 AM
Trade Idea: AUD/JPY - Buy Stop at 77.00;Target: 81.50 ; Stop: 76.00.
===============================================================
After reaching its highest level in the last week, the AUD rebounded at its resistance around 77.36. The currency pair has begun its bearish trend in the middle of May. Now it could be that the AUD will continue its downfall. Next support to stop the trend is may be around 75.46. Nevertheless, I think need to buy!
"P&F AUDJPY1440 Box Size 175X3 or(6.44%) HI/LO
Data 107.86 - 55.11 ~ 33 Month ~ 1015 Day
Database 720 records 76.839 (Last Close)
2007-08-20 00~00
2010-05-31 00~00 (GMT+01:00) Paris
http://docs.google.com/View?id=dcftkq53_152grsnq5c3 chart"
http://iticsoftware.com/postimages/201005/BJF-Trading-Group-AUDJPY0601.PNG http://iticsoftware.com/postimages/BJF-TG-0601.gif
http://iticsoftware.com/postimages/201005/BJF-Trading-Group-AudJpy0105.xls
Posted by: MDunleavy Jun 3, 2010, 02:46 PM
US Dollar Index (DXY)
The US Dollar Index is retracing to test short-term support at 85 after breaking out of its
trend channel. Failure would signal the end of the rally and a test of the lower trend channel.
Upward breakout remains as likely, however, and would offer a short-term target of 90.00
"P&F _DXY1440 Box Size 120X3 or(4%) HI/LO
Data 109.24 - 70.7 ~ 94 Month ~ 2834 Day
Database 2000 records 86.49 (Last Close)
2002-08-30 00~00
2010-06-03 00~00 (GMT+01:00) Paris
http://iticsoftware.com MDunleavy chart"
109.2|~12O||__x_+___________________________________________|0.04%|54.46%
108.0|~24O||__x_o_+_________________________________________|1.14%|52.76%
106.8|~36O||__x_o___+_______________________________________|2.23%|51.06%
105.6|~48O||o___o_____+_____________________________________|3.33%|49.36%
104.4|~6OO||o___o_______+___________________________________|4.43%|47.67%
103.2|~72O||____o_________+_________________________________|5.53%|45.97%
102.0|~84O||____o_x_________+_______________________________|6.63%|44.27%
100.8|~96O||____o_x_o_________+_____________________________|7.73%|42.57%
99.60|~1O8O|____o_x_o___________+___________________________|8.82%|40.88%
98.40|~12OO|____o___o_x___________+_________________________|9.92%|39.18%
97.20|~132O|________o_x_o___________+_______________________|11.02%|37.48%
96.00|~144O|________o_x_o_____________+_____________________|12.12%|35.79%
94.80|~156O|________o_x_o_______________+___________________|13.22%|34.09%
93.60|~168O|________o_x_o_________________+_________________|14.32%|32.39%
92.40|~18OO|________o___o_____________x_____+_______________|15.42%|30.69%
91.20|~192O|____________o_x___________x_o_____+_____________|16.51%|29%
90.00|~2O4O|____________o_x_o_____x___x_o_______+___________|17.61%|27.3%
88.80|~216O|____________o_x_o_____x_o_x_o_________x_________|18.71%|25.6%
87.60|~228O|____________o_x_o_____x_o_x_o_x___x___x_o_____+_|19.81%|23.9%
86.40|~24OO|____________o_x_o_____x_o___o_x_o_x_o_x_o_x___x_|20.91%|22.21%
85.20|~252O|____________o___o_x___x___+_o_x_o_x_o_x_o_x_o_x_|22.01%|20.51%
84.00|~264O|________________o_x_o_x_+___o_x_o___o_x_o_x_o_x_|23.11%|18.81%
82.80|~276O|________________o_x_o_x_____o_x_____o_x_o___o_x_|24.2%|17.11%
81.60|~288O|________________o_x_o_______o_x_____o_x_____o_x_|25.3%|15.42%
80.40|~3OOO|________________o_+_________o_x_____o_x_____o_x_|26.4%|13.72%
79.20|~312O|________________+___________o_x_____o_x_____o_x_|27.5%|12.02%
78.00|~324O|____________________________o_x_____o_____+_o_x_|28.6%|10.33%
76.80|~336O|____________________________o_x_________+___o_x_|29.7%|8.63%
75.60|~348O|____________________________o_x_______+_____o_x_|30.79%|6.93%
74.40|~36OO|____________________________o_x_____+_______o_+_|31.89%|5.23%
73.20|~372O|____________________________o_x___+_________+___|32.99%|3.54%
72.00|~384O|____________________________o_x_+_______________|34.09%|1.84%
70.80|~396O|____________________________o_+_________________|35.19%|0.14%
69.60|~4O8O|____________________________+___________________|36.29%|-1.56%
Column||||||2_3_9_3_8_5_1_5_9_4_3_7_3_5_1_1_3_3_8_9_5_3_1_1_|
Count|||||||____________1_______________8_4_____________O_O_|
http://iticsoftware.com/postimages/201005/BJF-Trading-Group-Dxy0603.PNG http://iticsoftware.com/postimages/201005/2010-Jun-03_09%7E40%7E24.gif
http://iticsoftware.com/postimages/201005/BJF-Trading-Group-Dxy0603.xls
Posted by: MDunleavy Jun 5, 2010, 01:52 PM
Trade Idea: AUD/CAD - Sell Limit at 0.8790; Target: 0.8560 ; Stop: 0.8840.
==========================================================================
The AUD/CAD has been trading close to a bearish trend-line since the beginning of 2010 and boosted
this trend in May once again. But it fell to a multi month low yesterday at 0.8668. Now it seems
that the currency pair may try to build a basement around this level. The CCI recovered near its -
100 level and the RSI indicator may suggest an oversold market adding signs that the bulls could
try to cross the stronger bearish trend-line.
"P&F AUDCAD1440 Box Size 10X4 or(4.52%) HI/LO
Data 1.055 - 0.7164 ~ 92 Month ~ 2795 Day
Database 2000 records 0.87781 (Last Close)
2002-10-09 00~00
2010-06-04 00~00 (GMT+01:00) Paris
http://docs.google.com/View?id=dcftkq53_160f5rf86gg MDunleavy chart"
http://iticsoftware.com/postimages/201005/BJF-Trading-Group-AUDCAD0605.PNG
http://iticsoftware.com/postimages/201005/BJF-Trading-Group-AudCad0605.xls
Posted by: MDunleavy Jun 8, 2010, 02:26 PM
Continued to be a tug of war between bulls and bears, crude oil price initially fell below 70,
extending Friday's weakness after disappointing US payrolls and worries over Hungary's fiscal
condition, but then rebounded to as high as 72.49 after an encouraging employment trend survey
released by the Conference Board and a speech from Fed Chairman Ben Bernanke. Yet, concerns over
Eurozone have persisted and price retreated in late trade. The front-month WTI contract ended the
day flat at 71.44. Corresponding Brent crude contract moved in a similar pattern but closed at
73.59. Today in Asia, oil prices trade with upward bias, as Asian stocks recover after yesterday's
selloff.
"P&F O I L (brent) Box Size $4X2 or(9.1%) HI/LO
Data 149.51 - 26.25 ~ 81 Month ~ 2492 Day
Database 345 records 72.98 (Last Close)
2003-08-04 00~00
2010-05-31 00~00 (GMT+01:00) Paris
http://docs.google.com/View?id=dcftkq53_160f5rf86gg MDunleavy chart"
http://iticsoftware.com/postimages/201005/BJF-Trading-Group-Oil0608.PNG
http://iticsoftware.com/postimages/201005/BJF-Trading-Group-Oil0608.xls
Posted by: MDunleavy Jun 11, 2010, 08:56 AM
Trade Idea: EUR/CAD - Buy Stop at 1.2540; Target: 1.2660 ; Stop: 1.2360.
(At first)
Trade Idea: EUR/CAD - Sell Limit at 1.2660; Target: 1.236 ; Stop: 1.2780.
(Then)
After trading above the middle line of the pitchfork channel over the past trading days, the
EUR/CAD has decided to break the middle level of the fork. As you can see, the pair is still
trading inside the bearish trend channel from the end of May. This might be a signal for
further falls inside the downward trend channel.
"P&F EURCAD1440 Box Size 150X4 or(4.01%) HI/LO
Data 1.7499 - 1.2449 ~ 50 Month ~ 1528 Day
Database 1085 records 1.24864 (Last Close)
2006-04-04 00~00
2010-06-10 00~00 (GMT+01:00) Paris
http://docs.google.com/View?id=dcftkq53_160f5rf86gg#EURCAD1440 MDunleavy chart"
1.7400|~15O||____________________________x___x_+_________________________|0.57%|39.77%
1.7250|~3OO||____________________________x_o_x_o_+_______________________|1.42%|38.57%
1.7100|~45O||____________________________x_o_x_o___+_____________________|2.28%|37.36%
1.6950|~6OO||____________________________x_o_x_o_____x___________________|3.14%|36.16%
1.6800|~75O||____________________________x_o___o_____x_o_________________|3.99%|34.95%
1.6650|~9OO||____________________________x_____o_____x_o_+_______________|4.85%|33.75%
1.6500|~1O5O|____________________________x_____o_x___x_o___+_____________|5.71%|32.54%
1.6350|~12OO|____________________x_______x_____o_x_o_x_o_____+___________|6.57%|31.34%
1.6200|~135O|____________x___x___x_o_x___x_____o_x_o_x_o_x_____+_________|7.42%|30.13%
1.6050|~15OO|____________x_o_x_o_x_o_x_o_x_____o_x_o_x_o_x_o_x___+_______|8.28%|28.93%
1.5900|~165O|____________x_o_x_o_x_o_x_o_x_____o___o_x_o_x_o_x_o_x_+_____|9.14%|27.72%
1.5750|~18OO|____________x_o_x_o_x_o_x_o_x_______+_o___o_x_o_x_o_x_o_+___|9.99%|26.52%
1.5600|~195O|x___________x_o_x_o_x_o_x_o_______+_______o_x_o_x_o_x_o___+_|10.85%|25.31%
1.5450|~21OO|x_o_________x_o_x_o_x_o_x_______+_________o___o_x_o_x_o_____|11.71%|24.11%
1.5300|~225O|x_o_________x_o___o_x_o_x_____+_______________o___o___o_____|12.57%|22.9%
1.5150|~24OO|x_o_____x___x_____o_x_o_x___+_________________________o_____|13.42%|21.7%
1.5000|~255O|x_o_x___x_o_x_____o_x_o_x_+___________________________o_____|14.28%|20.49%
1.4850|~27OO|x_o_x_o_x_o_x_____o___o_+_____________________________o_____|15.14%|19.29%
1.4700|~285O|x_o_x_o_x_o_x_________+_______________________________o_____|16%|18.08%
1.4550|~3OOO|x_o_x_o_x_o_________+_________________________________o_____|16.85%|16.88%
1.4400|~315O|x_o_x_o_x_________+___________________________________o_____|17.71%|15.67%
1.4250|~33OO|x_o_x_o_________+_____________________________________o_____|18.57%|14.47%
1.4100|~345O|x_o_x_________+_______________________________________o_____|19.42%|13.26%
1.3950|~36OO|x_o_x_______+_________________________________________o_____|20.28%|12.06%
1.3800|~375O|__o_x_____+___________________________________________o_____|21.14%|10.85%
1.3650|~39OO|__o_x___+_____________________________________________o_____|22%|9.65%
1.3500|~4O5O|__o_x_+_______________________________________________o_____|22.85%|8.44%
1.3350|~42OO|__o_+_________________________________________________o_x___|23.71%|7.24%
1.3200|~435O|__+___________________________________________________o_x_o_|24.57%|6.03%
1.3050|~45OO|______________________________________________________o_x_o_|25.42%|4.83%
1.2900|~465O|______________________________________________________o_x_o_|26.28%|3.62%
1.2750|~48OO|______________________________________________________o_+_o_|27.14%|2.42%
1.2600|~495O|______________________________________________________+___o_|28%|1.21%
1.2450|~51OO|__________________________________________________________o_|28.85%|0.01%
1.2300|~525O|__________________________________________________________+_|29.71%|-1.2%
Column|||||||1_1_1_5_6_4_1_6_6_9_1_1_9_4_1_4_4_1_4_5_8_1_5_6_5_5_4_2_4_6_|
Count||||||||2_5_1_______1_______O_O_____2_____O_______O___________1_____|
http://iticsoftware.com/postimages/201005/BJF-Trading-Group-EurCad0611.PNG
http://iticsoftware.com/postimages/201005/BJF-Trading-Group-EurCad0611.xls
Posted by: MDunleavy Jun 13, 2010, 07:43 PM
First.
Trade Idea: EUR/USD - Buy Limit at 1.2100; Target: 1.2250; Stop: 1.2025.
Then.
Trade Idea: EUR/USD - Sell Limit at 1.2250; Target: 1.1650 ; Stop: 1.2325.
The EUR/USD finally broke below the triangle, but did so after two false breakouts. The pair
has moved higher after putting in lows below 1.1900. The week was closed out with the EUR/USD
at 1.2110. The resistance comes in at 1.2150-1.2200. This is the former support level which
created the triangle (see chart at bottom). If that resistance band hold, expect continued
selling pressure. Support comes in at 1.2050, 1.1950 and 1.1875. Penetration of the recent
low at 1.1875 has a target of 1.1650.
"P&F EURUSD10080 Box Size 250X3 or(6.18%) HI/LO
Data 1.6038 - 0.8225 ~ 152 Month ~ 4627 Day
Database 662 records 1.21112 (Last Close)
1997-10-05 00~00
2010-06-06 00~00 (GMT+01:00) Paris
http://docs.google.com/View?id=dcftkq53_160f5rf86gg#EURUSD10080 MDunleavy chart"
1.6000|~25O||______________________x_+_________________|0.24%|94.53%
1.5750|~5OO||______________________x_o_+_______________|1.8%|91.49%
1.5500|~75O||______________________x_o___+_____________|3.35%|88.45%
1.5250|~1OOO|______________________x_o_____+_______+___|4.91%|85.41%
1.5000|~125O|______________________x_o_______+_____x_+_|6.47%|82.37%
1.4750|~15OO|______________________x_o_x_______+___x_o_|8.03%|79.33%
1.4500|~175O|______________________x_o_x_o_____x_+_x_o_|9.59%|76.29%
1.4250|~2OOO|______________________x_o_x_o_____x_o_x_o_|11.15%|73.25%
1.4000|~225O|______________________x_o___o_____x_o_x_o_|12.71%|70.21%
1.3750|~25OO|______________________x_____o_____x_o_x_o_|14.27%|67.17%
1.3500|~275O|__________________x___x_____o_____x_o_x_o_|15.82%|64.13%
1.3250|~3OOO|__________________x_o_x_____o_x___x_o_x_o_|17.38%|61.09%
1.3000|~325O|__________________x_o_x_____o_x_o_x_o_x_o_|18.94%|58.05%
1.2750|~35OO|______________x___x_o_x_____o_x_o_x_o_x_o_|20.5%|55.02%
1.2500|~375O|______________x_o_x_o_x_____o___o___o___o_|22.06%|51.98%
1.2250|~4OOO|__x___________x_o_x_o_x_______________+_o_|23.62%|48.94%
1.2000|~425O|__x_o_________x_o___o_x_____________+___o_|25.18%|45.9%
1.1750|~45OO|==x=o=====x===x=====o=============+=====+=|26.74%|42.86%
1.1500|~475O|__x_o_____x_o_x_________________+_________|28.3%|39.82%
1.1250|~5OOO|o_x_o_____x_o_x_______________+___________|29.85%|36.78%
1.1000|~525O|o_x_o_____x_o_______________+_____________|31.41%|33.74%
1.0750|~55OO|o___o_____x_______________+_______________|32.97%|30.7%
1.0500|~575O|____o_____x_____________+_________________|34.53%|27.66%
1.0250|~6OOO|____o_____x___________+___________________|36.09%|24.62%
1.0000|~625O|____o_____x_________+_____________________|37.65%|21.58%
0.9750|~65OO|____o_____x_______+_______________________|39.21%|18.54%
0.9500|~675O|____o_x___x_____+_________________________|40.77%|15.5%
0.9250|~7OOO|____o_x_o_x___+___________________________|42.32%|12.46%
0.9000|~725O|____o_x_o_x_+_____________________________|43.88%|9.42%
0.8750|~75OO|____o_x_o_x_______________________________|45.44%|6.38%
0.8500|~775O|____o_x_o_________________________________|47%|3.34%
0.8250|~8OOO|____o_+___________________________________|48.56%|0.3%
0.8000|~825O|____+_____________________________________|50.12%|-2.74%
Column|||||||3_6_1_5_4_1_3_7_3_6_7_1_8_3_9_3_3_8_8_1_1_|
Count||||||||____6_____3___________7_______________O_2_|
http://iticsoftware.com/postimages/201005/BJF-Trading-Group-EurUsd0613.PNG
http://iticsoftware.com/postimages/201005/BJF-Trading-Group-EurUsd0613.xls
Posted by: MDunleavy Jun 15, 2010, 11:38 AM
Trade Idea: EUR/JPY - Buy Stop at 111.60; Target: 115.20 ; Stop: 110.40.
As the single currency has rallied last Friday on risk appetite after Friday’s release of stronger-than-expected U.S. data, adding credence to our view that wave 5 has ended at 108.06 earlier and consolidation with upside bias remains for retracement of recent decline to 113.40/50 and later towards 114.16, which is likely to hold on first testing.
"P&F EURJPY10080 Box Size30X4 or(8.66%) HI/LO
Data 188.22 - 88.87 ~ 241 Month ~ 7343 Day
Database 1050 records 112.468 (Last Close)
1990-05-06 00~00
2010-06-13 00~00 (GMT+01:00) Paris
http://docs.google.com/View?id=dcftkq53_160f5rf86gg#EURJPY10080 MDunleavy chart"
http://iticsoftware.com/postimages/201005/BJF-Trading-Group-EurJpy0615.PNG http://iticsoftware.com/postimages/201005/BJF-TG0615.gif
http://iticsoftware.com/postimages/201005/BJF-Trading-Group-EurJpy0615.xls
Posted by: MDunleavy Jun 19, 2010, 08:35 PM
Intraday bias in GBP/USD is turned neutral as it retreats sharply from intraday high of 1.4885. Note that
recovery from 1.4230 is expected to be limited by 100% projection of 1.4230 to 1.4769 from 1.4346 at
1.4885. Break of 1.4644 minor support will suggest that such recovery is completed and flip intraday bias
back to the downside. Further break of 1.4346 will confirm this case and target a retest of 1.4230 low
next. However, decisive break of 1.4885 will target 1.5053 resistance next.
"P&F GBPUSD10080 Box Size 450X3 or(7.71%) HI/LO
Data 2.454 - 1.0463 ~ 389 Month ~ 11851 Day
Database 1694 records 1.48097 (Last Close)
1978-01-01 00~00
2010-06-13 00~00 (GMT+01:00) Paris
https://docs.google.com/View?id=dcftkq53_160f5rf86gg#GBPUSD10080 MDunleavy chart"
http://iticsoftware.com/postimages/201005/BJF-Trading-Group-GbpUsd0619.PNG
http://iticsoftware.com/postimages/201005/BJF-Trading-Group-GbpUsd0619.xls
Posted by: MDunleavy Jun 22, 2010, 07:24 PM
How you can see, the AUD/CHF has been moving along two horizontal levels around 0.9855 and 0.9575. After touching the resistance level at June 14th, the pair pulled down and reached the support line around 0.9575. While the RSI indicator has reached the level at 30, we might expect a pull-back towards the resistance level around 0.9855.
"P&F AUDCHF10080 Box Size 1750X5 or(9.13%) HI/LO
Data 1.2232 - 0.6929 ~ 236 Month ~ 7182 Day
Database 1027 records 0.97252 (Last Close)
1990-10-21 00~00
2010-06-20 00~00 (GMT+01:00) Paris
https://docs.google.com/View?id=dcftkq53_160f5rf86gg#AUDCHF10080 MDunleavy chart"
http://iticsoftware.com/postimages/201005/BJF-Trading-Group-AudChf0621.PNG
http://iticsoftware.com/postimages/201005/BJF-Trading-Group-AudChf0621.xls
Posted by: MDunleavy Jun 26, 2010, 02:59 PM
This pair fell to new lows this week. Prices eventually found temporary support from the trend-line for the rally up from the November ’09 lows and the lower channel line of the 4th of June descent. There are some bullish signs including momentum diverging bullishly and the Elliot wave count is showing a possible start of a small 4th wave although more upside is required to confirm. If this is the case the market may rise slowly over the next week to 90.50, which is also the lower border of the Ichimoku cloud.
A break lower, however, could lead to 87.00, the point and figure target down and also the old support lows from the ‘08/’09 bottom. They may also pause on the way down at a support at 88.17.
"P&F USDJPY10080 Box Size60X3 or(10.05%) HI/LO
Data 278.31 - 79.75 ~ 389 Month ~ 11858 Day
Database 1695 records 89.223 (Last Close)
1978-01-01 00~00
2010-06-20 00~00 (GMT+01:00) Paris
http://docs.google.com/View?id=dcftkq53_160f5rf86gg#USDJPY10080 MDunleavy chart"
282.00|~6OO||____________+___________________________|-1.33%|253.61%
276.00|~12OO|____________x_+_________________________|0.83%|246.08%
270.00|~18OO|____________x_o_+_______________________|2.99%|238.56%
264.00|~24OO|____________x_o___+_____________________|5.14%|231.03%
258.00|~3OOO|____x_______x_o_____x___________________|7.3%|223.51%
252.00|~36OO|____x_o_____x_o_____x_o_________________|9.45%|215.99%
246.00|~42OO|____x_o_x___x_o_x___x_o_+_______________|11.61%|208.46%
240.00|~48OO|____x_o_x_o_x_o_x_o_x_o___+_____________|13.77%|200.94%
234.00|~54OO|__o_x_o_x_o_x_o_x_o_x_o_____+___________|15.92%|193.42%
228.00|~6OOO|__o_x_o_x_o_x_o___o_+_o_______+_________|18.08%|185.89%
222.00|~66OO|__o_x_o_x_o_x_____+___o_________+_______|20.23%|178.37%
216.00|~72OO|__o_x_o_x_o_____+_____o___________+_____|22.39%|170.85%
210.00|~78OO|__o_x_o_x_____+_______o_____________+___|24.54%|163.32%
204.00|~84OO|__o_x_o_____+_________o_______________+_|26.7%|155.8%
198.00|~9OOO|__o_x_____+___________o_________________|28.86%|148.28%
192.00|~96OO|__o_x___+_____________o_________________|31.01%|140.75%
186.0|~1O2OO|__o_x_+_______________o_________________|33.17%|133.23%
180.0|~1O8OO|__o_+_________________o_________________|35.32%|125.71%
174.0|~114OO|__+___________________o_________________|37.48%|118.18%
168.0|~12OOO|______________________o_________________|39.64%|110.66%
162.0|~126OO|______________________o_________________|41.79%|103.13%
156.0|~132OO|______________________o_x_______________|43.95%|95.61%
150.0|~138OO|______________________o_x_o_____________|46.1%|88.09%
144.0|~144OO|______________________o_x_o_x___________|48.26%|80.56%
138.0|~15OOO|______________________o_x_o_x_o_________|50.42%|73.04%
132.0|~156OO|______________________o_x_o_x_o_x_______|52.57%|65.52%
126.0|~162OO|______________________o___o_x_o_x_o_____|54.73%|57.99%
120.0|~168OO|__________________________o_x_o_x_o_x___|56.88%|50.47%
114.0|~174OO|__________________________o_x_o_x_o_x_o_|59.04%|42.95%
108.0|~18OOO|__________________________o_x_o_x_o_x_o_|61.19%|35.42%
102.0|~186OO|__________________________o_x_o___o___o_|63.35%|27.9%
96.00|~192OO|__________________________o_x___+_____o_|65.51%|20.38%
90.00|~198OO|__________________________o_x_+_______o_|67.66%|12.85%
84.00|~2O4OO|__________________________o_+_________+_|69.82%|5.33%
78.00|~21OOO|__________________________+_____________|71.97%|-2.19%
Column|||||||O_1_1_9_7_5_1_8_3_3_5_2_5_1_1_7_5_5_3_5_|
Count||||||||__O_3_______O_________2___2_O___________|
http://iticsoftware.com/postimages/201005/BJF-Trading-Group-UsdJpy0626.PNG
http://iticsoftware.com/postimages/201005/BJF-Trading-Group-UsdJpy0626.xls
Posted by: Action Forex Jun 28, 2010, 05:26 PM
recovery from 1.4230 is expected to be limited by 100% projection of 1.4230 to 1.4769 from 1.4346 at
1.4885. Break of 1.4644 minor support will suggest that such recovery is completed and flip intraday bias
back to the downside. Further break of 1.4346 will confirm this case and target a retest of 1.4230 low
next. However, decisive break of 1.4885 will target 1.5053 resistance next.
"P&F GBPUSD10080 Box Size 450X3 or(7.71%) HI/LO
Data 2.454 - 1.0463 ~ 389 Month ~ 11851 Day
Database 1694 records 1.48097 (Last Close)
1978-01-01 00~00
2010-06-13 00~00 (GMT+01:00) Paris
https://docs.google.com/View?id=dcftkq53_160f5rf86gg#GBPUSD10080 MDunleavy chart"
http://iticsoftware.com/postimages/201005/BJF-Trading-Group-GbpUsd0619.PNG
http://iticsoftware.com/postimages/201005/BJF-Trading-Group-GbpUsd0619.xls
Why did you copy from us? http://www.actionforex.com/action-insight/gbpusd-outlook/gbp%10usd-mid-day-outlook-20100618115928/
Posted by: MDunleavy Jul 4, 2010, 03:12 PM
AUD/USD Weekly Outlook
AUD/USD dropped sharply to as low as 0.8315 last week. The break of 0.8549 support suggests that corrective rise from 0.8066 is finished with three waves up to 0.8858, just ahead of 61.8% retracement of 0.9380 to 0.8066 at 0.8878. While some recovery might be seen initially this week, we'd expect upside to be limited well below 0.8858 resistance and bring fall resumption. Below 0.8315 will target a test on 0.8066 support next.
The text is written by ActionForex.
"P&F AUDUSD10080 Box Size 20X3 or(8.21%) HI/LO
Data 0.9849 - 0.4773 ~ 252 Month ~ 7686 Day
Database 1099 records 0.84138 (Last Close)
1989-06-11 00~00
2010-06-27 00~00 (GMT+01:00) Paris
http://docs.google.com/View?id=dcftkq53_160f5rf86gg#AUDUSD10080 MDunleavy chart"
0.9800|~2OO||______________________________x_+_______________________|0.5%|105.32%
0.9600|~4OO||______________________________x_o_+___________+_________|2.53%|101.13%
0.9400|~6OO||______________________________x_o___+_________x_+_______|4.56%|96.94%
0.9200|~8OO||__________________________x___x_o_____+_______x_o_x_____|6.59%|92.75%
0.9000|~1OOO|__________________________x_o_x_o_______+_____x_o_x_o___|8.62%|88.56%
0.8800|~12OO|______________________x___x_o_x_o_________+___x_o_x_o_x_|10.65%|84.37%
0.8600|~14OO|__+___________________x_o_x_o___o___________+_x_o___o_x_|12.68%|80.18%
0.8400|~16OO|__x_+_________________x_o_x_____o_____________x_____o_x_|14.71%|75.99%
0.8200|~18OO|__x_o_x_______________x_o_x_____o_____________x_____o___|16.74%|71.8%
0.8000|~2OOO|__x_o_x_o_____x_______x_o_x_____o_____________x_________|18.77%|67.61%
0.7800|~22OO|__x_o_x_o_+___x_o_x___x_o_______o_____________x_________|20.8%|63.42%
0.7600|~24OO|o_x_o_x_o___+_x_o_x_o_x_________o_____________x_________|22.83%|59.23%
0.7400|~26OO|o___o_x_o_____x_o_x_o_x_________o_____________x_______+_|24.87%|55.04%
0.7200|~28OO|____o_x_o_____x_o_x_o___________o_x_______x___x_____+___|26.9%|50.85%
0.7000|~3OOO|____o_x_o_____x_o_x_____________o_x_o_x___x_o_x___+_____|28.93%|46.66%
0.6800|~32OO|____o_x_o_____x_o_______________o_x_o_x_o_x_o_x_+_______|30.96%|42.47%
0.6600|~34OO|____o___o_x___x_________________o_x_o_x_o_x_o_x_________|32.99%|38.28%
0.6400|~36OO|________o_x_o_x_______________+_o___o_x_o_x_o___________|35.02%|34.09%
0.6200|~38OO|________o_x_o_x_____________+_______o___o_+_____________|37.05%|29.9%
0.6000|~4OOO|________o_x_o_x___________+_____________+_______________|39.08%|25.71%
0.5800|~42OO|________o_x_o_x_________+_______________________________|41.11%|21.52%
0.5600|~44OO|________o___o_x_______+_________________________________|43.14%|17.33%
0.5400|~46OO|____________o_x_____+___________________________________|45.17%|13.14%
0.5200|~48OO|____________o_x___+_____________________________________|47.2%|8.95%
0.5000|~5OOO|____________o_x_+_______________________________________|49.23%|4.76%
0.4800|~52OO|____________o_+_________________________________________|51.26%|0.57%
0.4600|~54OO|____________+___________________________________________|53.29%|-3.62%
Column|||||||2_5_9_8_1_5_9_1_6_5_3_8_5_7_3_6_1_4_5_4_4_5_4_1_4_3_5_3_|
Count||||||||________3_____6_________________7_____________5_________|
http://iticsoftware.com/postimages/201005/BJF-Trading-Group-AudUsd0703.PNG
http://iticsoftware.com/postimages/201005/BJF-Trading-Group-AudUsd0703.xls
Posted by: MDunleavy Jul 10, 2010, 02:18 PM
The New Zealand Dollar pared the decline from June following a shift in market sentiment, and the high-yielding currency may continue to trend higher over the following week as investors raise their appetite for risk.
"P&F NZDUSD10080 Box Size 150X3 or(7.43%) HI/LO
Data 0.8214 - 0.39 ~ 246 Month ~ 7483 Day
Database 1070 records 0.71037 (Last Close)
1990-01-07 00~00
2010-07-04 00~00 (GMT+01:00) Paris
http://docs.google.com/View?id=dcftkq53_160f5rf86gg#NZDUSD10080 MDunleavy chart"
http://iticsoftware.com/postimages/201005/BJF-Trading-Group-NzdUsd0710.PNG
http://iticsoftware.com/postimages/201005/BJF-Trading-Group-NzdUsd0710.xls
Posted by: MDunleavy Jul 18, 2010, 10:02 AM
The EUR penetrated resistance at 1.2500 and the descending trend line. It is too early to call this a reversal, but the primary down trend is weakening. Expect retracement to test the new support level at 1.2500. Failure of the rising trend line would warn of a primary down swing with a target of parity - confirmed if support at 1.1900 is broken. Respect of support would suggest a reversal, but confirmation would only come from a higher trough followed by a new high.
"P&F EURUSD240 Box Size 10X3 or(2.22%) HI/LO
Data 1.5144 - 1.1876 ~ 8 Month ~ 247.17 Day
Database 1050 records 1.29296 (Last Close)
2009-11-11 16~00
2010-07-16 20~00 (GMT+01:00) Paris
http://docs.google.com/View?id=dcftkq53_160f5rf86gg#EURUSD240 MDunleavy chart"
1.5100|~1OO||____x_+___________________|0.29%|27.15%
1.5000|~2OO||x_o_x_o_+_________________|0.95%|26.31%
1.4900|~3OO||x_o_x_o___+_______________|1.61%|25.46%
1.4800|~4OO||______o_____+_____________|2.27%|24.62%
1.4700|~5OO||______o_______+___________|2.93%|23.78%
1.4600|~6OO||______o_________+_________|3.59%|22.94%
1.4500|~7OO||______o___________+_______|4.25%|22.09%
1.4400|~8OO||______o_____________+_____|4.91%|21.25%
1.4300|~9OO||______o_______________+___|5.57%|20.41%
1.4200|~1OOO|______o_________________+_|6.23%|19.57%
1.4100|~11OO|______o___________________|6.89%|18.73%
1.4000|~12OO|______o___________________|7.55%|17.88%
1.3900|~13OO|______o___________________|8.21%|17.04%
1.3800|~14OO|______o_x_________________|8.87%|16.2%
1.3700|~15OO|______o_x_o_______________|9.54%|15.36%
1.3600|~16OO|______o_x_o_x_____________|10.2%|14.52%
1.3500|~17OO|______o___o_x_o___________|10.86%|13.67%
1.3400|~18OO|__________o_x_o___________|11.52%|12.83%
1.3300|~19OO|__________o___o___________|12.18%|11.99%
1.3200|~2OOO|______________o___________|12.84%|11.15%
1.3100|~21OO|______________o___________|13.5%|10.31%
1.3000|~22OO|______________o_x_______x_|14.16%|9.46%
1.2900|~23OO|______________o_x_o_____x_|14.82%|8.62%
1.2800|~24OO|______________o_x_o_____x_|15.48%|7.78%
1.2700|~25OO|______________o_x_o_____x_|16.14%|6.94%
1.2600|~26OO|______________o___o_x___x_|16.8%|6.1%
1.2500|~27OO|__________________o_x_o_x_|17.46%|5.25%
1.2400|~28OO|__________________o_x_o_x_|18.12%|4.41%
1.2300|~29OO|__________________o_x_o_x_|18.78%|3.57%
1.2200|~3OOO|__________________o___o_x_|19.44%|2.73%
1.2100|~31OO|______________________o_x_|20.1%|1.89%
1.2000|~32OO|______________________o_x_|20.76%|1.04%
1.1900|~33OO|______________________o_+_|21.42%|0.2%
1.1800|~34OO|______________________+___|22.08%|-0.64%
Column|||||||2_2_3_1_3_5_3_1_4_8_4_7_1_|
Count||||||||______6_______O_________1_|
http://iticsoftware.com/postimages/201005/BJF-Trading-Group-EurUsd0717.PNG
http://iticsoftware.com/postimages/201005/BJF-Trading-Group-EurUsd0717.xls
Posted by: MDunleavy Jul 21, 2010, 07:49 AM
The USDCHF attempted to push lower yesterday, bottomed at 1.0452 but closed higher at 1.0524. On h1 chart below we can see price is moving inside a new minor bullish channel indicating upside correction phase but the major bearish scenario remains intact as long as price move inside the major bearish channel. Immediate resistance at 1.0630. Consistent move above that area and violation to the major bearish channel could be a serious threat to the bearish scenario testing 1.0750. On the downside we need a break below 1.0399 to continue the bearish scenario testing 1.0220.The text is written by ActionForex.But I think that will break down.
"P&F USDCHF1 Box Size 3X3 or(0.09%) CLOSE
Data 1.0542 - 1.0454 ~ 0 Month ~ 0.73 Day
Database 1050 records 1.05332 (Last Close)
2010-07-20 14~07
2010-07-21 07~39 (GMT+01:00) Paris
http://docs.google.com/View?id=dcftkq53_160f5rf86gg#USDCHF1 MDunleavy chart"
http://iticsoftware.com/postimages/201005/BJF-Trading-Group-UsdChf-Large.PNG
http://iticsoftware.com/postimages/201005/BJF-Trading-Group-UsdChf.xls
Posted by: MDunleavy Jul 24, 2010, 02:40 PM
This week, US data and the European bank stress test results stole most of the headlines. Canada has quietly seen their currency strengthen towards the lower part of its' recent range. Tuesday saw an increase of 25 basis points on their overnight rate. Canadian Retail Sales and Consumer Price Index printed below expectations, but the currency benefited from the stabilization of commodities. While the outlook for future rate hikes is dismal, the Canadian economy is significantly in a better position than the US.Written by FX Solutions.USDCAD strength can continue towards 1.02.
"P&F USDCAD30 Box Size 40X3 or(1.15%) HI/LO
Data 1.0744 - 1.0138 ~ 2 Month ~ 58.98 Day
Database 2048 records 1.03572 (Last Close)
2010-05-25 23~00
2010-07-23 22~30 (GMT+01:00) Paris
http://docs.google.com/View?id=dcftkq53_160f5rf86gg#USDCAD30 MDunleavy chart"
1.0760|~4O|||+_______________________________|-0.15%|6.14%
1.0720|~8O|||x_o_____________________________|0.22%|5.74%
1.0680|~12O||x_o_+_______________+___________|0.6%|5.35%
1.0640|~16O||__o___+_____x_______x_+_________|0.97%|4.95%
1.0600|~2OO||__o_____+___x_o_____x_o_+_______|1.34%|4.56%
1.0560|~24O||__o_x___x_+_x_o_____x_o_x_+_____|1.71%|4.16%
1.0520|~28O||__o_x_o_x_o_x_o_____x_o_x_o_+___|2.08%|3.77%
1.0480|~32O||__o_x_o_x_o_x_o_____x_o_x_o_x_+_|2.46%|3.37%
1.0440|~36O||__o___o___o_x_o_x___x_o_x_o_x_o_|2.83%|2.98%
1.0400|~4OO||__________o_x_o_x_o_x_o_x_o_x_o_|3.2%|2.58%
1.0360|~44O||__________o___o_x_o_x_o_x_o___o_|3.57%|2.19%
1.0320|~48O||______________o_x_o___o_x_____V_|3.95%|1.8%
1.0280|~52O||______________o_x_____o_______V_|4.32%|1.4%
1.0240|~56O||______________o_x___+_________V_4.69%|1.01%
1.0200|~6OO||______________o_x_+___________V_5.06%|0.61%
1.0160|~64O||______________o_+_____________V_5.44%|0.22%
1.0120|~68O||______________+_________________|5.81%|-0.18%
Column|~72O||2_8_3_3_3_5_7_1_7_3_8_9_7_5_3_3_|
Count||~76O||______________2_________________|
http://iticsoftware.com/postimages/201005/BJF-Trading-Group-UsdCad0722Lage.PNG
http://iticsoftware.com/postimages/201005/BJF-Trading-Group-UsdCad0722.xls
Posted by: MDunleavy Jul 28, 2010, 04:00 PM
Gold' fall from 1266.5 resumes by taking out 1175.1 and reaches as slow as 1156.9 so far. Short term outlook will now remain bearish as long as 1203.9 resistance holds and we'd expect deeper decline to 1124.3 support next.
"P&F GOLD30 Box Size $6X3 or(1.49%) HI/LO
Data 1265.02 - 1157.88 ~ 2 Month ~ 62.92 Day
Database 2056 records 1161.33 (Last Close)
2010-05-26 16~00
2010-07-28 14~00 (GMT+01:00) Paris
https://docs.google.com/View?id=dcftkq53_160f5rf86gg#GOLD30 MDunleavy chart"
1260.00|~6$||__________________x_+_____________|0.4%|8.82%
1254.00|~12$|__________x_o_x_o___o_+___________|0.87%|8.3%
1248.00|~18$|______x___x_o_x_____o___+_________|1.35%|7.78%
1242.00|~24$|______x_o_x_o_x_____o_____+_______|1.82%|7.27%
1236.00|~3O$|______x_o_x_o_x___+_o_______+_____|2.29%|6.75%
1230.00|~36$|______x_o_x_o___+___o_________+___|2.77%|6.23%
1224.00|~42$|__x___x_o_x___+_____o___________+_|3.24%|5.71%
1218.00|~48$|o_x_o_x_o___+_______o_____________|3.72%|5.19%
1212.00|~54$|o_x_o_x___+_________o_____x_______|4.19%|4.67%
1206.00|~6O$|o___o_x_+___________o_x___x_o_____|4.67%|4.16%
1200.00|~66$|____o_+_____________o_x_o_x_o_x___|5.14%|3.64%
1194.00|~72$|____+_______________o_x_o_x_o_x_o_|5.61%|3.12%
1188.00|~78$|____________________o___o___o_x_o_|6.09%|2.6%
1182.00|~84$|____________________________o_x_o_|6.56%|2.08%
1176.00|~9O$|____________________________o_+_o_|7.04%|1.56%
1170.00|~96$|____________________________+___o_|7.51%|1.05%
1164.0|~1O2$|________________________________oV|7.99%|0.53%
1158.0|~1O8$|________________________________oV|8.46%|0.01%
1152.0|~114$|________________________________+V|8.93%|-0.51%
Column|||||||3_3_4_8_5_6_5_4_1_1_1_3_3_4_6_4_7V|
Count||||||||____________________2____________V|

http://iticsoftware.com/postimages/201005/BJF-Trading-Group-GOLD0758.xls
Posted by: MDunleavy Aug 3, 2010, 07:27 PM
As expected, Cable moved up in the Asian and the European sessions today to touch a high of 1.5968. The pair honoured the Resistance at 1.5970 (61.8% retracement of the fall from 1.7042 (Aug-09) to 1.4227 (May-09)) and is currently trading lower. We may see the markets go down towards 1.5900-1.5700, before another rally beyond 1.60 figure in the coming days.
"P&F GBPUSD1 Box Size 5X3 or(0.09%) CLOSE
Data 1.5965 - 1.5862 ~ 0 Month ~ 0.53 Day
Database 768 records 1.59201 (Last Close)
2010-08-03 02~34
2010-08-03 15~24 (GMT+01:00) Paris
https://docs.google.com/Doc?id=dcftkq53_184hk3n2jg4#GBPUSD1 MDunleavy chart"
1.5965|~5||||______________________________|0%|0.65%
1.5960|~1O|||______________x___x_______+___|0.03%|0.62%
1.5955|~15|||__________x___x_o_x_o_____x_+_|0.06%|0.59%
1.5950|~2O|||__________x_o_x_o_x_o_____x_o_|0.09%|0.55%
1.5945|~25|||__________x_o_x_o_x_o_____x_o_|0.13%|0.52%
1.5940|~3O|||__________x_o_x_o_x_o_x___x_o_|0.16%|0.49%
1.5935|~35|||__________x_o___o_x_o_x_o_x_o_|0.19%|0.46%
1.5930|~4O|||__________x_____o_x_o_x_o_x_o_|0.22%|0.43%
1.5925|~45|||______x___x_____o_x_o___o___o_|0.25%|0.4%
1.5920|~5O|||______x_o_x_____o_x_______+_o_|0.28%|0.37%
1.5915|~55|||______x_o_x_____o_x_____+___o_|0.31%|0.33%
1.5910|~6O|||______x_o_x_____o_x___+_____+_|0.34%|0.3%
1.5905|~65|||______x_o_x_____o_x_+_________|0.38%|0.27%
1.5900|~7O|||______x_o_x_____o_+___________|0.41%|0.24%
1.5895|~75|||______x_o_______+_____________|0.44%|0.21%
1.5890|~8O|||______x_______+_______________|0.47%|0.18%
1.5885|~85|||o_____x_____+_________________|0.5%|0.15%
1.5880|~9O|||o_x___x___+___________________|0.53%|0.11%
1.5875|~95|||o_x_o_x_+_____________________|0.56%|0.08%
1.5870|~1OO||o_x_o_x_______________________|0.6%|0.05%
1.5865|~1O5||o_x_o_________________________|0.63%|0.02%
1.5860|~11O||o_+___________________________|0.66%|-0.01%
Column|~115||6_4_3_1_6_1_4_5_1_1_7_3_3_6_8_|
Count|~12O|||______2___2_____2_2___________|

http://iticsoftware.com/postimages/201005/BJF-Trading-Group-GBPUSD0803.xls
Posted by: MDunleavy Aug 8, 2010, 06:18 AM
Crude oil edged further higher to 82.97 last week but retreat sharply since then. A temporary top is at least formed and initial bias is neutral this week. We’d continue to seem more retreat below 82.97 first. Nevertheless, note that another rise remains in favor as long as 75.90 support holds. Above 82.97 will target 100% projection of 64.23 to 79.38 from 71.09 at 86.24 next. However, break of 75.9 will be the first signal that whole rebound from 64.23 is finished and will turn focus to 71.09 support for confirmation.The text is written by Oilngold.
"P&F O I L (brent) Box Size $1X3 or(3.71%) CLOSE
Data 91.94 - 69.75 ~ 4 Month ~ 114.67 Day
Database 2000 records 80.33 (Last Close)
2010-04-14 05~00
2010-08-06 21~00 (GMT+01:00) Paris
https://docs.google.com/Doc?id=dcftkq53_184hk3n2jg4#O_I_L_%28brent%29 MDunleavy chart"
92.00|~1OO||__+___________________________________________|-0.07%|31.9%
91.00|~2OO||__x_+_________________________________________|1.02%|30.47%
90.00|~3OO||__x_o_+_______________________________________|2.11%|29.03%
89.00|~4OO||__x_o___+_____________________________________|3.2%|27.6%
88.00|~5OO||o_x_o_____+___________________________________|4.29%|26.16%
87.00|~6OO||o_x_o_______+_________________________________|5.37%|24.73%
86.00|~7OO||o_x_o_________+_______________________________|6.46%|23.3%
85.00|~8OO||o___o___________+_____________________________|7.55%|21.86%
84.00|~9OO||____o_x___________+___________________________|8.64%|20.43%
83.00|~1OOO|____o_x_o___________+_____________________+___|9.72%|19%
82.00|~11OO|____o_x_o_____________+___________________x_+_|10.81%|17.56%
81.00|~12OO|____o_x_o_______________+_________________x_o_|11.9%|16.13%
80.00|~13OO|____o___o_________________x_______________x_o_|12.99%|14.7%
79.00|~14OO|________o_________________x_o_x___________x_o_|14.07%|13.26%
78.00|~15OO|________o_________________x_o_x_o_____x___x___|15.16%|11.83%
77.00|~16OO|________o_____________x___x_o_x_o_x___x_o_x___|16.25%|10.39%
76.00|~17OO|________o_____x___x___x_o_x_o___o_x_o_x_o_x_+_|17.34%|8.96%
75.00|~18OO|________o_____x_o_x_o_x_o_x_____o_x_o_x_o_+___|18.43%|7.53%
74.00|~19OO|________o_x___x_o_x_o_x_o_x_____o_x_o___+_____|19.51%|6.09%
73.00|~2OOO|________o_x_o_x_o___o_+_o_x_____o_x___+_______|20.6%|4.66%
72.00|~21OO|________o_x_o_x_____+___o_______o_x_+_________|21.69%|3.23%
71.00|~22OO|________o___o_x___+_____________o_+___________|22.78%|1.79%
70.00|~23OO|____________o_x_+_______________+_____________|23.86%|0.36%
69.00|~24OO|____________o_+_______________________________|24.95%|-1.08%
||||||~25OO|____________+_________________________________|100%|-100%
Column||||||4_6_1_4_1_3_5_7_3_3_3_4_5_8_4_3_8_6_3_4_3_7_3_|
Count|||||||____1___3_____________________________________|

http://iticsoftware.com/postimages/201005/BJF-Trading-Group-Oil0807.xls
Posted by: MDunleavy Aug 15, 2010, 10:28 AM
Dollar index has best week in nearly 2 years.
Aug 13 (Reuters) - The dollar on Friday marked its best week against a basket of major
currencies in nearly two years, as worries about the strength of the global economy fed short-
covering and safe-haven demand for the greenback.
The dollar index .DXY, which measures the greenback against six major currencies, rose 3.2
percent this week to 82.943. That was the biggest weekly gain since it rose nearly 5 percent in
the week ended Oct. 26, 2008.
Worries that a slower U.S. economy could cause headwinds for global growth led investors to
sell risky assets and buy dollars as a safe-haven play, traders said
The US Dollar Index rallied off support at 80. Penetration of the descending trendline
indicates that the down-trend is weakening.
"P&F _DXY10080 Box Size20X3 or(6.28%) HI/LO
Data 120.51 - 70.7 ~ 211 Month ~ 6405 Day
Database 916 records 82.92 (Last Close)
1993-01-24 00~00
2010-08-08 00~00 (GMT+01:00) Paris
https://docs.google.com/Doc?id=dcftkq53_184hk3n2jg4#_DXY10080 MDunleavy chart"
120.0|~2OO||__________________o_x_+_____________________|0.42%|69.73%
118.0|~4OO||____________x___x_o_x_o_+___________________|2.08%|66.9%
116.0|~6OO||____________x_o_x_o_x_o___+_________________|3.74%|64.07%
114.0|~8OO||____________x_o_x_o_x_o_____+_______________|5.4%|61.24%
112.0|~1OOO|____________x_o_x_o___o_______+_____________|7.06%|58.42%
110.0|~12OO|____________x_o_______o_________+___________|8.72%|55.59%
108.0|~14OO|____________x_________o___________+_________|10.38%|52.76%
106.0|~16OO|____________x_________o_____________+_______|12.04%|49.93%
104.0|~18OO|________x___x_________o_______________+_____|13.7%|47.1%
102.0|~2OOO|____x___x_o_x_________o_________________+___|15.36%|44.27%
100.0|~22OO|____x_o_x_o_x_________o___________________+_|17.02%|41.44%
98.00|~24OO|____x_o_x_o_________+_o_x___________________|18.68%|38.61%
96.00|~26OO|x___x_o_x_________+___o_x_o_________________|20.34%|35.79%
94.00|~28OO|x_o_x_o_x_______+_____o_x_o_________________|22%|32.96%
92.00|~3OOO|x_o_x_o_______+_______o___o_x_______________|23.66%|30.13%
90.00|~32OO|x_o_x_______+_____________o_x_o_____________|25.32%|27.3%
88.00|~34OO|__o_x_____+_______________o_x_o_x___x___x___|26.98%|24.47%
86.00|~36OO|__o_x___+_________________o_x_o_x_o_x_o_x_o_|28.64%|21.64%
84.00|~38OO|__o_x_+___________________o_x_o_x_o_x_o_x_o_|30.3%|18.81%
82.00|~4OOO|__o_+_____________________o___o_x_o_x_o_x_o_|31.96%|15.98%
80.00|~42OO|__+___________________________o_x_o_x_o_x___|33.62%|13.15%
78.00|~44OO|______________________________o_x_o___o_x_+_|35.28%|10.33%
76.00|~46OO|______________________________o_x___+_o_+___|36.93%|7.5%
74.00|~48OO|______________________________o_x_+___+_____|38.59%|4.67%
72.00|~5OOO|______________________________o_+___________|40.25%|1.84%
70.00|~52OO|______________________________+_____________|41.91%|-0.99%
Column||||||4_7_1_5_6_3_1_4_4_5_4_1_3_8_5_1_8_5_5_6_6_3_|
Count|||||||____O_______O_________4_______O_____________|

http://iticsoftware.com/postimages/201005/BJF-Trading-Group-DXY0814.xls
Posted by: MDunleavy Aug 18, 2010, 11:37 AM
Very risky trading idea : EUR/JPY - Buy at 109.20-80; Target: 114.00-60 ; Stop: 108.60.
===============================
EURJPY Outlook
The EURJPY slipped below 109.20 support area yesterday but whipsawed to the upside, topped at
110.42, closed at 110.17 and traded lower earlier today in Asian session around 109.90 at the
time I wrote this comment. Overall we are still in bearish outlook after violation to the
bullish channel but price still trapped in range area between 110.70 – 109.20. We need a
consistent move below 109.20 to continue the bearish pressure testing 108.07 – 107.30 area. On
the upside, break above 110.70 could be a serious threat to the bearish outlook.
(fxinstructor)
"P&F EURJPY30 Box Size 30X4 or(1.08%) HI/LO
Data 114.724 - 107.306 ~ 2 Month ~ 61.15 Day
Database 2054 records 109.712 (Last Close)
2010-06-18 04~00
2010-08-18 07~30 (GMT+01:00) Paris
https://docs.google.com/Doc?id=dcftkq53_184hk3n2jg4#EURJPY30 MDunleavy chart"
114.60|~3O|||________________________________________x_+_______________|0.11%|6.8%
114.30|~6O|||________________________________________x_o_+_____________|0.37%|6.52%
114.00|~9O|||________________________________________x_o_x_+___________|0.63%|6.24%
113.70|~12O||+_______________________________________x_o_x_o_+_________|0.89%|5.96%
113.40|~15O||x_+_____________________________________x_o_x_o___+_______|1.15%|5.68%
113.10|~18O||x_o_+_______________x___x___x___________x_o_x_o_____+_____|1.42%|5.4%
112.80|~21O||x_o___+_____________x_o_x_o_x_o_x___x___x_o_x_o_______+___|1.68%|5.12%
112.50|~24O||x_o_____+_______x___x_o_x_o_x_o_x_o_x_o_x_o_x_o_________+_|1.94%|4.84%
112.20|~27O||x_o_______+_____x_o_x_o_x_o_x_o_x_o_x_o_x_o___o___________|2.2%|4.56%
111.90|~3OO||__o_________+___x_o_x_o___o_x_o_x_o_x_o_x_____o___________|2.46%|4.28%
111.60|~33O||__o___________+_x_o_x_____o___o_+_o_x_o_______o___________|2.72%|4%
111.30|~36O||__o_____________x_o_x_________+___o_x_______+_o___________|2.98%|3.72%
111.00|~39O||__o_____________x_o_x_______+_____o_x_____+___o_____x_____|3.25%|3.44%
110.70|~42O||__o_____x___x___x_o_______+_______o_x___+_____o_x___x_o___|3.51%|3.16%
110.40|~45O||__o_____x_o_x_o_x_______+_________o_x_+_______o_x_o_x_o_x_|3.77%|2.88%
110.10|~48O||__o_____x_o_x_o_x_____+___________o_+_________o_x_o_x_o_x_|4.03%|2.6%
109.80|~51O||__o_____x_o_x_o_x___+_____________+___________o_x_o_x_o_x_|4.29%|2.32%
109.50|~54O||__o_____x_o_x_o___+___________________________o___o___o_x_|4.55%|2.04%
109.20|~57O||__o_____x_o_____+_____________________________________o_+_|4.82%|1.77%
108.90|~6OO||__o_x___x_____+_______________________________________+___|5.08%|1.49%
108.60|~63O||__o_x_o_x___+_____________________________________________|5.34%|1.21%
108.30|~66O||__o_x_o_x_+_______________________________________________|5.6%|0.93%
108.00|~69O||__o_x_o_x_________________________________________________|5.86%|0.65%
107.70|~72O||__o_x_o___________________________________________________|6.12%|0.37%
107.40|~75O||__o_+_____________________________________________________|6.38%|0.09%
107.10|~78O||__+_______________________________________________________|6.65%|-0.19%
Column|~81O||5_2_5_4_1_5_5_4_1_6_8_4_4_5_5_5_4_9_9_4_1_8_6_1_4_4_5_6_4_|
Count|~84O|||__O_____O_______O_______________________O_____5___________|

http://iticsoftware.com/postimages/201005/BJF-Trading-Group-EURJPY0818.xls
Posted by: MDunleavy Aug 23, 2010, 07:39 AM
The euro is testing the rising trendline; penetration would indicate that the recent rally has
weakened, and reversal below 1.2500 would indicate another test of primary support at 1.1900.
I remain bearish on EUR/USD.
"P&F EURUSD5 Box Size 25X3 or(0.58%) HI/LO
Data 1.3333 - 1.2663 ~ 1 Month ~ 23.49 Day
Database 5000 records 1.27105 (Last Close)
2010-07-28 11~15
2010-08-20 22~55 (GMT+01:00) Paris
https://docs.google.com/View?id=dcftkq53_184hk3n2jg4#EURUSD5 MDunleavy chart"
1.3325|~25|||______________+___________________________|0.06%|5.23%
1.3300|~5O|||______________x_o_________________________|0.25%|5.03%
1.3275|~75|||______________x_o_+_______________________|0.44%|4.83%
1.3250|~1OO||______x_______x_o___+_____________________|0.62%|4.64%
1.3225|~125||______x_o_x___x_o_x___+___________________|0.81%|4.44%
1.3200|~15O||______x_o_x_o_x_o_x_o___+_________________|1%|4.24%
1.3175|~175||______x_o_x_o_x_o_x_o_____+_______________|1.19%|4.04%
1.3150|~2OO||______x_o_x_o___o_x_o_______+_____________|1.37%|3.85%
1.3125|~225||______x_o_____+_o_x_o_________+___________|1.56%|3.65%
1.3100|~25O||__x___x_____+___o_x_o___________+_________|1.75%|3.45%
1.3075|~275||__x_o_x___+_____o___o_____________+_______|1.94%|3.25%
1.3050|~3OO||__x_o_x_+___________o_______________+_____|2.12%|3.06%
1.3025|~325||o_x_o_x_____________o_________________+___|2.31%|2.86%
1.3000|~35O||o_x_o_______________o___________________+_|2.5%|2.66%
1.2975|~375||o_+_________________o_____________________|2.69%|2.46%
1.2950|~4OO||+___________________o_____________________|2.87%|2.27%
1.2925|~425||____________________o_x___________________|3.06%|2.07%
1.2900|~45O||====================o=x=o=x===x===x===x===|3.25%|1.87%
1.2875|~475||____________________o_x_o_x_o_x_o_x_o_x_o_|3.44%|1.67%
1.2850|~5OO||____________________o___o_x_o_x_o_x_o_x_o_|3.62%|1.48%
1.2825|~525||________________________o_x_o_x_o___o_x_o_|3.81%|1.28%
1.2800|~55O||________________________o___o_x_____o_x_o_|4%|1.08%
1.2775|~575||============================o=x=====o=+=o=|4.19%|0.88%
1.2750|~6OO||____________________________o_______+___o_|4.37%|0.69%
1.2725|~625||________________________________________o_|4.56%|0.49%
1.2700|~65O||________________________________________o_|4.75%|0.29%
1.2675|~675||________________________________________o_|4.94%|0.09%
1.2650|||||||________________________________________+_|5.12%|-0.1%
Column|||||||3_5_4_1_5_4_3_6_1_6_1_3_5_4_6_6_3_3_5_5_9_|
Count||||||||______O_________O___5_____________________|

http://iticsoftware.com/postimages/201005/BJF-Trading-Group-EURUSD0821.xls
Posted by: MDunleavy Sep 4, 2010, 09:36 PM
The Yen opened the last week, on a weak note following an emergency meeting of the Bank of Japan, that announced more liquidity measures. Also the government said that it was planning more stimulus for the economy. A few hours after the Yen not only recovered lost ground but was testing 15-year lows.
Despite improvement in market sentiment and rising government bond yields as the week went by, the USD/JPY did not rise and moved in ranges below 84.60
On Friday, after the NFP report, the pair jumped to 85.20 but reversed sharply and pulled back to 84.20 to finish the week below 84.50.
The dollar broke through primary support at 85.00 and is headed for a test of support at the 1995 low of 80.00 The Bank of Japan threatens to intervene to prevent further appreciation, but there are doubts about the political will to do so. Recovery above 88.00 is unlikely at this stage, but would warn that the down-trend is weakening.
I believe that we can consider the possibility of opening long positions. Details on the chart.
"P&F USDJPY1 Box Size 10X3 or(0.35%) HI/LO
Data 85.894 - 83.666 ~ 0.31 Month ~ 9.02 Day
Database 12000 records 84.297 (Last Close)
2010-08-25 22~24
2010-09-03 22~59 (GMT+01:00) Paris
https://docs.google.com/View?id=dcftkq53_184hk3n2jg4#USDJPY1 chart"
85.90|~1O|||______+_______________________|-0.01%|2.67%
85.80|~2O|||______x_o_____________________|0.11%|2.55%
85.70|~3O|||______x_o_+___________________|0.23%|2.43%
85.60|~4O|||______x_o___+_________________|0.34%|2.31%
85.50|~5O|||______x_o_____+_______________|0.46%|2.19%
85.40|~6O|||______x_o_______+_____________|0.58%|2.07%
85.30|~7O|||______x_o_________+_______+___|0.69%|1.95%
85.20|~8O|||______x_o___________+_____x_+_|0.81%|1.83%
85.10|~9O|||______x_o_____________+___x_o_|0.92%|1.71%
85.00|~1OO||__x___x_o_______________+_x_o_|1.04%|1.59%
84.90|~11O||__x_o_x_o_________________x_o_|1.16%|1.47%
84.80|~12O||o_x_o_x_o_________________x_o_|1.27%|1.36%
84.70|~13O||o_x_o_x_o_________________x_o_|1.39%|1.24%
84.60|~14O||o_x_o_x_o_____________x___x_o_|1.51%|1.12%
84.50|~15O||o_x_o___o_x___x___x___x_o_x_o_|1.62%|1%
84.40|~16O||o_x_____o_x_o_x_o_x_o_x_o_x_o_|1.74%|0.88%
84.30|~17O||o_______o_x_o_x_o_x_o_x_o_x_o_|1.86%|0.76%
84.20|~18O||________o_x_o___o_x_o_x_o_x___|1.97%|0.64%
84.10|~19O||________o_______o_x_o_x_o_x___|2.09%|0.52%
84.00|~2OO||________________o_x_o_x_o___+_|2.21%|0.4%
83.90|~21O||________________o___o_x___+___|2.32%|0.28%
83.80|~22O||____________________o_x_+_____|2.44%|0.16%
83.70|~23O||____________________o_+_______|2.55%|0.04%
83.60|~24O||____________________+_________|2.67%|-0.08%
Column||||||6_7_5_1_1_4_3_3_6_6_8_9_6_1_9_|
Count|||||||______3_8_________________2___|

http://img714.imageshack.us/i/bjftradinggroupexcelcha.pdf/
BJF Trading Group. Excel Chart. Full size attached. 2010_Sep_04_160400.zip ( 53.54K )
: 7
2010_Sep_04_160400.zip ( 53.54K )
: 7
Posted by: MDunleavy Sep 11, 2010, 08:58 PM
The Aussie dollar is advancing to test resistance at 0.9350.
Reversal below 0.88 would signal another test of primary support at 0.81.
Break out above strong resistance at 0.9350 appears less likely, but would offer a target of parity if confirmed.
Technically, the AUD USD is in an uptrend after crossing the last swing top at 0.9221 on Thursday.
The pace of the current rally may begin to slow down as this market approaches a series of tops at 0.9323, 0.9337, 0.9364 and 0.9387.
The big number to overtake will be the November 2009 top at .9405.
Hence, even in case of another rise, I'd expect strong resistance near to 0.9404 to limit upside and bring another fall to continue the consolidation.
However, decisive break of 0.9404 will invalidate this view and target 0.9849 high.
"P&F AUDUSD1 Box Size 10X3 or(0.33%) CLOSE
Data 0.9275 - 0.9092 ~ 0.16 Month ~ 4.83 Day
Database 6862 records 0.92631 (Last Close)
2010-09-06 03~04
2010-09-10 22~59 (GMT+01:00) Paris
https://docs.google.com/View?id=dcftkq53_184hk3n2jg4#AUDUSD1 MDunleavy chart"
0.9280|~1O|||____________________________+_________|-0.05%|2.07%
0.9270|~2O|||____________________________x_+_____+_|0.05%|1.96%
0.9260|~3O|||____________________________x_o_x___x_|0.16%|1.85%
0.9250|~4O|||____________________________x_o_x_o_x_|0.27%|1.74%
0.9240|~5O|||____________________________x_o_x_o_x_|0.38%|1.63%
0.9230|~6O|||________________________x___x_o_x_o___|0.49%|1.52%
0.9220|~7O|||________________________x_o_x_o_x_____|0.59%|1.41%
0.9210|~8O|||________________________x_o_x_o_x_____|0.7%|1.3%
0.9200|~9O|||________________________x_o___o_______|0.81%|1.19%
0.9190|~1OO||+___________________x___x___________+_|0.92%|1.08%
0.9180|~11O||x_+_________________x_o_x_________+___|1.02%|0.97%
0.9170|~12O||x_o_+_______________x_o_x_______+_____|1.13%|0.86%
0.9160|~13O||x_o_x_+_________x___x_o_______+_______|1.24%|0.75%
0.9150|~14O||x_o_x_o_+_______x_o_x_______+_________|1.35%|0.64%
0.9140|~15O||__o_x_o_x_+_x___x_o_x_____+___________|1.46%|0.53%
0.9130|~16O||__o___o_x_o_x_o_x_o_____+_____________|1.56%|0.42%
0.9120|~17O||______o_x_o_x_o_x_____+_______________|1.67%|0.31%
0.9110|~18O||______o_x_o___o_x___+_________________|1.78%|0.2%
0.9100|~19O||______o_x_____o_x_+___________________|1.89%|0.09%
0.9090|~2OO||______o_______o_+_____________________|1.99%|-0.02%
Column|||||||4_5_3_7_5_3_3_5_7_3_6_3_7_3_7_7_6_3_3_|
Count||||||||______________________________________|

http://iticsoftware.com/postimages2/201009/BJF-Trading-Group-AudUsd0911.xls
Posted by: MDunleavy Sep 20, 2010, 03:23 PM
Trade Idea: AUD/JPY - Sell Stop at 80.00\80.50; Target: 77.00 ; Stop: 81.00\81.50.
=================
We compare the AUD / JPY in a minus? This week was a bit extreme if you ask me. The night after the mega peak (that all the planet participated in), he began a fairly strong recoil.
=================
"P&F AUDJPY5 Box Size 150X3 or(0.57%) CLOSE
Data 81.257 - 77.3 ~ 0.38 Month ~ 11.06 Day
Database 2010 records 80.883 (Last Close)
2010-09-09 13~50
2010-09-20 15~15 (GMT+01:00) Paris
https://docs.google.com/View?id=dcftkq53_184hk3n2jg4#AUDJPY5 MDunleavy chart"
81.30|~15|||______________________________________________+_____|-0.05%|5.17%
81.15|~3O|||______________________________________________x_+___|0.13%|4.98%
81.00|~45|||______________________________________________x_o_x_|0.32%|4.79%
80.85|~6O|||______________________________________________x_o_x_|0.5%|4.59%
80.70|~75|||______________________________________________x_o_x_|0.69%|4.4%
80.55|~9O|||______________________________________x_______x_o_x_|0.87%|4.2%
80.40|~1O5||______________________________________x_o_x___x_o_x_|1.05%|4.01%
80.25|~12O||______________________________________x_o_x_o_x_o___|1.24%|3.82%
80.10|~135||__________________________________x___x_o_x_o_x_____|1.42%|3.62%
79.95|~15O||__________________________________x_o_x_o_x_o_______|1.61%|3.43%
79.80|~165||__________________________________x_o_x_o_x_________|1.79%|3.23%
79.65|~18O||__________________________________x_o_x_o_x_________|1.98%|3.04%
79.50|~195||__________________________________x_o___o___________|2.16%|2.85%
79.35|~21O||__________________________________x_________________|2.35%|2.65%
79.20|~225||__________________________________x_______________+_|2.53%|2.46%
79.05|~24O||__________________________________x_____________+___|2.72%|2.26%
78.90|~255||__________________________________x___________+_____|2.9%|2.07%
78.75|~27O||__________________________________x_________+_______|3.09%|1.88%
78.60|~285||__________________________________x_______+_________|3.27%|1.68%
78.45|~3OO||__________x___x___________x_______x_____+___________|3.45%|1.49%
78.30|~315||__________x_o_x_o_x_______x_o_x___x___+_____________|3.64%|1.29%
78.15|~33O||__________x_o_x_o_x_o_____x_o_x_o_x_+_______________|3.82%|1.1%
78.00|~345||__________x_o___o_x_o_x___x_o_x_o_x_________________|4.01%|0.91%
77.85|~36O||__________x_____o_+_o_x_o_x_o___o___________________|4.19%|0.71%
77.70|~375||__x___x___x_____+___o_x_o_x___+_____________________|4.38%|0.52%
77.55|~39O||__x_o_x_o_x___+_____o___o_x_+_______________________|4.56%|0.32%
77.40|~4O5||o_x_o_x_o_x_+___________o_+_________________________|4.75%|0.13%
77.25|~42O||o___o___o_+_____________+___________________________|4.93%|-0.06%
Column||||||2_3_3_3_3_8_3_3_4_3_5_3_4_7_4_3_3_1_4_7_7_6_3_8_6_5_|
Count|||||||__________________________________5_________________|

http://iticsoftware.com/postimages2/201009/BJF-Trading-Group-AUDJPY0920.xls
Posted by: MDunleavy Sep 27, 2010, 10:04 AM
Trade Idea: Nad/Usd - Buy Limit at ~0.72.00; Target: ~0.76.00 ; Stop: ~0.7120.
=============
I am neutral on NZD/USD, but wait for upward movement.
The weak fundamentals of New Zealand are offset by the general greenback sell off. This trend is likely to continue in the upcoming week, with more range trading expected.
"P&F NZDUSD5 Box Size 10X3 or(0.41%) HI/LO
Data 0.7415 - 0.7214 ~ 0.38 Month ~ 11.06 Day
Database 2010 records 0.73369 (Last Close)
2010-09-16 06~15
2010-09-27 07~45 (GMT+01:00) Paris
https://docs.google.com/View?id=dcftkq53_184hk3n2jg4#NZDUSD5 MDunleavy chart"
0.7420|~1O|||________________________________+_____________|-0.07%|2.86%
0.7410|~2O|||________________________________x_+___________|0.07%|2.72%
0.7400|~3O|||____________________________x___x_o_+_________|0.2%|2.58%
0.7390|~4O|||____________________________x_o_x_o_x_+_______|0.34%|2.44%
0.7380|~5O|||________________________x___x_o_x_o_x_o_+_____|0.47%|2.3%
0.7370|~6O|||________________________x_o_x_o___o_x_o___+___|0.61%|2.16%
0.7360|~7O|||________________________x_o_x_____o_x_o_____x_|0.74%|2.02%
0.7350|~8O|||____________________x___x_o_______o___o_____x_|0.88%|1.89%
0.7340|~9O|||____________________x_o_x___________+_o_____x_|1.01%|1.75%
0.7330|~1OO||________x___________x_o_x_________+___o_x___x_|1.15%|1.61%
0.7320|~11O||________x_o_________x_o_________+_____o_x_o_x_|1.28%|1.47%
0.7310|~12O||________x_o_____x___x_________+_______o_x_o_x_|1.42%|1.33%
0.7300|~13O||________x_o_x___x_o_x_______+_________o_x_o_x_|1.55%|1.19%
0.7290|~14O||________x_o_x_o_x_o_x_____+___________o_x_o_x_|1.69%|1.05%
0.7280|~15O||________x_o_x_o_x_o_x___+_____________o_x_o___|1.82%|0.91%
0.7270|~16O||x_______x_o_x_o___o_x_+_______________o_+_____|1.96%|0.78%
0.7260|~17O||x_o_____x_o_x___+_o_+_________________+_______|2.09%|0.64%
0.7250|~18O||x_o_x___x_o___+___+___________________________|2.23%|0.5%
0.7240|~19O||x_o_x_o_x___+_________________________________|2.36%|0.36%
0.7230|~2OO||__o_x_o_x_+___________________________________|2.49%|0.22%
0.7220|~21O||__o___o_+_____________________________________|2.63%|0.08%
0.7210|~22O||______+_______________________________________|2.76%|-0.06%
Column|||||||4_5_3_3_1_8_5_3_4_5_9_3_6_3_5_3_4_6_4_1_6_5_8_|
Count||||||||________1_____________________________2_______|

http://iticsoftware.com/postimages2/201009/BJF-Trading-Group-NzdUsd0925.xls
Posted by: MDunleavy Oct 3, 2010, 10:04 PM
Trade Idea: Eur/Usd- Buy at 1.3750\1.3800; Target: 1.3900\1.3950 ; Stop: 1.3700.
=======================
The EURUSD continued its bullish momentum this week, topped at 1.3790 on Friday after made a clear, strong and convincing breakout above 1.3670 resistance area.
From this point, beside minor resistance around 1.3800, I see no significant resistance until 1.3950, which is the next technical bullish target.
Break above 1.3950 could trigger further bullish scenario.
"P&F EURUSD10080 Box Size 300X3 or(7.42%) HI/LO
Data 1.6038 - 0.8225; ~ 246.43 Month; ~ 7245 Day; ~ 20 Years
Database 1036 records; 1.379 (Last Close)
1990-11-25 00~00
2010-09-26 00~00 (GMT+01:00) Paris
https://docs.google.com/View?id=dcftkq53_184hk3n2jg4#EURUSD10080 MDunleavy chart"
1.62|________________________________________________+_____________|
1.59|________________________________________________x_+___________|
1.56|________________________________________________x_o_+_________|
1.53|________________________________________________x_o___+_______|
1.50|________________________________________________x_o_____x_____|
1.47|____________________+___________________________x_o_x___x_o___|
1.44|________+___________x_+_________________________x_o_x_o_x_o_+_|
1.41|________x_+_________x_o_x_______________________x_o_x_o_x_o___|
1.38|________x_o_x_______x_o_x_o_____________________x_o_x_o_x_o___|
1.35|x_______x_o_x_o_____x_o_x_o_+_______________x___x_o_x_o_x_o_x_|
1.32|x_o_____x_o_x_o_+___x_o___o___+_____________x_o_x_o_x_o_x_o_x_|
1.29|__o_x___x_o___o___+_x_____o_____+_______x___x_o_x_o_x_o_x_o_x_|
1.26|__o_x_o_x_____o_____x_____o_______+_____x_o_x_o_x_o___o___o_x_|
1.23|__o_x_o_x_____o_x___x_____o_x_______+___x_o_x_o_x_________o_x_|
1.20|__o_x_o_x___+_o_x_o_x_____o_x_o_______+_x_o___o_x_________o_+_|
1.17|__o_x_o___+___o_x_o_x_____o_x_o_____x___x_____o___________+___|
1.14|__o_x___+_____o___o_x_____o_x_o_____x_o_x_______________+_____|
1.11|__o_x_+___________o_______o_x_o_____x_o_x_____________+_______|
1.08|__o_+_____________________o_x_o_____x_o_____________+_________|
1.05|__+_______________________o___o_____x_____________+___________|
1.02|______________________________o_____x___________+_____________|
0.99|______________________________o_____x_________+_______________|
0.96|______________________________o_____x_______+_________________|
0.93|______________________________o_x___x_____+___________________|
0.90|______________________________o_x_o_x___+_____________________|
0.87|______________________________o_x_o_x_+_______________________|
0.84|______________________________o___o_+_________________________|
0.81|__________________________________+___________________________|
|||||2_9_7_4_8_4_3_8_3_4_1_4_3_1_6_1_3_3_1_3_7_3_5_6_1_1_7_7_8_1_5_|
|||||Column Count________1_____2___3_____1___________4_1_______O___|


http://iticsoftware.com/postimages2/201009/BJF-Trading-Group-EurUsd1002.xls
Posted by: Lombard Oct 6, 2010, 06:21 AM
hello guys..
thanks for sharing information..
Posted by: MDunleavy Oct 10, 2010, 08:03 PM
Trade Idea: Usd/Chf - Sell Limit,Stop at 0.9640; Target: 0.9520 ; Stop: 0.9701.
========================
USDCHF continues its bearish movement from 1.1730 and the fall extended to as low as 0.9555 level.
Further decline is still possible next week and next target would be at 0.9400 area and even 0.9200 area.
Resistance is at 0.9840\80, as long as this level holds, downtrend will continue.
========================
Dollar Index and the Swiss franc is well correlated with each other.
------------------------
And guess from, since September 28, the USDX has already fallen from 79.60 to 77.20.
The 77.00 support, however, had kept the index from falling.
Given this and its oversold condition, the index may range for awhile or even rally before continuing its descent.
A break of the 77.00 level would push the index down to around 74.00.
========================
"P&F _DXY1 Box Size 10X3 or(0.38%) CLOSE
Data 79.8 - 76.92 ~ 0.36 Month ~ 10.67 Day
Database 12000 records 77.2 (Last Close)
2010-09-28 07~01
2010-10-08 22~59 (GMT+01:00) Paris
https://docs.google.com/Doc?id=dcftkq53_184hk3n2jg4#DXY1 MDunleavy chart"
79.8|~1O|||x_+_____________________________________________|0.00%|
79.7|~2O|||x_o_+___________________________________________|0.13%|
79.6|~3O|||x_o___+_________________________________________|0.25%|
79.5|~4O|||x_o_x___+_______________________________________|0.38%|
79.4|~5O|||__o_x_o___+_____________________________________|0.5%|3
79.3|~6O|||__o_x_o_____+___________________________________|0.63%|
79.2|~7O|||__o___o_______+_________________________________|0.75%|
79.1|~8O|||______o_________+_______________________________|0.88%|
79.0|~9O|||______o_________x_+_____________________________|1.00%|
78.9|~1OO||______o_x___x___x_o_+___________________________|1.13%|
78.8|~11O||______o_x_o_x_o_x_o___+_________________________|1.25%|
78.7|~12O||______o_x_o_x_o_x_o_____+_______________________|1.38%|
78.6|~13O||______o___o___o_x_o_____x_+_____________________|1.50%|
78.5|~14O||______________o_x_o_x___x_o_+___________________|1.63%|
78.4|~15O||______________o___o_x_o_x_o___+_________________|1.75%|
78.3|~16O||__________________o_x_o_x_o_____+_______________|1.88%|
78.2|~17O||__________________o_x_o___o_______+_____________|2.01%|
78.1|~18O||__________________o_x_____o_________+___________|2.13%|
78.0|~19O||__________________o_______o___________+_________|2.26%|
77.9|~2OO||__________________________o_x___________+_______|2.38%|
77.8|~21O||__________________________o_x_o_x_________+_____|2.51%|
77.7|~22O||__________________________o_x_o_x_o_____x___+___|2.63%|
77.6|~23O||__________________________o_x_o_x_o_x___x_o_x_+_|2.76%|
77.5|~24O||__________________________o___o___o_x_o_x_o_x_o_|2.88%|
77.4|~25O||__________________________________o_x_o_x_o_x_o_|3.01%|
77.3|~26O||__________________________________o_x_o_x_o_x_o_|3.13%|
77.2|~27O||__________________________________o_x_o___o_x_o_|3.26%|
77.1|~28O||__________________________________o_x_____o_+_o_|3.38%|
77.0|~29O||__________________________________o_x_____+___+_|3.51%|
76.9|~3OO||__________________________________o_____________|3.63%|
Column~31O|4_6_3_9_3_3_3_5_6_1_5_3_4_1_4_4_3_9_7_4_5_6_5_5_|
Count~32O||__________________O_______1_____________________|

http://iticsoftware.com/postimages2/201009/2010Oct10_093154UsdChf.xls
Posted by: MDunleavy Oct 18, 2010, 01:48 PM
Trade Idea:EUR/USD - Buy (Stop,Limit) at 1.3900; Target: 1.4350 ; Stop: 1.3800.
"P&F EURUSD1 Box Size 12X3 or(0.26%) HI/LO
Data 1.4151 - 1.383 ~ 0.12 Month ~ 3.44 Day
Database 2010 records 1.38938 (Last Close)
2010-10-15 02~47
2010-10-18 13~20 (GMT+01:00) Paris
BJF Trading Group https://docs.google.com/View?id=dcftkq53_184hk3n2jg4#EURUSD1 chart"
1.4148|~12|||______x_+_______________|0.02%|2.3%
1.4136|~24|||______x_o_+_____________|0.11%|2.21%
1.4124|~36|||______x_o___+___________|0.19%|2.13%
1.4112|~48|||__x___x_o_____+_________|0.28%|2.04%
1.4100|~6O|||__x_o_x_o_______+_______|0.36%|1.95%
1.4088|~72|||__x_o_x_o_x_______+_____|0.45%|1.87%
1.4076|~84|||__x_o___o_x_o_______+___|0.53%|1.78%
1.4064|~96|||__x_____o_x_o_________+_|0.61%|1.69%
1.4052|~1O8||__x_____o___o___________|0.7%|1.61%
1.4040|~12O||o_x_________o_x_________|0.78%|1.52%
1.4028|~132||o_x_________o_x_o_______|0.87%|1.43%
1.4016|~144||____________o_x_o_x_____|0.95%|1.34%
1.4004|~156||____________o_x_o_x_o___|1.04%|1.26%
1.3992|~168||____________o___o_x_o___|1.12%|1.17%
1.3980|~18O||________________o___o___|1.21%|1.08%
1.3968|~192||____________________o___|1.29%|1%
1.3956|~2O4||____________________o___|1.38%|0.91%
1.3944|~216||____________________o___|1.46%|0.82%
1.3932|~228||____________________o___|1.55%|0.74%
1.3920|~24O||____________________o___|1.63%|0.65%
1.3908|~252||____________________o_x_|1.72%|0.56%
1.3896|~264||____________________o_x_o1.8%|0.48%
1.3884|~276||====================o=x=o1.89%|0.39%
1.3872|~288||____________________o_x_|1.97%|0.3%
1.3860|~3OO||____________________o_x_|2.06%|0.22%
1.3848|~312||____________________o_x_|2.14%|0.13%
1.3836|~324||____________________o_+_|2.23%|0.04%
1.3824|~336||____________________+___|
Column|||||||2_8_3_6_8_3_8_4_5_3_1_6_|
Count||||||||____________________5___|

https://docs.google.com/leaf?id=0BxxKzvQ2GlM8MjQ0ZGZhMDUtYWM0ZS00ZjU2LTg5OTctNjE5ZWU2ZWIzNzk3&hl=en
Posted by: MDunleavy Oct 24, 2010, 10:41 PM
I remain bullish on USD/CAD.
Trade Idea: USD/Cad - Buy (Stop;Limit) at 1.0280; Target: 1.0480 ; Stop: 1.0200.
See the details on the charts.
"P&F USDCAD10080 Box Size 250X3 or(5.94%) HI/LO
Data 1.6196 - 0.9056 ~ 246.9 Month ~ 7259 Day
Database 1038 records 1.02573 (Last Close)
1990-12-02 00~00
2010-10-17 00~00 (GMT+01:00) Paris
BJF Trading Group http://docs.google.com/View?id=dcftkq53_184hk3n2jg4 chart"
1.6250|~25O||____________+_______________________________|-0.33%|79.44%
1.6000|~5OO||________x___x_+_____________________________|1.21%|76.68%
1.5750|~75O||____x___x_o_x_o_+___________________________|2.75%|73.92%
1.5500|~1OOO|____x_o_x_o_x_o___+_________________________|4.3%|71.16%
1.5250|~125O|____x_o_x_o___o_____+_______________________|5.84%|68.4%
1.5000|~15OO|____x_o_x_____o_______+_____________________|7.38%|65.64%
1.4750|~175O|____x_o_x_____o_________+___________________|8.93%|62.88%
1.4500|~2OOO|____x_o_____+_o___________+_________________|10.47%|60.11%
1.4250|~225O|x___x_____+___o_____________+_______________|12.02%|57.35%
1.4000|~25OO|x_o_x___+_____o_x_____________+_____________|13.56%|54.59%
1.3750|~275O|x_o_x_+_______o_x_o_____________+___________|15.1%|51.83%
1.3500|~3OOO|x_o_+_________o_x_o_______________+_________|16.65%|49.07%
1.3250|~325O|x_+___________o_x_o_________________+_______|18.19%|46.31%
1.3000|~35OO|x_____________o_x_o_________x___x___x_+_____|19.73%|43.55%
1.2750|~375O|x_____________o___o_________x_o_x_o_x_o_+___|21.28%|40.79%
1.2500|~4OOO|x_________________o_x_______x_o_x_o_x_o___+_|22.82%|38.03%
1.2250|~425O|x_________________o_x_o_____x_o_x_o_x_o_____|24.36%|35.27%
1.2000|~45OO|x_________________o_x_o_____x_o_x_o___o_____|25.91%|32.51%
1.1750|~475O|x_________________o___o_x___x_o_x_____o_____|27.45%|29.75%
1.1500|~5OOO|x_____________________o_x_o_x_o_______o_____|28.99%|26.99%
1.1250|~525O|______________________o_x_o_x_________o_____|30.54%|24.23%
1.1000|~55OO|______________________o___o_x_________o_____|32.08%|21.47%
1.0750|~575O|__________________________o_x_________o_x___|33.63%|18.71%
1.0500|~6OOO|__________________________o_x_________o_x_o_|35.17%|15.95%
1.0250|~625O|==========================o=x=======+=o=x=o=x36.71%|13.18%
1.0000|~65OO|__________________________o_x_____+___o_+_o_|38.26%|10.42%
0.9750|~675O|__________________________o_x___+_____+___+_|39.8%|7.66%
0.9500|~7OOO|__________________________o_x_+_____________|41.34%|4.9%
0.9250|~725O|__________________________o_+_______________|42.89%|2.14%
0.9000|~75OO|__________________________+_________________|44.43%|-0.62%
Column|||||||1_3_9_5_6_3_3_1_5_9_3_6_3_1_1_6_6_4_4_1_3_3_|
Count||||||||2_____________3___________O_5_________2_____|

https://docs.google.com/leaf?id=0BxxKzvQ2GlM8OTkzNTg0NmQtY2VlNy00NzE2LWE0ZjgtNmI2ZTJiODAxYzA4&hl=ru
Posted by: MDunleavy Nov 1, 2010, 08:07 AM
I predict bearish trend...
Trade Idea: GOLD - Sell (Stop Limit) at 1356; Target: 1296 ; Stop: 1368.
See the details on the charts.
"P&F GOLD10080 Box Size40X2 or(9.76%) HI/LO
Data 1387.03 - 251.7 ~ 233.81 Month ~ 6874 Day
Database 989 records 1358.95 (Last Close)
1991-12-29 00~00
2010-10-24 00~00 (GMT+01:00) Paris
BJF Trading Group http://docs.google.com/View?id=dcftkq53_184hk3n2jg4 chart"
1400.00|~4O|__________________________________________+_|456.22%
1360.00|~8O|__________________________________________x_|440.33%
1320.0|~120|__________________________________________x_|424.43%
1280.0|~160|______________________________________+___x_|408.54%
1240.0|~2O0|______________________________________x_+_x_|392.65%
1200.0|~240|______________________________x_______x_o_x_|376.76%
1160.0|~280|______________________________x_o_x___x_o___|360.87%
1120.0|~320|______________________________x_o_x_o_x_____|344.97%
1080.0|~360|______________________________x_o___o_______|329.08%
1040.0|~4O0|______________________________x_____________|313.19%
1000.0|~440|______________x___________x___x___________+_|297.30%
960.00|~480|______________x_o_x_______x_o_x_________+___|281.41%
920.00|~520|______________x_o_x_o_x___x_o_x_______+_____|265.51%
880.00|~560|______________x_o___o_x_o_x_o_______+_______|249.62%
840.00|~6O0|______________x_____o_x_o_x_______+_________|233.73%
800.00|~640|______________x_____o_x_o_x_____+___________|217.84%
760.00|~680|______________x_____o___o_x___+_____________|201.95%
720.00|~720|______x_______x_________o___+_______________|186.05%
680.00|~760|______x_o_____x___________+_________________|170.16%
640.00|~8O0|______x_o_x___x_________+___________________|154.27%
600.00|~840|______x_o_x_o_x_______+_____________________|138.38%
560.00|~880|______x_o___o_______+_______________________|122.49%
520.00|~920|______x___________+_________________________|106.60%
480.00|~960|______x_________+___________________________||90.70%
440.0|~1O00|______x_______+_____________________________||74.81%
400.0|~1O40|__x___x_____+_______________________________||58.92%
360.0|~1O80|__x_o_x___+_________________________________||43.03%
320.0|~1120|____o_x_+___________________________________||27.14%
280.0|~1160|____o_+_____________________________________||11.24%
240.0|~1200|____+_______________________________________||-4.65%
Column|~||||O_2_3_1_4_2_2_1_3_2_5_4_5_7_3_8_3_2_2_4_2_5_|
Count|~|||||______1_______1_____________________________|

BJF Trading Group. http://img255.imageshack.us/img255/2721/10oct312305.pdf Full size attached.
Posted by: MDunleavy Nov 4, 2010, 08:47 AM
Oli Light
I predict a bullish development of the price movement.
BJF Trading Group. Excel Chart. Full size attached. 10Nov040714.pdf ( 53.37K )
: 0
10Nov040714.pdf ( 53.37K )
: 0
Posted by: MDunleavy Nov 8, 2010, 06:18 AM
GBP/USD
It is more likely to go down to around 1.6150 or 1.6100, and after that, it might have potentially to go up to around 1.6200 - 1.6400
Trade Idea: GBP/USD- Buy (Stop or Limit) at 1.6020; Target: 1.6440 ; Stop: 1.5900.
"P&F GBPUSD10080 Box Size 250X5 or(7.21%) HI/LO
Data 2.1161 - 1.3503 ~ 246.67 Month ~ 7252 Day
Database 1037 records 1.61809 (Last Close)
1990-12-23 00~00
2010-10-31 00~00 (GMT+01:00) Paris
BJF Trading Group https://docs.google.com/View?id=dcftkq53_184hk3n2jg4#GBPUSD10080 chart"
2.1250|~25O||______________________________+_________|-0.42%|57.37%
2.1000|~5OO||______________________________x_+_______|0.76%|55.52%
2.0750|~75O||______________________________x_o_+_____|1.94%|53.67%
2.0500|~1OOO|______________________________x_o___+___|3.12%|51.82%
2.0250|~125O|______+_______________________x_o_____+_|4.31%|49.97%
2.0000|~15OO|______x_+_____________________x_o_______|5.49%|48.12%
1.9750|~175O|______x_o_+___________________x_o_______|6.67%|46.26%
1.9500|~2OOO|o_____x_o___+_____________x___x_o_______|7.85%|44.41%
1.9250|~225O|o_____x_o_____+___________x_o_x_o_______|9.03%|42.56%
1.9000|~25OO|o_____x_o_______+_____x___x_o_x_o_______|10.21%|40.71%
1.8750|~275O|o_x___x_o_________+___x_o_x_o_x_o_______|11.39%|38.86%
1.8500|~3OOO|o_x_o_x_o___________+_x_o_x_o_x_o_______|12.58%|37.01%
1.8250|~325O|o_x_o_x_o_____________x_o_x_o_x_o_______|13.76%|35.16%
1.8000|~35OO|o_x_o_x_o_____________x_o_x_o_x_o_______|14.94%|33.3%
1.7750|~375O|o_x_o_x_o_____________x_o_x_o_x_o_______|16.12%|31.45%
1.7500|~4OOO|o_x_o_x_o_____________x_o___o_x_o_______|17.3%|29.6%
1.7250|~425O|o_x_o_x_o_____x_______x_____o___o_______|18.48%|27.75%
1.7000|~45OO|o_x_o___o_____x_o_____x_________o_x_____|19.66%|25.9%
1.6750|~475O|o_x_____o_____x_o_x___x_________o_x_o___|20.84%|24.05%
1.6500|~5OOO|o_x_____o_x___x_o_x_o_x_________o_x_o___|22.03%|22.2%
1.6250|~525O|o_x_____o_x_o_x_o_x_o_x_________o_x_o_x_|23.21%|20.34%
1.6000|~55OO|o_______o_x_o_x_o_x_o_x_________o_x_o_x_|24.39%|18.49%
1.5750|~575O|________o_x_o_x_o_x_o_x_________o_x_o_x_|25.57%|16.64%
1.5500|~6OOO|________o_x_o_x_o___o_x_________o_x_o_x_|26.75%|14.79%
1.5250|~625O|________o_x_o_x___+_o_x_________o_x_o_x_|27.93%|12.94%
1.5000|~65OO|________o_x_o___+___o_x_________o_x_o_x_|29.11%|11.09%
1.4750|~675O|________o_x___+_____o_x_______+_o_x_o_x_|30.3%|9.23%
1.4500|~7OOO|________o_x_+_______o_x_____+___o_x_o_x_|31.48%|7.38%
1.4250|~725O|________o_+_________o_x___+_____o_x_o_+_|32.66%|5.53%
1.4000|~75OO|________+___________o_x_+_______o_x_+___|33.84%|3.68%
1.3750|~775O|____________________o_+_________o_+_____|35.02%|1.83%
1.3500|~8OOO|____________________+___________+_______|36.2%|-0.02%
Column|||||||1_1_7_1_2_9_6_9_7_5_1_2_6_8_9_1_2_1_1_8_|
Count||||||||5_1___2_3___________2_1_______5_9_3_1___|

http://iticsoftware.com/postimages2//201009/BJF-Trading-Group-GbpUsd_20101107.xls
Posted by: MDunleavy Nov 15, 2010, 11:22 AM
_____I remain bullish on USD/JPY.
_____Dollar/Yen bottomed out and is now recovering, even without an intervention by the Bank of Japan.
_____The weakness of the Japanese economy is likely to be confirmed now, pushing the pair higher.
_____Trade Idea: Usd/Jpy - Buy (Stop Limit) at 82.40; Target: 84.00 ; Stop: 81.60.
"P&F USDJPY10080 Box Size 270X4 or(9.5%) HI/LO
Data 147.71 - 79.75 ~ 247.38 Month ~ 7273 Day
Database 1040 records 82.518 (Last Close)
1990-12-09 00~00
2010-11-07 00~00 (GMT+01:00) Paris
BJF Trading Group https://docs.google.com/Doc?docid=0ARXFe9FXJohUZGNmdGtxNTNfMjM3Y3ZzaHN3dms&hl=ru&authkey=CNH7-6gP#USDJPY10080 chart"
148.5|~27O||________________+_______________________|-0.53%|86.21%
145.8|~54O||________________x_+_____________________|1.29%|82.82%
143.1|~81O||+_______________x_o_+___________________|3.12%|79.44%
140.4|~1O8O|x_+_____________x_o___+_________________|4.95%|76.05%
137.7|~135O|x_o_+___________x_o_____+_______________|6.78%|72.66%
135.0|~162O|x_o_x_+_________x_o_____x_+_____________|8.6%|69.28%
132.3|~189O|x_o_x_o_+_______x_o_____x_o_+___________|10.43%|65.89%
129.6|~216O|__o_x_o___+_____x_o_____x_o___+_________|12.26%|62.51%
126.9|~243O|__o_x_o_____x___x_o_____x_o_____+_______|14.09%|59.12%
124.2|~27OO|__o_+_o_____x_o_x_o_x___x_o_______+_____|15.92%|55.74%
121.5|~297O|__+___o_____x_o_x_o_x_o_x_o_x_______+___|17.74%|52.35%
118.8|~324O|______o_____x_o_x_o_x_o_x_o_x_o_______+_|19.57%|48.97%
116.1|~351O|______o_____x_o_x_o_x_o_x_o_x_o_________|21.4%|45.58%
113.4|~378O|______o_x___x_o_x_o_x_o_x_o_x_o_________|23.23%|42.19%
110.7|~4O5O|______o_x_o_x_o___o___o_x_o_x_o_________|25.06%|38.81%
108.0|~432O|______o_x_o_x_________o_x_o_x_o_x_______|26.88%|35.42%
105.3|~459O|______o_x_o_x_________o_x_o_x_o_x_o_____|28.71%|32.04%
102.6|~486O|______o_+_o_x_________o___o_+_o_x_o_____|30.54%|28.65%
99.90|~513O|______+___o_x_____________+___o_x_o_x___|32.37%|25.27%
97.20|~54OO|__________o_x___________+_____o_+_o_x_o_|34.2%|21.88%
94.50|~567O|__________o_x_________+_______+___o_x_o_|36.02%|18.5%
91.80|~594O|__________o_x_______+_____________o_x_o_|37.85%|15.11%
89.10|~621O|__________o_x_____+_______________o_+_o_|39.68%|11.72%
86.40|~648O|__________o_x___+_________________+___o_|41.51%|8.34%
83.70|~675O|==========o=x=+=======================o=X3.33%|4.95%
81.00|~7O2O|__________o_+_________________________o_|45.16%|1.57%
78.30|~729O|__________+___________________________+_|46.99%|-1.82%
Column||||||4_6_4_1_4_1_1_6_1_1_5_8_1_1_7_9_4_7_4_7_|
Count|||||||______2___2_7___3_3_____2_2_____________|

http://iticsoftware.com/postimages2//201009/BJF-Trading-Group-UsdJpy_10_nov_14.xls
Posted by: optimus Nov 16, 2010, 06:53 AM
good sharing you all thanks for the information keep posting it
Posted by: MDunleavy Nov 21, 2010, 09:11 PM

"P&F _DXY10080 Box Size 170X3 or(5.33%) HI/LO
Data 120.51 - 70.7 ~ 221.19 Month ~ 6503 Day
Database 930 records 78.48 (Last Close)
1993-01-24 00~00
2010-11-14 00~00 (GMT+01:00) Paris
BJF Trading Group https://docs.google.com/Doc?docid=0ARXFe9FXJohUZGNmdGtxNTNfMjM3Y3ZzaHN3dms&hl=ru&authkey=CNH7-6gP#_DXY10080 chart"
120.7|~17O||________________________+___+___________________________|-0.16%|70.72%
119.0|~34O||____________________+___x_o_x_+_________________________|1.25%|68.32%
117.3|~51O||____________________x_+_x_o_x_o_+_______________________|2.66%|65.91%
115.6|~68O||____________________x_o_x_o_x_o___+_____________________|4.07%|63.51%
113.9|~85O||____________________x_o_x_o_x_o_____+___________________|5.49%|61.1%
112.2|~1O2O|____________________x_o_x_o___o_______+_________________|6.9%|58.7%
110.5|~119O|____________________x_o_x_____o_________+_______________|8.31%|56.29%
108.8|~136O|____________________x_o_______o___________+_____________|9.72%|53.89%
107.1|~153O|____________________x_________o_____________+___________|11.13%|51.49%
105.4|~17OO|________________+___x_________o_______________+_________|12.54%|49.08%
103.7|~187O|____________+___x_+_x_________o_________________+_______|13.95%|46.68%
102.0|~2O4O|________+___x_+_x_o_x_________o___________________+_____|15.36%|44.27%
100.3|~221O|________x_+_x_o_x_o_x_________o_____________________+___|16.77%|41.87%
98.60|~238O|____+___x_o_x_o_x_o_________+_o_x_____________________+_|18.18%|39.46%
96.90|~255O|____x_+_x_o_x_o_x_________+___o_x_o_____________________|19.59%|37.06%
95.20|~272O|+___x_o_x_o___o_x_______+_____o_x_o_____________________|21%|34.65%
93.50|~289O|x_+_x_o_x_____o_______+_______o_+_o_____________________|22.41%|32.25%
91.80|~3O6O|__o_x_o_x___________+_________+___o_x___x_______________|23.82%|29.84%
90.10|~323O|__o_x_o_x_________+_______________o_x_o_x_o_____________|25.23%|27.44%
88.40|~34OO|__o_+_o_x_______+_________________o_x_o_x_o_x___x___x___|26.65%|25.04%
86.70|~357O|__+___o_x_____+___________________o_x_o_x_o_x_o_x_o_x_o_|28.06%|22.63%
85.00|~374O|______o_x___+_____________________o_+_o_x_o_x_o_x_o_x_o_|29.47%|20.23%
83.30|~391O|______o_x_+_______________________+___o_x_o_x_o_x_o_x_o_|30.88%|17.82%
81.60|~4O8O|______o_+_____________________________o_+_o_x_o_x_o_x_o_|32.29%|15.42%
79.90|~425O|______+_______________________________+___o_x_o_x_o_x_o_|33.7%|13.01%
78.20|~442O|==========================================o=x=o===o=x=o=X35.11%|10.61%
76.50|~459O|__________________________________________o_x_____o_x_o_|36.52%|8.2%
74.80|~476O|__________________________________________o_x___+_o_+___|37.93%|5.8%
73.10|~493O|__________________________________________o_x_+___+_____|39.34%|3.39%
71.40|~51OO|__________________________________________o_+___________|40.75%|0.99%
69.70|~527O|__________________________________________+_____________|42.16%|-1.41%
Column||||||1_3_5_9_1_3_4_5_6_3_1_5_6_5_4_1_3_8_4_6_6_1_1_6_6_8_8_7_|
Count|||||||________1___________1_________5___________2_O___________|

http://iticsoftware.com/postimages2//201009/BJF-Trading-Group-DXY_2010-Nov-20.xls
Posted by: MDunleavy Nov 28, 2010, 10:32 PM

"P&F EURUSD1440 Box Size 250X3 or(6.18%) HI/LO
Data 1.6038 - 0.8225 ~ 155.85 Month ~ 4582 Day
Database 3277 records 1.32402 (Last Close)
1998-05-11 00~00
2010-11-26 00~00 (GMT+01:00) Paris
BJF Trading Group https://docs.google.com/Doc?docid=0ARXFe9FXJohUZGNmdGtxNTNfMjM3Y3ZzaHN3dms&authkey=CNH7-6gP&hl=ru#EURUSD1440 chart"
1.6000|~25O||______________________+___x_+_____________________|0.24%|94.53%
1.5750|~5OO||______________________x_o_x_o_+___________________|1.8%|91.49%
1.5500|~75O||______________________x___x_o___+_________________|3.35%|88.45%
1.5250|~1OOO|______________________x_____o_____+_______+_______|4.91%|85.41%
1.5000|~125O|______________________x_____o_______+_____x_+_____|6.47%|82.37%
1.4750|~15OO|______________________x_____o_x_______+___x_o_+___|8.03%|79.33%
1.4500|~175O|______________________x_____o_x_o_____x_+_x_o___+_|9.59%|76.29%
1.4250|~2OOO|______________________x_____o_x_o_____x_o_x_o_x___|11.15%|73.25%
1.4000|~225O|______________________x_____o___o_____x_o_x_o_x_o_|12.71%|70.21%
1.3750|~25OO|__________________+___x_________o_____x_o_x_o_x_o_|14.27%|67.17%
1.3500|~275O|__________________x_+_x_________o_____x_o_x_o_x_o_|15.82%|64.13%
1.3250|~3OOO|__________________x_o_x_________o_x___x_o_x_o_x_o_|17.38%|61.09%
1.3000|~325O|______________+___x_o_x_________o_x_o_x_o_x_o_x___|18.94%|58.05%
1.2750|~35OO|______________x_+_x_o_x_________o_x_o_x_o_x_o_x___|20.5%|55.02%
1.2500|~375O|__+___________x_o_x_o_x_________o___o___o___o_x___|22.06%|51.98%
1.2250|~4OOO|__x_+_________x_o_x_o_x_______________+_____o_x_+_|23.62%|48.94%
1.2000|~425O|__x_o_+___+___x_o___o_x_____________+_______o_+___|25.18%|45.9%
1.1750|~45OO|__x_o___+_x_+_x_____o_____________+_________+_____|26.74%|42.86%
1.1500|~475O|o_x_o_____x_o_x_________________+_________________|28.3%|39.82%
1.1250|~5OOO|o_x_o_____x_o_x_______________+___________________|29.85%|36.78%
1.1000|~525O|o_+_o_____x_o_______________+_____________________|31.41%|33.74%
1.0750|~55OO|+___o_____x_______________+_______________________|32.97%|30.7%
1.0500|~575O|____o_____x_____________+_________________________|34.53%|27.66%
1.0250|~6OOO|____o_____x___________+___________________________|36.09%|24.62%
1.0000|~625O|____o_____x_________+_____________________________|37.65%|21.58%
0.9750|~65OO|____o_____x_______+_______________________________|39.21%|18.54%
0.9500|~675O|____o_x___x_____+_________________________________|40.77%|15.5%
0.9250|~7OOO|____o_x_o_x___+___________________________________|42.32%|12.46%
0.9000|~725O|____o_x_o_x_+_____________________________________|43.88%|9.42%
0.8750|~75OO|____o_x_o_x_______________________________________|45.44%|6.38%
0.8500|~775O|____o_x_o_________________________________________|47%|3.34%
0.8250|~8OOO|____o_+___________________________________________|48.56%|0.3%
0.8000|~825O|____+_____________________________________________|50.12%|-2.74%
Column|||||||2_5_1_5_4_1_3_7_3_6_7_1_1_3_8_3_9_3_3_8_8_1_1_9_4_|
Count||||||||____6_____3___________6___________________O_2_____|

http://iticsoftware.com/postimages2//201009/BJF-Trading-Group-EurUsd10Nov28.xls
Posted by: MDunleavy Dec 5, 2010, 10:16 PM

"P&F NZDUSD10080 Box Size 150X3 or(7.43%) HI/LO
Data 0.8214 - 0.39 ~ 248.57 Month ~ 7308 Day
Database 1045 records 0.76571 (Last Close)
1990-11-25 00~00
2010-11-28 00~00 (GMT+01:00) Paris
BJF Trading Group https://docs.google.com/Doc?docid=0ARXFe9FXJohUZGNmdGtxNTNfMjM3Y3ZzaHN3dms&authkey=CNH7-6gP&hl=ru#NZDUSD10080 chart"
0.8250|~15O||__________________________+___+___________________________|-0.44%|111.54%
0.8100|~3OO||__________________________x_+_x_+_____________________+___|1.39%|107.69%
0.7950|~45O||__________________________x_o_x_o_+___________________x_+_|3.21%|103.85%
0.7800|~6OO||__________________________x_o_x_o___+_________________x_o_|5.04%|100%
0.7650|~75O||__________________________x_o_x_o_____+___________+___x_o_x6.87%|96.15%
0.7500|~9OO||______________________+___x_o_x_o_______+_________x_+_x_o_|8.69%|92.31%
0.7350|~1O5O|______________________x_+_x_o_x_o_________+_______x_o_x___|10.52%|88.46%
0.7200|~12OO|__+_______________+___x_o_x_o_x_o___________+_____x_o_x___|12.34%|84.62%
0.7050|~135O|__x_+_____________x_+_x_o_x_o_x_o_____________+___x_o_x___|14.17%|80.77%
0.6900|~15OO|__x_o_+___________x_o_x_o_x_o_x_o_x_____________+_x_o_x___|16%|76.92%
0.6750|~165O|__x_o___+_________x_o_x_o_x_o___o_x_o_____________x_o_x___|17.82%|73.08%
0.6600|~18OO|__x_o_____+_______x_o_x_o_x_____o_x_o_____________x_o_____|19.65%|69.23%
0.6450|~195O|__x_o_______+_____x_o_x_o_x_____o___o_____________x_______|21.48%|65.38%
0.6300|~21OO|__x_o_________+___x_o_x_o_x_________o_x___________x_______|23.3%|61.54%
0.6150|~225O|__x_o___________+_x_o_x_o_x_________o_x_o_________x_______|25.13%|57.69%
0.6000|~24OO|o_x_o_____________x_o___o___________o_x_o_x___x___x_______|26.95%|53.85%
0.5850|~255O|o_x_o_____________x_________________o_+_o_x_o_x_o_x_______|28.78%|50%
0.5700|~27OO|o_x_o_____________x_________________+___o_x_o_x_o_x_______|30.61%|46.15%
0.5550|~285O|o_x_o_x___________x_______________+_____o_x_o_x_o_x_______|32.43%|42.31%
0.5400|~3OOO|o_x_o_x_o_________x_____________+_______o_+_o_x_o_x_____+_|34.26%|38.46%
0.5250|~315O|o_x_o_x_o_________x___________+_________+___o_+_o_x___+___|36.08%|34.62%
0.5100|~33OO|o_+_o_x_o_________x_________+_______________+___o_x_+_____|37.91%|30.77%
0.4950|~345O|+___o_x_o_____x___x_______+_____________________o_+_______|39.74%|26.92%
0.4800|~36OO|____o_+_o_____x_o_x_____+_______________________+_________|41.56%|23.08%
0.4650|~375O|____+___o_____x_o_x___+___________________________________|43.39%|19.23%
0.4500|~39OO|________o_x___x_o___+_____________________________________|45.22%|15.38%
0.4350|~4O5O|________o_x_o_x___+_______________________________________|47.04%|11.54%
0.4200|~42OO|________o_x_o_x_+_________________________________________|48.87%|7.69%
0.4050|~435O|________o_+_o_+___________________________________________|50.69%|3.85%
0.3900|~45OO|________+___+_____________________________________________|52.52%|0%
Column|||||||7_1_1_5_1_3_3_6_3_1_7_9_9_1_9_9_1_3_7_3_6_4_5_5_7_1_6_9_3_|
Count||||||||__3_5___O_________7_______4_____1_________________7_______|

http://iticsoftware.com/postimages2//201009/BJF-Trading-Group-NzdUsd10Dec051743.xls
Posted by: MDunleavy Dec 13, 2010, 08:55 AM

"P&F USDCAD10080 Box Size 250X3 or(5.94%) HI/LO
Data 1.6196 - 0.9056 ~ 248.57 Month ~ 7308 Day
Database 1045 records 1.00896 (Last Close)
1990-12-02 00~00
2010-12-05 00~00 (GMT+01:00) Paris
BJF Trading Group https://docs.google.com/Doc?docid=0ARXFe9FXJohUZGNmdGtxNTNfMjM3Y3ZzaHN3dms&authkey=CNH7-6gP&hl=en#USDCAD10080 chart"
1.6250|~25O||________+___+_______________________________|-0.33%|79.44%
1.6000|~5OO||____+___x_+_x_+_____________________________|1.21%|76.68%
1.5750|~75O||____x_+_x_o_x_o_+___________________________|2.75%|73.92%
1.5500|~1OOO|____x_o_x_o_x_o___+_________________________|4.3%|71.16%
1.5250|~125O|____x_o_x_o___o_____+_______________________|5.84%|68.4%
1.5000|~15OO|____x_o_x_____o_______+_____________________|7.38%|65.64%
1.4750|~175O|____x_o_x_____o_________+___________________|8.93%|62.88%
1.4500|~2OOO|+___x_o_____+_o___________+_________________|10.47%|60.11%
1.4250|~225O|x_+_x_____+___o_____________+_______________|12.02%|57.35%
1.4000|~25OO|x_o_x___+_____o_x_____________+_____________|13.56%|54.59%
1.3750|~275O|x_o_x_+_______o_x_o_____________+___________|15.1%|51.83%
1.3500|~3OOO|x_o_+_________o_x_o_______________+_________|16.65%|49.07%
1.3250|~325O|x_+___________o_x_o_________________+_______|18.19%|46.31%
1.3000|~35OO|x_____________o_x_o_________x___x___x_+_____|19.73%|43.55%
1.2750|~375O|x_____________o_+_o_________x_o_x_o_x_o_+___|21.28%|40.79%
1.2500|~4OOO|x_____________+___o_x_______x_o_x_o_x_o___+_|22.82%|38.03%
1.2250|~425O|x_________________o_x_o_____x_o_x_o_x_o_____|24.36%|35.27%
1.2000|~45OO|x_________________o_x_o_____x_o_x_o___o_____|25.91%|32.51%
1.1750|~475O|x_________________o_+_o_x___x_o_x_____o_____|27.45%|29.75%
1.1500|~5OOO|x_________________+___o_x_o_x_o_______o_____|28.99%|26.99%
1.1250|~525O|______________________o_x_o_x_________o_____|30.54%|24.23%
1.1000|~55OO|______________________o_+_o_x_________o_____|32.08%|21.47%
1.0750|~575O|______________________+___o_x_________o_x___|33.63%|18.71%
1.0500|~6OOO|__________________________o_x_________o_x_o_|35.17%|15.95%
1.0250|~625O|__________________________o_x_______+_o_x_o_|36.71%|13.18%
1.0000|~65OO|==========================o=x=====+===o=+=o=|38.26%|10.42%
0.9750|~675O|__________________________o_x___+_____+___+_|39.8%|7.66%
0.9500|~7OOO|__________________________o_x_+_____________|41.34%|4.9%
0.9250|~725O|__________________________o_+_______________|42.89%|2.14%
0.9000|~75OO|__________________________+_________________|44.43%|-0.62%
Column|||||||1_3_9_5_6_3_3_1_5_9_3_6_3_1_1_6_6_4_4_1_3_3_|
Count||||||||2_____________3___________O_5_________2_____|

https://docs.google.com/leaf?id=0BxxKzvQ2GlM8ZTFlZjc2N2MtMjVhNS00YWUyLWJlMTUtMGQ3MGZlNzdhZTRk&hl=en
Posted by: MDunleavy Dec 20, 2010, 07:46 AM
A look at the CHF, its historical use as a safe haven currency.
P&F =>>> Chf\Jpy & Jpy\Chf; Usd\Chf; Gbp\Chf; Eur\Chf and Chf Index.

=>>>img88.imageshack.us/img88/9812/10dec191731.pdf
http://iticsoftware.com/postimages2//201009/BJF-Trading-Group-Mix10Dec181629.xls
Posted by: MDunleavy Dec 27, 2010, 11:00 AM
P&F =>>> EUR\Usd;Aud;Chf;Gbp;Nzd;Jpy;Cad.
"P&F EURUSD10080 Box Size 250X3 or(6.18%) HI/LO
Data 1.6038 - 0.8225 240.79 Month 7329 Day
Database 1048 records 1.31209 (Last Close)
1990-11-25 00 00
2010-12-19 00 00 (GMT+01:00) Paris
BJF Trading Group https://docs.google.com/Doc?docid=0ARXFe9FXJohUZGNmdGtxNTNfMjM3Y3ZzaHN3dms&authkey=CNH7-6gP&hl=en&pli#EURUSD10080 chart"

http://iticsoftware.com/postimages2//201009/BJF-Trading-Group-EurUsdMix10Dec260435.xls
Posted by: MDunleavy Jan 2, 2011, 11:15 PM

"P&F AUDUSD10080 Box Size 180X3 or(7.19%) HI/LO
Data 1.0255 - 0.4773 ~ 241.48 Month ~ 7350 Day
Database 1051 records 1.02294 (Last Close)
1990-11-11 00~00
2010-12-26 00~00 (GMT+01:00) Paris
BJF Trading Group https://docs.google.com/View?id=dcftkq53_237cvshswvk#AUDUSD10080 chart"

http://iticsoftware.com/postimages2//201009/BJF-Trading-Group-AUDUSD_2011-Jan-02.xls
MDunleavy.zip ( 9.04K )
: 0
Posted by: MDunleavy Jan 10, 2011, 01:10 PM

"P&F GOLD5 Box Size$2X3 or(0.43%) HI/LO
Data 1408.98 - 1352.72 ~ 0.19 Month ~ 5.83 Day
Database 1050 records 1372.64 (Last Close)
2011-01-04 13~00
2011-01-10 08~50 (GMT+01:00) Paris
BJF Trading Group https://docs.google.com/View?id=dcftkq53_237cvshswvk#GOLD5 chart"
1410|~2||+_____________________________________|-0.07%|4.23%
1408|~4||x_o___________________________________|0.07%|4.09%
1406|~6||__o_+_________________________________|0.21%|3.94%
1404|~8||__o___+_______________________________|0.35%|3.79%
1402|~1O|__o_____+_____________________________|0.5%|3.64%
1400|~12|__o_______+___________________________|0.64%|3.5%
1398|~14|__o_________+_________________________|0.78%|3.35%
1396|~16|__o___________+_______________________|0.92%|3.2%
1394|~18|__o_____________+_____________________|1.06%|3.05%
1392|~2O|__o_______________+___________________|1.21%|2.9%
1390|~22|__o_________________+_________________|1.35%|2.76%
1388|~24|__o___________________+_______________|1.49%|2.61%
1386|~26|__o_____________________+_____________|1.63%|2.46%
1384|~28|__o_x___x_________________+___________|1.77%|2.31%
1382|~3O|__o_x_o_x_o_________________+_________|1.91%|2.16%
1380|~32|__o_x_o_x_o___________________+_______|2.06%|2.02%
1378|~34|__o_x_o___o_x___x_______________x_____|2.2%|1.87%
1376|~36|__o_______o_x_o_x_o_____x_______x_o___|2.34%|1.72%
1374|~38|__________o_x_o_x_o_x___x_o_____x_o_x_|2.48%|1.57%
1372|~4O|==========o=x=o===o=x=o=x=o=====x=o=x=|2.62%|1.43%
1370|~42|__________o_x_____o_x_o_x_o_____x_o_x_|2.77%|1.28%
1368|~44|__________o_x_____o___o_x_o_____x_o_x_|2.91%|1.13%
1366|~46|__________o_x_________o___o_x___x_o___|3.05%|0.98%
1364|~48|__________o_______________o_x_o_x_____|3.19%|0.83%
1362|~5O|__________________________o_x_o_x___+_|3.33%|0.69%
1360|~52|__________________________o_x_o___+___|3.48%|0.54%
1358|~54|__________________________o_x___+_____|3.62%|0.39%
1356|~56|__________________________o_x_+_______|3.76%|0.24%
1354|~58|__________________________o_+_________|3.9%|0.09%
1352|~6O|__________________________+___________|4.04%|-0.05%
Column|||1_1_4_3_3_1_7_3_3_5_3_4_5_1_6_3_9_6_4_|
Count||||__7_______O_______________1___________|

http://iticsoftware.com/postimages2//201009/BJF-Trading-Group-Gold_2011-Jan-10.xls
Posted by: MDunleavy Jan 16, 2011, 10:50 PM
Trade Idea: GBP/AUD - Sell ⬇(Stop Limit) at 1.6055; Target: 1.5770 ; Stop: 1.6245.
In the case of failures.
Trade Idea: GBP/AUD - Sell ⬇(Stop Limit) at 1.6340; Target: 1.5770 ; Stop: 1.6530.
"P&F GBPAUD10080 Box Size 500X4 or(8.79%) HI/LO
Data 3.0393 - 1.5138 ~ 240.1 Month ~ 7308 Day
Database 1046 records 1.60434 (Last Close)
~ 20.01 Years
1991-01-06 00~00
2011-01-09 00~00 (GMT+01:00) Paris
BJF Trading Group https://docs.google.com/View?id=dcftkq53_237cvshswvk chart"
3.0500|~5OO||________________________________+_______________________|-0.35%|101.48%
3.0000|~1OOO|________________________+___+___x_+_____________________|1.29%|98.18%
2.9500|~15OO|________________________x_+_x_+_x_o_x___________________|2.94%|94.87%
2.9000|~2OOO|________________________x_o_x_o_x_o_x_o_________________|4.58%|91.57%
2.8500|~25OO|________+___________+___x_o_x_o_x_o_x_o_+_______________|6.23%|88.27%
2.8000|~3OOO|________x_+_________x_+_x_o_x_o_x_o_x_o___+_____________|7.87%|84.96%
2.7500|~35OO|________x_o_+_______x_o_x_o_x_o_x_o_x_o_____+___+_______|9.52%|81.66%
2.7000|~4OOO|________x_o___+_____x_o_x_o_x_o_x_o_x_o_x_____+_x_+_____|11.16%|78.36%
2.6500|~45OO|________x_o_____+___x_o_x_o_x_o_x_o_x_o_x_o_____x_o_+___|12.81%|75.06%
2.6000|~5OOO|+_______x_o_______+_x_o___o_x_o___o_x_o_x_o_____x_o___+_|14.45%|71.75%
2.5500|~55OO|x_+_____x_o_________x_____o_x_____o___o_x_o_x___x_o_____|16.1%|68.45%
2.5000|~6OOO|__o_+___x_o_________x_____o_x_________o_x_o_x_o_x_o_____|17.74%|65.15%
2.4500|~65OO|__o_x_+_x_o_________x_____o_x_________o_x_o_x_o_x_o_____|19.39%|61.84%
2.4000|~7OOO|__o_x_o_x_o_x_______x_____o_x_________o_x_o_x_o_x_o_____|21.03%|58.54%
2.3500|~75OO|__o_x_o_x_o_x_o_____x_____o___________o___o_x_o_x_o_____|22.68%|55.24%
2.3000|~8OOO|__o_x_o_x_o_x_o_____x_______________+_____o_+_o_x_o_____|24.32%|51.94%
2.2500|~85OO|__o_x_o___o_x_o_x___x_____________+_______+___o_x_o_x___|25.97%|48.63%
2.2000|~9OOO|__o_x___+_o_x_o_x_o_x___________+_____________o_x_o_x_o_|27.61%|45.33%
2.1500|~95OO|__o_x_+___o_x_o_x_o_x_________+_______________o_x_o_x_o_|29.26%|42.03%
2.1000|1OOOO|__o_+_____o_x_o_x_o_x_______+_________________o_x_o_x_o_|30.91%|38.72%
2.0500|1O5OO|__+_______o_+_o_x_o_x_____+___________________o_+_o_+_o_|32.55%|35.42%
2.0000|11OOO|__________+___o_+_o_x___+_____________________+___+___o_|34.2%|32.12%
1.9500|115OO|______________+___o_x_+_______________________________o_|35.84%|28.81%
1.9000|12OOO|__________________o_+_________________________________o_|37.49%|25.51%
1.8500|125OO|__________________+___________________________________o_|39.13%|22.21%
1.8000|13OOO|______________________________________________________o_|40.78%|18.91%
1.7500|135OO|______________________________________________________o_|42.42%|15.6%
1.7000|14OOO|______________________________________________________o_|44.07%|12.3%
1.6500|145OO|______________________________________________________o_|45.71%|9%
1.6000|15OOO|______________________________________________________o_|47.36%|5.69%
1.5500|155OO|______________________________________________________o_|49%|2.39%
1.5000|16OOO|______________________________________________________+_|50.65%|-0.91%
Column|||||||1_9_7_4_1_1_7_8_5_7_1_4_7_1_1_7_8_9_8_1_7_8_5_1_1_1_4_1_|
Count||||||||________1_5_________8_____2_2_________2_______O_3_3___4_|


http://iticsoftware.com/postimages2//201009/BJF-Trading-Group-GBPAUD_2010-01-16.xls
Posted by: MDunleavy Jan 20, 2011, 08:54 PM
Trade Idea: Usd/Zar - Sell ⬇ (Stop Limit) at 7.00; Target: 6.8750/6.8000 ; Stop: 7.100.
In the case of failures.
Trade Idea: Usd/Zar - Sell ⬇ (Stop Limit) at 7.10; Target: 6.8750/6.8000 ; Stop: 7.1800.
"P&F USDZAR5 Box Size 100X3 or(0.43%) HI/LO
Data 7.1054 - 6.7969 ~ 0.3 Month ~ 9.13 Day
Database 2010 records 7.07367 (Last Close)
2011-01-11 14~50
2011-01-20 17~55 (GMT+01:00) Paris
BJF Trading Group https://docs.google.com/View?id=dcftkq53_237cvshswvk chart"
http://docs.google.com/View?id=dg3m7zmf_126c5nfqcx
7.1000|~1OO||__________________________________+___x_|0.08%|4.46%
7.0900|~2OO||__________________________________x_+_x_|0.22%|4.31%
7.0800|~3OO||__________________________________x_o_x_|0.36%|4.17%
7.0700|~4OO||__________________________________x_o_x_|0.5%|4.02%
7.0600|~5OO||__________________________________x_o_x_|0.64%|3.87%
7.0500|~6OO||__________________________________x_o_x_|0.78%|3.72%
7.0400|~7OO||__________________________________x_o___|0.92%|3.58%
7.0300|~8OO||__________________________________x_____|1.06%|3.43%
7.0200|~9OO||__________________________________x_____|1.2%|3.28%
7.0100|~1OOO|__________________________________x_____|1.34%|3.14%
7.0000|~11OO|__________________________________x_____|1.48%|2.99%
6.9900|~12OO|__________________________________x_____|1.62%|2.84%
6.9800|~13OO|______________________________+___x_____|1.76%|2.69%
6.9700|~14OO|__________+___+_______________x_+_x_____|1.91%|2.55%
6.9600|~15OO|__________x_+_x_+_____________x_o_x_____|2.05%|2.4%
6.9500|~16OO|__________x_o_x_o_+___________x_o_x_____|2.19%|2.25%
6.9400|~17OO|__________x_o_x_o___+_________x_o_______|2.33%|2.11%
6.9300|~18OO|__________x_o_x_o_____+_______x_________|2.47%|1.96%
6.9200|~19OO|__________x_o_x_o_______+_____x_________|2.61%|1.81%
6.9100|~2OOO|__________x_o___o_____x___x___x_________|2.75%|1.66%
6.9000|~21OO|__+_______x_____o_____x_o_x_o_x_______+_|2.89%|1.52%
6.8900|~22OO|__x_+_____x_____o_x___x_o_x_o_x_____+___|3.03%|1.37%
6.8800|~23OO|__x_o_+___x_____o_x_o_x_o_+_o_x___+_____|3.17%|1.22%
6.8700|~24OO|__x_o___+_x_____o_x_o_x_+___o_x_+_______|3.31%|1.08%
6.8600|~25OO|__x_o_____x_____o___o_x_____o_+_________|3.45%|0.93%
6.8500|~26OO|__x_o_____x_________o_______+___________|3.59%|0.78%
6.8400|~27OO|__x_o_x___x_______+_____________________|3.74%|0.63%
6.8300|~28OO|____o_x_o_x_____+_______________________|3.88%|0.49%
6.8200|~29OO|____o_x_o_x___+_________________________|4.02%|0.34%
6.8100|~3OOO|____o_+_o_x_+___________________________|4.16%|0.19%
6.8000|~31OO|____+___o_+_____________________________|4.3%|0.05%
6.7900|~32OO|________+_______________________________|4.44%|-0.1%
Column|~33OO|O_6_8_3_4_1_5_5_1_3_4_6_3_3_5_1_3_1_5_6_|
Count|~34OO||__________6_____O_____________1___5_____|

https://docs.google.com/leaf?id=0BxxKzvQ2GlM8ZTA5ZGQxNDEtZjJjMS00ODg4LWJlYzMtYjE1NWU1MjNlMzFk&sort=name&layout=list&num=50
Posted by: MDunleavy Jan 23, 2011, 11:05 PM
*DXY as forecasted achieved the 78 handle.
*This manifested on our screens this week and was mainly due to the Leadership of EURUSD to the upside above the long awaited StopHunt over 1.3497,there were still many undercurrents of coming USD strength.The undercurrents came in the form of risk aversion pairs USDCAD, USDJPY and USDCHF staging rather dramatic advances in the face of DXY weakness throughout most of the trading week.
*One reason of course is the upside leader EURUSD has the heaviest weighting in the DXY basket, but I suspect big players are beginning to take off risk and are also hedging as multiple asset classes are breaking down and or topping.(ForexStopHunters)
*U.S. DOLLAR INDEX: Dropped nearly 1% on Friday to 78.12, which would mark its lowest close since November 12.
Full size.
"P&F _DXY10080 Box Size1 70X3 or(5.33%) HI/LO
Data 120.51 - 70.7 ~ 215.72 Month ~ 6566 Day
Database 939 records 78.14 (Last Close)
1993-01-24 00~00 ~ 17.98 Years
2011-01-16 00~00 (GMT+01:00) Paris
BJF Trading Group https://docs.google.com/View?id=dcftkq53_237cvshswvk chart"
http://docs.google.com/View?id=dg3m7zmf_24hf487zfd
120.7|~17O||________________________+___+___________________________|-0.16%|70.72%
119.0|~34O||____________________+___x_o_x_+_________________________|1.25%|68.32%
117.3|~51O||____________________x_+_x_o_x_o_+_______________________|2.66%|65.91%
115.6|~68O||____________________x_o_x_o_x_o___+_____________________|4.07%|63.51%
113.9|~85O||____________________x_o_x_o_x_o_____+___________________|5.49%|61.1%
112.2|~1O2O|____________________x_o_x_o___o_______+_________________|6.9%|58.7%
110.5|~119O|____________________x_o_x_____o_________+_______________|8.31%|56.29%
108.8|~136O|____________________x_o_______o___________+_____________|9.72%|53.89%
107.1|~153O|____________________x_________o_____________+___________|11.13%|51.49%
105.4|~17OO|________________+___x_________o_______________+_________|12.54%|49.08%
103.7|~187O|____________+___x_+_x_________o_________________+_______|13.95%|46.68%
102.0|~2O4O|________+___x_+_x_o_x_________o___________________+_____|15.36%|44.27%
100.3|~221O|________x_+_x_o_x_o_x_________o_____________________+___|16.77%|41.87%
98.60|~238O|____+___x_o_x_o_x_o_________+_o_x_____________________+_|18.18%|39.46%
96.90|~255O|____x_+_x_o_x_o_x_________+___o_x_o_____________________|19.59%|37.06%
95.20|~272O|+___x_o_x_o___o_x_______+_____o_x_o_____________________|21%|34.65%
93.50|~289O|x_+_x_o_x_____o_______+_______o_+_o_____________________|22.41%|32.25%
91.80|~3O6O|__o_x_o_x___________+_________+___o_x___x_______________|23.82%|29.84%
90.10|~323O|__o_x_o_x_________+_______________o_x_o_x_o_____________|25.23%|27.44%
88.40|~34OO|__o_+_o_x_______+_________________o_x_o_x_o_x___x___x___|26.65%|25.04%
86.70|~357O|__+___o_x_____+___________________o_x_o_x_o_x_o_x_o_x_o_|28.06%|22.63%
85.00|~374O|______o_x___+_____________________o_+_o_x_o_x_o_x_o_x_o_|29.47%|20.23%
83.30|~391O|______o_x_+_______________________+___o_x_o_x_o_x_o_x_o_|30.88%|17.82%
81.60|~4O8O|______o_+_____________________________o_+_o_x_o_x_o_x_o_|32.29%|15.42%
79.90|~425O|______+_______________________________+___o_x_o_x_o_x_o_|33.7%|13.01%
78.20|~442O|==========================================o=x=o===o=x=o=|35.11%|10.61%
76.50|~459O|__________________________________________o_x_____o_x_o_|36.52%|8.2%
74.80|~476O|__________________________________________o_x___+_o_+___|37.93%|5.8%
73.10|~493O|__________________________________________o_x_+___+_____|39.34%|3.39%
71.40|~51OO|__________________________________________o_+___________|40.75%|0.99%
69.70|~527O|__________________________________________+_____________|42.16%|-1.41%
Column||||||1_3_5_9_1_3_4_5_6_3_1_5_6_5_4_1_3_8_4_6_6_1_1_6_6_8_8_7_|
Count|||||||________1___________1_________5___________2_O___________|
*But nevertheless! Prediction. Up from 77.74 to 79.58!

http://iticsoftware.com/postimages2//201009/BJF-Trading-Group-%24index%28DXY%29_2011-Jan-22.zip
Posted by: MDunleavy Jan 30, 2011, 10:12 PM
*AUD\SEK outlook.( AUD\SEK = AUD\USD X USD\SEK )
*Rally from 6.2635 to 6.4903. Up 2% in one day!
*In the future, we will probably see correction,
pullback, consolidation in this range.
*See charts below.
"P&F AUDSEK1 Box Size 70X3 or(0.32%) HI/LO
Data 6.5775 - 6.3625 ~ 0.24 Month ~ 7.24 Day
Database 7489 records 6.48179 (Last Close)
2011-01-21 17~10
2011-01-28 22~59 (GMT+01:00) Paris
http://iticsoftware.com https://docs.google.com/View?id=dcftkq53_237cvshswvk"
http://iticsoftware.com/postimages2//201009/view11Jan3016.htm
6.5730|~7O|||________x_______+_________________________________|0.07%|3.31%
6.5660|~14O||________x_o_x_o_x_+_______________________________|0.17%|3.2%
6.5590|~21O||________x_o_x_o_x_o_+_____________________________|0.28%|3.09%
6.5520|~28O||________x_o___o_+_o___+___________________________|0.39%|2.98%
6.5450|~35O||____x___x_____+___o_x___+_________________________|0.49%|2.87%
6.5380|~42O||x___x_o_x___+_____o_x_o___+_______________________|0.6%|2.76%
6.5310|~49O||x_o_x_o_x_+_______o_x_o_____+_____________________|0.71%|2.65%
6.5240|~56O||__o_x_o_x_________o_x_o_______+___________________|0.81%|2.54%
6.5170|~63O||__o_x_o___________o___o_________+___+_____________|0.92%|2.43%
6.5100|~7OO||__o_+_________________o_____x___x_+_x_+___________|1.03%|2.32%
6.5030|~77O||__+___________________o_x___x_o_x_o_x_o_+_________|1.13%|2.21%
6.4960|~84O||______________________o_x_o_x_o_x_o_x_o___+_____+_|1.24%|2.1%
6.4890|~91O||______________________o_x_o_x_o_x_o___o_____+___x_|1.35%|1.99%
6.4820|~98O||======================o===o=x=o=+=====o=======+=x=|1.45%|1.88%
6.4750|~1O5O|__________________________o_x_+_______o_________x_|1.56%|1.77%
6.4680|~112O|__________________________o_+_________o_x_______x_|1.66%|1.66%
6.4610|~119O|__________________________+___________o_x_o_____x_|1.77%|1.55%
6.4540|~126O|______________________________________o_x_o_____x_|1.88%|1.44%
6.4470|~133O|______________________________________o_x_o_____x_|1.98%|1.33%
6.4400|~14OO|______________________________________o_x_o_____x_|2.09%|1.22%
6.4330|~147O|______________________________________o___o_____x_|2.2%|1.11%
6.4260|~154O|__________________________________________o_____x_|2.3%|1%
6.4190|~161O|__________________________________________o_x___x_|2.41%|0.89%
6.4120|~168O|__________________________________________o_x_o_x_|2.52%|0.78%
6.4050|~175O|__________________________________________o_x_o_x_|2.62%|0.67%
6.3980|~182O|__________________________________________o___o_x_|2.73%|0.56%
6.3910|~189O|______________________________________________o_x_|2.84%|0.45%
6.3840|~196O|______________________________________________o_x_|2.94%|0.34%
6.3770|~2O3O|______________________________________________o_x_|3.05%|0.23%
6.3700|~21OO|______________________________________________o_x_|3.15%|0.12%
6.3630|~217O|______________________________________________o_+_|3.26%|0.01%
6.3560|~224O|______________________________________________+___|3.37%|-0.1%
Column|||||||2_4_5_4_8_3_2_3_2_7_4_9_3_5_6_4_4_3_3_1_5_1_3_8_1_|
Count||||||||______________________________________1___O_____8_|
http://iticsoftware.com/postimages2//201009/BJF-Trading-Group-AUDSEK_2011-01-29.zip
Posted by: MDunleavy Feb 7, 2011, 06:02 AM
Using P&F (Point and Figure) Charts in Forex Trading.
Review of online published on P & F charts. 
Click on any link below...
https://docs.google.com/View?id=dg3m7zmf_31dhpw7shp
http://iticsoftware.com/postimages2//XO11Feb06.htm
http://img145.imageshack.us/img145/6153/11feb061247.pdf
Posted by: MDunleavy Feb 13, 2011, 07:24 PM
2011-Feb-12 09-24 (GMT+01:00) Paris
I remain bearish on EUR/USD too.
EUR/USD's break of 1.3510 support last week indicates that whole decline from 1.3860 has resumed. Initial bias remains on the downside towards 100% projection at 1.3393 and possibly below. However, we'd remain cautiously bullish in EUR/USD as long as 1.3253 cluster support (61.8% retracement of 1.2873 to 1.3860 at 1.3250) [ by ActionForex]
Trade Idea: EUR/USD - Sell ⬇ (Stop Limit) at 1.3500; Target: 1.3250 ; Stop: 1.3600.
"P&F EURUSD10080 Box Size 260X3 or(6.43%) HI/LO
Data 1.6038 - 0.8225 ~ 242.4 Month ~ 7378 Day
Database 1055 records 1.35513 (Last Close)
1990-11-25 00~00 ~ 20.2 Years
2011-02-06 00~00 (GMT+01:00) Paris
http://iticsoftware.com/postimages2//EURUSD11Feb13.htm MDunleavy chart"

http://iticsoftware.com/postimages2//201009/BJF-Trading-Group_EURUSD11Feb11.xls
Posted by: MDunleavy Feb 21, 2011, 11:09 AM
After an upbeat week, the pound faces new information about the upcoming rate hike and also a worrying GDP among other events. Here’s an outlook for the British events and an updated technical analysis for GBP/USD.
I am neutral on GBP/USD.
The rate policy is still unclear, although it will come earlier than expected. On the other hand, we’ll get a reminder of the horrible fourth quarter. Another interesting week is ahead of us, but a major breakthrough isn’t likely. [by forexcrunch].
"P&F GBPUSD10080 Box Size 270X4 or(6.23%) HI/LO
Data 2.1161 - 1.3503 ~ 241.71 Month ~ 7357 Day
Database 1052 records 1.62521 (Last Close)
1990-12-23 00~00 ~ 20.14 Years
2011-02-13 00~00 (GMT+01:00) Paris
https://spreadsheets.google.com/pub?hl=ru&key=0AhXFe9FXJohUdFE0b0FKY3d6eEVCZm04WjlxU0UtTlE&hl=ru&gid=1 https://docs.google.com/View?id=dcftkq53_237cvshswvk#Download chart"

http://iticsoftware.com/postimages2//201009/BJF-Trading-Group-GBPUSD_11Feb20.xls
^^^ OR vvv
https://docs.google.com/leaf?id=0BxxKzvQ2GlM8YjcxYTExZDMtOGExZC00NDM2LTlkZTctODg2MWJhODE1YzJj&sort=name&layout=list&num=50
Posted by: MDunleavy Feb 28, 2011, 04:50 PM
This has been a turbulent week on the geopolitical front, triggering waves in the stock market and sending the price of crude oil through the roof. While the stock market corrects itself (as we anticipated), the price of crude oil seems to be creeping ever higher, putting upward pressure on the price of fuel and energy. Worse still is the serious effect this could have on the economic recovery that everyone has been banking on.[marketoracle]There's no way of knowing how events will unfold. Since the current oil price is always the best predictor of the future oil price in the very short-term, I predict that Nymex WTI will be priced in the $93-$104 range on March 12th.
------------------
"P&F QM_CONT1440 Box Size $4X3 or(13.94%) HI/LO
Data 147.3 - 24.825 ~ 99.68 Month ~ 3034 Day
Database 2000 records 98.225 (Last Close)
2002-11-05 00~00 ~ 8.31 Years
2011-02-25 00~00 (GMT+01:00) Paris
http://iticsoftware.com/postimages2//Oil11Feb28.html https://docs.google.com/View?id=dcftkq53_237cvshswvk chart"
------------------
148.00|~4||____________+_________________________|-0.48%|496.17%
144.00|~8||____________x_+_______________________|2.24%|480.06%
140.00|~12|____________x_o_+_____________________|4.96%|463.95%
136.00|~16|____________x_o___+___________________|7.67%|447.83%
132.00|~2O|____________x_o_____+_________________|10.39%|431.72%
128.00|~24|____________x_o_______+_______________|13.1%|415.61%
124.00|~28|____________x_o_________+_____________|15.82%|399.5%
120.00|~32|____________x_o___________+___________|18.53%|383.38%
116.00|~36|____________x_o_____________+_________|21.25%|367.27%
112.00|~4O|____________x_o_______________+_______|23.96%|351.16%
108.00|~44|____________x_o_x_______________+_____|26.68%|335.05%
104.00|~48|____________x_o_x_o_______________+___|29.4%|318.93%
100.00|~52|________x___x_o_x_o_________________x_|32.11%|302.82%
96.00||~56|________x_o_x_o_x_o_________________x_|34.83%|286.71%
92.00||~6O|________x_o_x_o___o_________________x_|37.54%|270.59%
88.00||~64|________x_o_______o_________________x_|40.26%|254.48%
84.00||~68|________x_________o_____________x___x_|42.97%|238.37%
80.00||~72|________x_________o_____________x_o_x_|45.69%|222.26%
76.00||~76|____x___x_________o_____________x_o_x_|48.4%|206.14%
72.00||~8O|____x_o_x_________o_________x___x_o_x_|51.12%|190.03%
68.00||~84|x___x_o_x_______+_o_________x_o_x_o___|53.84%|173.92%
64.00||~88|x_o_x_o_x_____+___o_________x_o_x_____|56.55%|157.8%
60.00||~92|x_o_x_o_x___+_____o_________x_o_______|59.27%|141.69%
56.00||~96|x_o___o_x_+_______o_________x_________|61.98%|125.58%
52.00|~1OO|x_____o_+_________o_________x_______+_|64.7%|109.47%
48.00|~1O4|x_____+___________o_x___x___x_____+___|67.41%|93.35%
44.00|~1O8|x_________________o_x_o_x_o_x___+_____|70.13%|77.24%
40.00|~112|x_________________o_x_o_x_o_x_+_______|72.84%|61.13%
36.00|~116|x_________________o___o___o_+_________|75.56%|45.02%
32.00|~12O|x_________________________+___________|78.28%|28.9%
28.00|~124|x_____________________________________|80.99%|12.79%
24.00||||||1_3_5_6_1_3_1_1_4_1_3_3_3_3_9_3_6_4_8_|
Column|||||1_______2___4_3___8___________________|
http://iticsoftware.com/postimages2//201009/BJF-Trading-Group-Oil11Feb28.xls
^^^ OR vvv
http://img96.imageshack.us/img96/4624/11feb281149.pdf
Posted by: MDunleavy Mar 13, 2011, 11:10 PM
*Trade Idea: NZD/USD- Sell (Stop Limit) at 1.7410\40; Target: 1.7100\30; Stop: 1.7480\1.7520.
*I remain bearish on NZD/USD.
*The consequences of the devastating earthquake are still felt in New Zealand. A rate cut to accommodate to the economic weakness will likely drive prices even lower.
=======================
*The NZD/USD has formed a hammer at the 0.7350 level, a key support level for the last several months. Because of this, it looks decidedly bullish for the short-term. It appears that support will end up holding, and as such – we could see more consolidation between this level and 0.7800.
Any break above Thursday’s high. 0.7377 is a buy signal towards as highs at 0.78, and any break below its low at 0.7320 is a sell signal that could lead up down to 0.70 or lower. This pair is at one of those places you like to take longer-term trades since it is such an important area.[dailymarkets]
"P&F NZDUSD10080 Box Size 150X3 or(7.43%) HI/LO
Data 0.8214 - 0.39 ~ 243.32 Month ~ 7406 Day
Database 1059 records 0.74246 (Last Close)
1990-11-25 00~00
2011-03-06 00~00 (GMT+01:00) Paris
http://iticsoftware.com/postimages2//11M12.html https://docs.google.com/document/pub?id=1U6uMFZXP5SVZ2Hj7x2wnEWjsB2BCPXfXb7xBml8QCvQ chart"


http://iticsoftware.com/postimages2//201009/BJF-Trading-Group-NZDUSD_11M12.xls
vvv OR ^^^
http://img29.imageshack.us/img29/636/11m13.pdf
Posted by: MDunleavy Mar 22, 2011, 09:38 AM
A comparison of algorithms for the three programs.
Indicator puma1, Bull's-Eye Broker and XL ChartPro.
https://docs.google.com/leaf?id=0BxxKzvQ2GlM8MzZmNWI3NjctOWJjNS00ZjczLTgxMzYtZDZjZDBiZmJjOTgz&sort=name&layout=list&num=50
===========================
Look carefully at the English pound!
Trade Idea: GBP\USD - Sell Stop at 1.6259; Target: 1.5961; Stop: 1.6351.
Big Picture full size ↓ and Exel chart.
http://img846.imageshack.us/img846/7990/big11m22.png
^^^ Picture; Excel file vvv
https://docs.google.com/leaf?id=0BxxKzvQ2GlM8M2Q5NDRmMTctYmNmMC00OTI3LTlmM2ItOGEyZTA1MjI2YjFm&sort=name&layout=list&num=50
Posted by: MDunleavy Mar 27, 2011, 01:22 PM
I turn bearish on NZD/CAD.
I'm afraid of a bull trap...NZDCAD=NZDUSD X USDCAD
=========================================
_____The Canadian economy won't release any economic fundamentals before next Wednesday,....
_____NzdUsd pair was able to rise during the last week to cover its previous losses, as the economy expanded ......
[ForexMansion.com]
Learn more .... 
https://docs.google.com/document/pub?id=1cVITjOIRPqY040Qn_lcGsD9GNyxrGbSK5gb5KWOotAQ
^^^ OR vvv
http://img593.imageshack.us/img593/5461/11m26.pdf
^^^ OR vvv
http://iticsoftware.com/postimages2//11M27.html
Posted by: MDunleavy Mar 29, 2011, 09:56 AM
Trade Idea: GBP/CHF - Sell ???
~~~>https://docs.google.com/document/pub?id=1oYwnTw8uVA5GpqsfsK3dclJskwOR5uBG0Q-1kgAYRsQ
Posted by: MDunleavy Apr 4, 2011, 07:39 PM
I remain bearish on USD/CAD.
Details in this document (GOOGLE DOCS).
~~~>https://docs.google.com/document/pub?id=1uIik0Q8jn9v6jvFRfcSJ2GFGRygn-gRkXV5XbB7Wxfg&pli=1
Posted by: MDunleavy Apr 10, 2011, 09:14 PM
I turn bearish on Usd/Jpy. My Sell position at 84.921 SL 85.68 TP 83.21
https://docs.google.com/document/pub?id=14YIgWu6mqwm0AYkhG14x-1vwsygUUGs3krB4a1Q7iyA#id.p0i1hoift9jk
Posted by: MDunleavy Apr 18, 2011, 06:12 PM

I sold a pound of 1.63026; SL 1.64226; TP 1.60626.
Further comments on the development of the situation will be here.
https://docs.google.com/document/pub?id=14YIgWu6mqwm0AYkhG14x-1vwsygUUGs3krB4a1Q7iyA&pli=1#id.cqitah23wa3e
Posted by: MDunleavy May 3, 2011, 07:52 PM
DXY:The market remains under intense pressure with the price dropping to yet another fresh yearly and multi-month low below 73.00 thus far.
https://docs.google.com/document/pub?id=14YIgWu6mqwm0AYkhG14x-1vwsygUUGs3krB4a1Q7iyA#id.20hgavhe1yoe
Posted by: MDunleavy May 16, 2011, 10:59 AM
The USD/CAD rose this week, but fell short of closing above the all-important 0.97 area. This shows that the area is indeed significant, and could be a massive headwind for USD strength in this pair. Compounding this is the fact that there is a downtrend line that we are currently bumping up against. I remain bearish on USD/CAD.
The Canadian dollar doesn’t rely only on oil, but is more dependent on the US economy, which is gradually improving. In addition, the economy of Canada is doing great, especially with the recent impressing gain in jobs.

https://docs.google.com/document/pub?id=14YIgWu6mqwm0AYkhG14x-1vwsygUUGs3krB4a1Q7iyA#id.yhxodux8ibu5
Posted by: MDunleavy May 30, 2011, 10:03 AM
Forex - USD/CHF weekly outlook: May 30 - June 3
Forex Pros – The broadly stronger Swiss franc surged to a record high against the U.S. dollar on Friday, as a combination of concerns over the outlook for U.S. economic growth and euro zone sovereign debt issues weighed on risk sentiment....

BJF Trading Group. https://docs.google.com/document/pub?id=14YIgWu6mqwm0AYkhG14x-1vwsygUUGs3krB4a1Q7iyA#id.ol9goxb58hae http://img857.imageshack.us/img857/3482/11may30.pdf
Posted by: MDunleavy Jun 8, 2011, 01:57 PM
The Euro exchange rate made widespread gains against the majors yesterday, on speculation that officials will contain the sovereign debt crisis and proceed to raise interest rates over the coming month. The single currency reached the highest level in a month versus the U.S Dollar, advancing 0.8% on the day to 1.47. The Dollar was subjected to renewed selling pressure, as global risk appetite improved.

https://docs.google.com/document/pub?id=1fqx-sUKZqF5FCzJUFRnGwz6GSactFp1SPCwlWhzix8A#id.2h58o4ljrrdo http://img194.imageshack.us/img194/8035/11jun08.pdf
Posted by: MDunleavy Jun 13, 2011, 09:38 PM
Headlines:
News flows and economic announcements are slow at the start of this week, and movement is likely to come from technical reactions to recent trade, rather than breaking headlines...

https://docs.google.com/document/pub?id=1fqx-sUKZqF5FCzJUFRnGwz6GSactFp1SPCwlWhzix8A#id.1wlhpdb82x3s
^^^ OR vvv
http://img853.imageshack.us/img853/9797/11jun132.pdf
^^^ OR vvv
Posted by: MDunleavy Jun 21, 2011, 09:36 AM
A noteworthy improvement in Reserve Bank of New Zealand interest rate forecasts has coincided with a fairly sharp New Zealand Dollar recovery. Indeed, the NZD trades at fresh post-float highs, and relative yield expectations have likely played a part.....Detail↓

http://iticsoftware.com/postimages2//201009/11Jun21.html
^^^ OR vvv
http://img192.imageshack.us/img192/8363/11jun21.pdf
^^^ OR vvv
https://docs.google.com/document/pub?id=1fqx-sUKZqF5FCzJUFRnGwz6GSactFp1SPCwlWhzix8A#id.4hss3l3l2qa1
Posted by: MDunleavy Jun 28, 2011, 07:20 AM
Yen is weaker, having lost 0.6% against the USD and underperforming on most of the crosses. There were no fundamental releases as Japanese politics and decreasing support for Prime Minister Kan are the main focus. Still USD/JPY has been remarkably stable over the last two months, essentially range trading between 80 and 82.
Detail below.

http://iticsoftware.com/postimages2//201009/11Jun28.html
^^^ OR vvv
http://img171.imageshack.us/img171/4431/final11jun27.pdf
^^^ OR vvv
https://docs.google.com/document/pub?id=1fqx-sUKZqF5FCzJUFRnGwz6GSactFp1SPCwlWhzix8A#id.5xfkhpioyjci
Posted by: MDunleavy Jul 4, 2011, 05:36 AM
Last week GDP reading showed Canadian economy started Q2 with no change after a previous 0.1% decline. Canadian Dollar rose after the Greek vote but dropped again after the disappointing US unemployment reading. Will this trend continue?

http://iticsoftware.com/postimages2//201009/11Jul03.html
^^^ OR vvv
http://mdunleavy.byethost7.com/11Jul03.html
^^^ OR vvv
https://docs.google.com/document/pub?id=1r5tvs16QsoQfcng4CL1LxaWk5U9xx2XyLke4fv7UUdQ#id.mxybpx46qbf7
Posted by: MDunleavy Jul 12, 2011, 10:50 AM
The AUD/USD pair fell hard on Monday, as the USD gained steam against almost all currencies. The markets sold off in general, and risk was shunned by almost all traders as the markets worry about contagion from European debt issues. The pair is still in a bullish uptrend though, and as such – we like buying, but we need a supportive candle first.....

http://iticsoftware.com/postimages2//201009/11Jul12.html
^^^ OR vvv
http://mdunleavy.byethost7.com/11Jul12.html
^^^ OR vvv
https://docs.google.com/document/pub?id=1r5tvs16QsoQfcng4CL1LxaWk5U9xx2XyLke4fv7UUdQ#id.b1uj2dsz6igc
Posted by: MDunleavy Jul 17, 2011, 01:07 PM
The GOLD found resistance on 1590\95 after the validation of the breakout of
1580 points.
The pair is currently trying a return above 1593.
All indicators are still bullish.
But still ...
Trade Idea: GOLD - Sell (Stop Limit) at 1593.60; Target: 1580.80 ; Stop: 1600.00.
CLICK HERE for detail information...
http://mdunleavy.byethost7.com/11Jul17.html
^^^ OR vvv
http://iticsoftware.com/postimages2//201009/11Jul17.html
^^^ OR vvv
https://docs.google.com/document/pub?id=1r5tvs16QsoQfcng4CL1LxaWk5U9xx2XyLke4fv7UUdQ#id.jhowt65dxs6a
Posted by: MDunleavy Jul 25, 2011, 02:08 PM
More on ... XAU/USD
Gold ’s had an unbelievable start to the week as it surged above the all-time highs at 1610 and is now bumping up against 1625. Gold’s move is being driven by worries about the US dollar as investors seek a safer alternative to the struggling greenback. Any pullback to 1610 will be seen as a buying opportunity, while traders are also likely to take long positions.....

CLICK HERE for detail information...
http://img696.imageshack.us/img696/7536/u11jul25.pdf
^^^ OR vvv
https://docs.google.com/leaf?id=0BxxKzvQ2GlM8YzJmZjE5NTgtNTliMC00ODJlLTliMzUtOWE2MWE1N2JjNTkz&sort=name&layout=list&num=50
^^^ OR vvv
https://docs.google.com/document/pub?id=1r5tvs16QsoQfcng4CL1LxaWk5U9xx2XyLke4fv7UUdQ#id.jhowt65dxs6a
Posted by: MDunleavy Aug 1, 2011, 03:27 PM
USD/CHF: Despite the intense downtrend resulting in recently established fresh record lows below 0.8000, short/medium/longer-term technical studies are looking quite stretched to us, and we continue to like the idea of taking shots at buying in anticipation of a major base...
http://img24.imageshack.us/img24/3980/o11aug01.pdf
^^^ OR vvv
http://mdunleavy.byethost7.com/11Aug01o.html
^^^ OR vvv
https://docs.google.com/document/pub?id=1r5tvs16QsoQfcng4CL1LxaWk5U9xx2XyLke4fv7UUdQ#id.778o9ee9fdil
Posted by: MDunleavy Aug 7, 2011, 06:03 PM
The Swiss franc is having a one sided summer, thanks to the global slowdown.
Even a sophisticated intervention attempt by the SNB was short lived, and failed to stop the franc.
The debt crisis in the old continent and the debt ceiling issues in the US meant a stronger Swiss franc across the board, with fresh records against both major currencies.
Where will this stop? 
~~~>http://mdunleavy.byethost7.com/11Aug01o.html
^^^ OR vvv
~~~>http://img146.imageshack.us/img146/5498/11aug06.pdf
^^^ OR vvv
~~~>https://spreadsheets.google.com/pub?key=0AhXFe9FXJohUdFE0b0FKY3d6eEVCZm04WjlxU0UtTlE&hl=ru&single=true&gid=1&output=html
Posted by: MDunleavy Aug 14, 2011, 08:59 PM
*The Euro is still unclear and it seems that investors are waiting for some kind of a trigger to determine the direction. Monday is French & Italian holidays, so the Euro might by numb until Tuesday. Then, there is an important data such as the German GDP and building permits in the US.
*The 200 SMA is still a strong supportive area for the Euro, and as long as it remains above that support it will have better chances for rising towards 1.44 and above. A break-down can take the Euro down to 1.385.
By forexpros....
~~~>http://mdunleavy.byethost7.com/11Aug14.html
^^^ OR vvv
~~~>http://img155.imageshack.us/img155/151/11aug14.pdf
^^^ OR vvv
~~~>https://docs.google.com/document/pub?id=1802O1jqxFocie_a6-SU_qe2G75KoKC_JO_InzIxqx1k#id.mprxaw5178k8
Posted by: MDunleavy Aug 22, 2011, 07:42 AM
*EUR attempted a rally last week but found resistance at 1.4516 and pulled back.
*As we have noted before, the key resistance level on the daily chart is 1.4530/40 and only a firm move abv there will indicate the next leg higher is under way.
*Until that happens, EUR/USD is in trading range.
Trade Idea: EUR/USD - Buy Stop at 1.4420; Target: 1.4900 ; Stop: 1.4310.
CLICK HERE for detail information...
~~~>http://mdunleavy.byethost7.com/11Aug14.html
^^^ OR vvv
~~~>http://iticsoftware.com/postimages2//201009/11Aug14.html
^^^ OR vvv
~~~>https://docs.google.com/document/pub?id=1802O1jqxFocie_a6-SU_qe2G75KoKC_JO_InzIxqx1k#id.mprxaw5178k8
Posted by: MDunleavy Aug 29, 2011, 07:34 AM
The British pound reversed its gains and closed lower. Is this the beginning of a long term move?
CLICK HERE for detail information...
~~~>http://iticsoftware.com/postimages2//201009/11Aug29.html
^^^ OR vvv
~~~>http://mdunleavy.byethost7.com/11Aug29.html
^^^ OR vvv
~~~>https://docs.google.com/document/pub?id=1802O1jqxFocie_a6-SU_qe2G75KoKC_JO_InzIxqx1k#id.wnlh7655fung
Posted by: MDunleavy Sep 12, 2011, 06:08 AM
*The GBP/USD may continue its drop if data from the U.K. or other global economies remained bearish as it will increase the appeal of the dollar as a safe haven. On the hand, the dollar may remain boosted by the $447 billion jobs stimulus plan proposed by president Obama the pervious week.
*This week, the main attention will be on inflation data from both economies as it will give an update about inflation status amid expectations that there might be monetary intervention by the Fed on Sep. 20-21 meeting and by the BoE later in the year.
CLICK HERE for detail information...
~~~>http://iticsoftware.com/postimages2//201009/11Aug29.html
^^^ OR vvv
~~~>http://mdunleavy.byethost7.com/11Aug29.html
^^^ OR vvv
~~~>http://img263.imageshack.us/img263/640/11sep111.pdf
Posted by: MDunleavy Sep 20, 2011, 10:47 AM
Reasons for a major turn in the us dollar
Bullish dollar
While the Dollar Index hits multi-decade lows and as the euro continues to trade within striking distance of record highs, savvy investors are beginning to wonder if the current market conditions present a unique opportunity to buy the US currency at ultra-cheap levels....[ by fxtrademaker]
~~~>http://mdunleavy.byethost7.com/11Sep20.html
^^^ OR vvv
~~~>http://img545.imageshack.us/img545/7531/11sep20.pdf
^^^ OR vvv
~~~>http://iticsoftware.com/postimages2//201009/11Sep20.html
Posted by: MDunleavy Sep 25, 2011, 09:51 PM
Market Commentary Dollar Index is just nearing resistance zone of 78.75-79.30 ranges though double dip depression in the US is still glooming resulting in most of the asset classes trading softer especially the equities, the dollar index may go sideways.
CLICK HERE for detail information...
~~~>http://mdunleavy.byethost7.com/11Sep20.html
^^^ OR vvv
~~~>http://img19.imageshack.us/img19/1197/11sep25.pdf
^^^ OR vvv
~~~>http://iticsoftware.com/postimages2//201009/11Sep20.html
Posted by: MDunleavy Oct 3, 2011, 06:51 AM
The New Zealand dollar continued lower for another week. Where will it stop? NZIER Business Confidence is the major event this week.
==============
Trade Idea:Nzd/Usd - Sell Stop at 76.00; Target: 74.00 ; Stop: 77.14
CLICK HERE for detail information...
~~~>http://mdunleavy.byethost7.com/11Oct02.html
^^^ OR vvv
~~~>http://iticsoftware.com/postimages2//201009/11Oct02.html
^^^ OR vvv
~~~>http://img828.imageshack.us/img828/1056/11oct021.pdf
Posted by: MDunleavy Oct 17, 2011, 12:08 PM
I am neutral on USD/JPY.
While the pair finally closed above 77 and has room for gains in the long run, it is hard to see the pair making a serious move right now. The high level of optimism probably won’t be repeated right now.[forexcrunch]
~~~>http://iticsoftware.com/postimages2//201009/11Oct17.html
^^^ OR vvv
~~~>http://mdunleavy.byethost7.com/11Oct17.html
^^^ OR vvv
~~~>http://img269.imageshack.us/img269/3568/11oct17.pdf
Posted by: MDunleavy Oct 23, 2011, 11:34 AM
Updated review Usd\Jpy
See post above too.
~~~>img402.imageshack.us/img402/7995/11oct22.pdf
Posted by: MDunleavy Oct 30, 2011, 08:49 PM
The Canadian dollar made more gains against the US dollar and crossed the line of parity. GDP and employment data are the major events this week. Here’s an outlook for the Canadian events and an updated technical analysis for USD/CAD.[forexcrunch]
CLICK HERE for detail information...
~~~>http://iticsoftware.com/postimages2//201009/11Oct25.html
^^^ OR vvv
~~~>http://img27.imageshack.us/img27/3191/11oct30.pdf
^^^ OR vvv
~~~>http://mdunleavy.byethost7.com/11Oct25.html
Posted by: MDunleavy Nov 6, 2011, 07:58 PM
USD/CAD bounced this past week as traders sold off a lot of risk-related assets globally. The pair finished strongly above the parity level, and as such has us thinking long at this point. However, the 1.03 area will be resistive, and as such we are waiting for a close above it in order to buy. The selling of this pair can be done if we break the lows of this past week’s candle. Until then, we think this market goes sideways.[by fxempire]
~~~>iticsoftware.com/postimages2//201009/11Oct25.html
^^^ OR vvv
~~~>img249.imageshack.us/img249/4943/11nov06.pdf
^^^ OR vvv
~~~>mdunleavy.byethost7.com/11Oct25.html
^^^ OR vvv
A t t a c h m e n t
Posted by: MDunleavy Nov 14, 2011, 06:43 AM
*FXstreet.com (California) - AUD/USD opened the Asian morning at 1.0342 and has since broken below the 1.0300 zone. From a technical standpoint, Valeria Bednarik, Chief Analyst at FXstreet.com finds that bigger time frames support a bullish outlook for this Monday, as long as above 1.0270.
*At time of writing, AUD/USD is quoted in the 1.0290 zone, around 10 pips above Friday's closing price. If the pair continues its decline in the session ahead, support levels lie at 1.0270, 1.0230 and 1.0180. To the upside, resistance levels lie at 1.0360, 1.0400 and 1.0440.
CLICK HERE for detail information...
~~~>http://mdunleavy.byethost7.com/11Nov13.html
^^^ OR vvv
~~~>http://iticsoftware.com/postimages2//201009/11Nov13.html
^^^ OR vvv
A t t a c h m e n t
^^^ OR vvv
HTML~~>https://docs.google.com/leaf?id=0BxxKzvQ2GlM8MmNiN2VmMTgtMzYyNC00ZWY3LTg2Y2UtOTJmOGViOGEyNzg1&sort=name&layout=list&num=50
Posted by: MDunleavy Nov 28, 2011, 08:13 AM
*Our overall outlook for crude oil prices is bearish, as the outlook for global growth is worsening due to mounting concerns from Europe and the fact that major economies around the globe are still weak, and that should put negative pressure on crude oil prices.
*Traders will be awaiting the infamous jobs report from the United States on Friday, and a strong figure could boost optimism and push crude oil prices higher. [Topcommodities Net]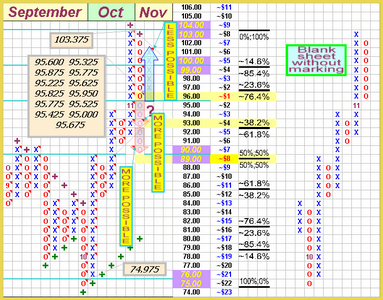
Learn more :
~~~>http://mdunleavy.byethost7.com/11Nov26.html
^^^ORvvv
~~~>http://iticsoftware.com/postimages2//201009/11Nov26.html
^^^ORvvv
https://docs.google.com/leaf?id=0BxxKzvQ2GlM8MjZhMjY4ZjAtZTA3Yi00MTZmLWJhZTQtN2ExODI3NGUxYzQz&sort=name&layout=list&num=50 (1) <~~OR~~> https://docs.google.com/leaf?id=0BxxKzvQ2GlM8NDBiYzkzOTQtNDc0MS00ZGViLWEyYjMtMzc5MjZiZGIwNDQ5&sort=name&layout=list&num=50 (2)
Posted by: MDunleavy Dec 4, 2011, 02:01 PM
CL had a positive day for the Friday session as traders continue to buy commodities in general. The market looks like it wants to attempt a breakout above the recent highs of $103 and if it does – this could be the beginning of the next massive leg up in the market. However, we expect the area to actually be more resistance than the market is ready to go up against at the moment. We are buyers, but will need to see a pullback first.
[meta4forexbroker]
https://docs.google.com/document/pub?id=1k-LK7SJO6d2Ep1R9z2ln5_GA5rSGeqp6dp2xIgiZ-1c#id.6dku2saylq6t
Posted by: MDunleavy Dec 11, 2011, 10:18 AM
...In the bigger picture, there is still no clear sign of long term trend reversal yet and price actions from 1923.7 would still be finally unfolded as correction/consolidation only. Though, the consolidation pattern would likely extend below 1923.7 for a while and rally attempt should face strong resistance near to this level. We'd anticipate another falling leg before such consolidation completes. And in such case, downside should be contained by 1478.3/1577.4 support zone...[by oilngold]
Learn more :
~~~>http://iticsoftware.com/postimages2//201009/11Dec10.html
^^^ORvvv
~~~>http://img690.imageshack.us/img690/4721/11dec10.pdf
^^^ORvvv
https://docs.google.com/leaf?id=0BxxKzvQ2GlM8Y2EwZjZkMGUtZDE2Yi00ZTY4LWIwZjItYzJhMGM2Zjg0MzFm&sort=name&layout=list&num=50
Posted by: MDunleavy Dec 18, 2011, 07:58 PM
Gold dropped to as low as 1562.5 last week before forming a temporary low there and recovered. Initial bias is neutral this week for some consolidations. But recovery should be limited below 1667.1 support turned resistance and bring another fall. Below 1562.5 will target 1535 key support and below...[by oilngold]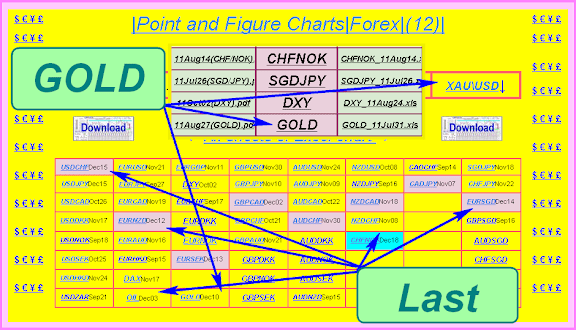
Learn more: https://docs.google.com/document/pub?id=1Y5rnn301l8-O_xROiUY15UzqwhHoCWipS6mND6YTepY; https://docs.google.com/leaf?id=0AhxKzvQ2GlM8dDBqYWl6XzlEbFZDWFVob0FMbG9nbGc&sort=name&layout=list&num=50
Posted by: Eric Dec 19, 2011, 07:17 AM
wow ! you still use point and figure charts ??? lol. you are very oldschool !!!!!!!!!!
Posted by: MDunleavy Dec 26, 2011, 08:01 AM
USD/CHF rose a bit during the Friday session as the pair continues to grind higher. The 0.93 level that was broken above recently has been very supportive over the last week, and we think this is a possible sign of things to come. The pair is being supported by the fact that the Swiss National Bank is working against the value of the Franc and this should continue to push this pair higher. Also, the Dollar is the safe haven everyone wants. Because of this, we are buying this pair overall, and especially on dips.[by forextv]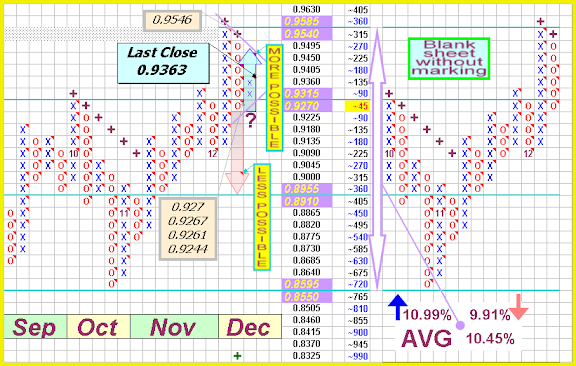
Learn more :
~~~>http://iticsoftware.com/postimages2//201009/11Dec25.html
^^^ORvvv
~~~>http://img521.imageshack.us/img521/929/11dec25.pdf
^^^ORvvv
https://docs.google.com/leaf?id=0BxxKzvQ2GlM8YjZlZjI0NDktNmYyZS00Yjk2LWJhOTMtY2Y4ZWIwYzgzMjEz&sort=name&layout=list&num=50
Posted by: MDunleavy Jan 2, 2012, 09:44 AM
*Forexpros – The U.S. dollar dipped against the Swiss franc in subdued trade on Friday, trimming some of the week’s gains as sustained concerns over the debt crisis in the euro zone supported safe haven demand.
*USD/CHF hit 0.9469 on Thursday, the pair’s highest since December 15; the pair subsequently consolidated at 0.9384 by close of trade on Friday, shedding 0.19% over the week.
*The pair is likely to find support at 0.9266, the low of December 20 and resistance at 0.9477, the high of December 13.
*Trading volumes remained low seeing as many traders closed books to lock in profit before the end of the year, reducing liquidity in the market and increasing volatility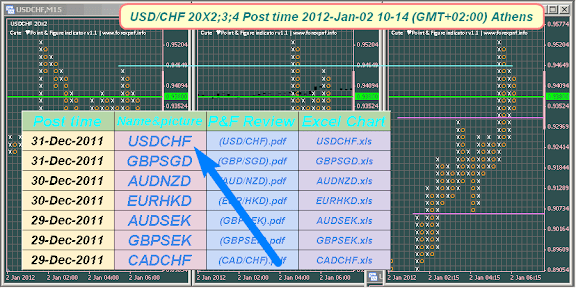
https://docs.google.com/leaf?id=0AhxKzvQ2GlM8dDBqYWl6XzlEbFZDWFVob0FMbG9nbGc&sort=name&layout=list&num=50
Posted by: MDunleavy Jan 9, 2012, 07:13 AM
Forexpros - The Euro was lower against the U.S. Dollar on Sunday. EUR/USD was trading at 1.2677, down 0.33% at time of writing. The pair was likely to find support at 1.2667, today's low, and resistance at 1.3077, Tuesday's high. Meanwhile, the Euro was down against the British Pound and the Japanese Yen, with EUR/GBP shedding 0.26% to hit 0.8224 and EUR/JPY falling 0.42% to hit 97.47.
Learn more :
~~~>http://iticsoftware.com/postimages2//201009/12Jan08.html
^^^ORvvv
~~~>http://img819.imageshack.us/img819/3411/12jan09.pdf
^^^ORvvv
https://docs.google.com/leaf?id=0BxxKzvQ2GlM8ZDVmNTliNTUtMjcyNC00ZDg5LWI3YjYtOTcxYzYwYWY0ZTUw&sort=name&layout=list&num=50
Posted by: MDunleavy Jan 15, 2012, 07:59 AM
EUR/USD rose during the Thursday session as traders celebrated successful bond auctions in both Italy and Spain. However, the recent downtrend is certainly intact, and it is hard to think that it suddenly will give way based upon these two sales. The 1.30 level above is the start of significant resistance, and we are looking to sell weakness in that area if it appears. The candle does suggest some possible follow through over the next day or two, but we aren’t willing to won the Euro in general and there are simply far too many problems in that part of the world right now. We are selling rallies going forward.[by forex-download]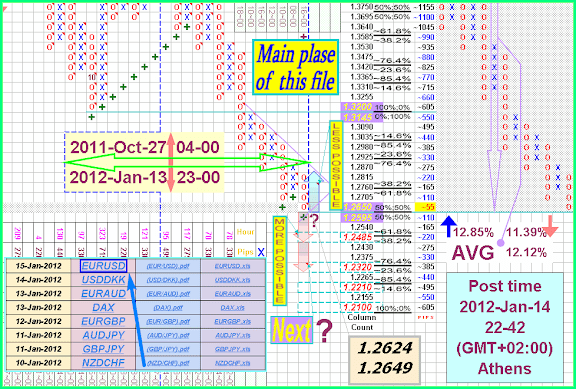
Learn more :http://iticsoftware.com/postimages2//201009/12Jan08.html;http://img37.imageshack.us/img37/1048/12jan14.pdf
^^^ORvvv
https://docs.google.com/document/pub?id=1Y5rnn301l8-O_xROiUY15UzqwhHoCWipS6mND6YTepY#id.dlcmsqbsh50f (1) <~~OR~~> https://docs.google.com/leaf?id=0AhxKzvQ2GlM8dDBqYWl6XzlEbFZDWFVob0FMbG9nbGc&sort=name&layout=list&num=50 (2)
Posted by: MDunleavy Jan 25, 2012, 07:29 AM
GBP/USD rose again on Monday as traders continue to sell off the US dollar in general. The Pound did well against the Greenback, but only marginally so. The rise was somewhat tempered by the 1.56 level, and we saw the pair pullback a bit. We are still bearish of this market overall, but think that a rise to test 1.57 again is very possible at this point.
Learn more :
~~~>http://iticsoftware.com/postimages2//201009/12Jan24.html
^^^ORvvv
~~~>http://fforeman.byethost17.com/12Jan24.html
^^^ORvvv
https://docs.google.com/leaf?id=0BxxKzvQ2GlM8ZGE3OWYxNTUtYmY5Mi00YWMzLWFkMmYtMDEwODRlMDI1N2Yw&sort=name&layout=list&num=50 (1) <~~OR~~> https://docs.google.com/leaf?id=0BxxKzvQ2GlM8YzZjYTc3NGEtZDYzOS00ZTQwLWFmNTQtOGI4NWEyZDhkODU0&sort=name&layout=list&num=50t (2)
Posted by: MDunleavy Jan 30, 2012, 08:28 AM
*The British pound had another stellar week, climbing almost 200 pips against the US dollar, and breaking the 1.57 level. The upcoming week has seven releases, including GDP. Here is an outlook for the upcoming events, and an updated technical analysis for GBP/USD.
*The dollar weakened against most major currencies following Bernanke’s announcement that interest rates will likely remain near zero until late 2014. This was despite solid economic data coming out of the US.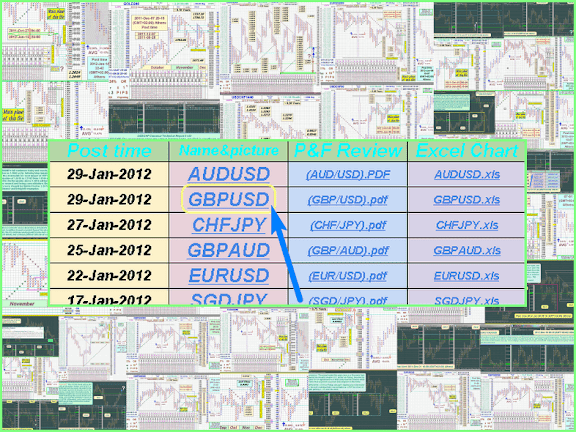
Learn more :
https://docs.google.com/leaf?id=0AhxKzvQ2GlM8dDBqYWl6XzlEbFZDWFVob0FMbG9nbGc&sort=name&layout=list&num=50 (1) <~~OR~~> https://docs.google.com/document/pub?id=1Y5rnn301l8-O_xROiUY15UzqwhHoCWipS6mND6YTepY#id.iyuqgm7e6wl4 (2)
Posted by: MDunleavy Feb 9, 2012, 08:00 PM
USD: From its lowest levels since early December of just below 78.50, the DXY index rallied as risk sentiment turned less hospitable. Even so, the DXY index remains below its 100-dma at 78.749.
Learn more :
~~~>http://fforeman.byethost17.com/12Feb08.html
^^^ORvvv
~~~>http://iticsoftware.com/postimages2//201009/12Feb08.html
^^^ORvvv
https://docs.google.com/leaf?id=0BxxKzvQ2GlM8NGU4NjkxNmMtY2VmNC00Y2FkLWE2YTYtZDY2ZjhmZmY1YjQ5&sort=name&layout=list&num=50
Posted by: MDunleavy Feb 20, 2012, 09:05 AM
The dollar has risen versus its major currency counterparts despite a late week downside correction; this came after the heavily weighted EUR/USD currency pair rallied almost 200 pips on Thursday along with cable and other majors...[by forex-fx-4x]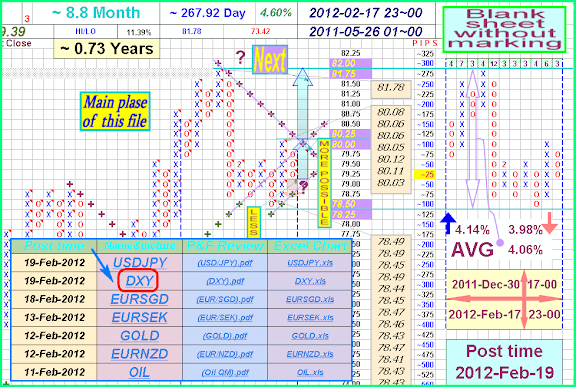
Learn more :
~~~>https://docs.google.com/leaf?id=0AhxKzvQ2GlM8dDBqYWl6XzlEbFZDWFVob0FMbG9nbGc&sort=name&layout=list&num=50
^^^ORvvv
~~~>https://docs.google.com/document/pub?id=1Y5rnn301l8-O_xROiUY15UzqwhHoCWipS6mND6YTepY
Posted by: MDunleavy Mar 4, 2012, 03:05 PM
On DXY if we get a pullback next week toward 78.50-ish we'd have a very mini head and shoulders bottom that could then manage to get up through this downtrend line/resistance. If I am wrong on this I think it's that we cross the downtrend line, head toward the spike near 80 and then pullback to retest the downtrend line. Either way I continue to think the dollar moves higher for now.[By Real Money Pro]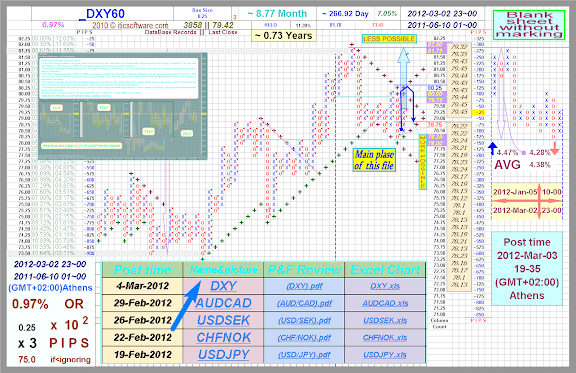
Learn more :
~~~>https://docs.google.com/open?id=0BxxKzvQ2GlM8ZWJmZDFjNTgtNGRmOC00MmI2LWEzODItZWE1NzNmOGQ5YWI1
^^^ORvvv
~~~>http://img252.imageshack.us/img252/3377/12mar04.pdf
^^^ORvvv
https://docs.google.com/open?id=0BxxKzvQ2GlM8YTA1NTIwYWQtMDc1Ni00NTE5LTk4NzUtMWNjZWY4NjVjOTc4
Posted by: MDunleavy Mar 19, 2012, 01:05 PM
Heard they’re behind the sharper fall just now from around 0.8260 to recent day’s lows of 0.8235. There is talk of sell stops now poised on a break of 0.8230 ahead of more bids at 0.8200/10 and sell stops on a break down of o.8200.[ by forexlive]
Learn more :
~~~>http://img819.imageshack.us/img819/2316/12mar19.pdf
^^^ORvvv
~~~>https://docs.google.com/open?id=0BxxKzvQ2GlM8YjczZWY4ZTQtOTJiYS00Y2IxLTllZGItNjU4YjM1NTM2NjY2
Posted by: MDunleavy Mar 25, 2012, 07:49 PM
Much has been said about the 'obvious' H&S formation on the Daily chart. While I recognize this, I believe that said formation is failing with late week price action for which I am continuing longing even before the dreaded 1.3300. Again, there seems to be an inverted H&S on the H4 which pits it to the bulls. Break above Friday high would be above the neckline of said inversion and we should see some bullish action there off.[By forex4noobs]
https://lh5.googleusercontent.com/-aCrGJkFSZUk/T29djgoHnCI/AAAAAAAAAQo/YG7TF1WQy-c/s982/1.png
Learn more :
~~~>https://docs.google.com/open?id=0BxxKzvQ2GlM8ZmRlMjViOTMtNjAyMS00NzUxLWFjMjEtODk0ZjFlNzg5YzQ5
^^^ORvvv
~~~>http://img832.imageshack.us/img832/5033/12mar25.pdf
^^^ORvvv
~~~>https://docs.google.com/document/pub?id=1Y5rnn301l8-O_xROiUY15UzqwhHoCWipS6mND6YTepY#id.4lkg9t4ejr1o
Posted by: MDunleavy Apr 9, 2012, 06:22 PM
Over the last six months gains above 1.6000 have been limited and have attracted heavy selling. Sterling has fallen two big figures from this week’s high with the help of the QE3 postponement in the US. This weakness has caused the rate to fall back beneath the 100 day moving average at 1.5831. Strong US jobs data for March would undermine the rate further.
[by livetradingnews]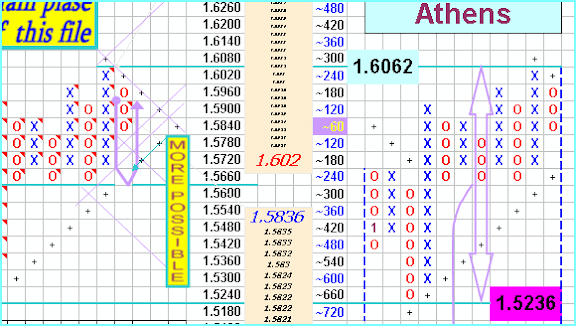
Learn more :
~~~>http://img38.imageshack.us/img38/4254/12apr09.pdf
^^^ORvvv
~~~>https://docs.google.com/open?id=0BxxKzvQ2GlM8YzZjYTc3NGEtZDYzOS00ZTQwLWFmNTQtOGI4NWEyZDhkODU0
^^^ORvvv
https://docs.google.com/open?id=0BxxKzvQ2GlM8QTAybzBFc05Rb21saUZRN1NvUXJUUQ
Posted by: MDunleavy Apr 27, 2012, 09:12 PM
AUDUSD is in consolidation mode between 1.0245 and 1.0452 after taking out falling trend line resistance set from late February. We do not see an actionable trade setup here for now and will wait for the pair to offer greater directional conviction to look for entry opportunities.27 April 2012 09:33 GMT [By dailyfx]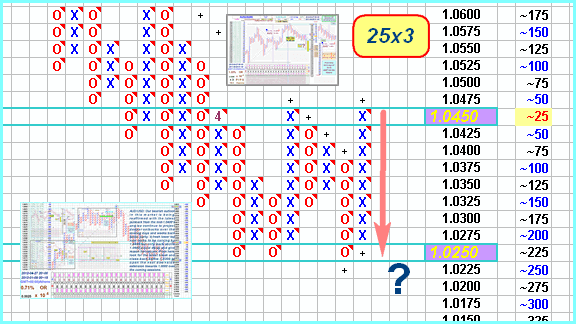
Learn more :
~~~>https://docs.google.com/open?id=0BxxKzvQ2GlM8YzEyYWE0ZDUtZjI5My00MjA3LWJkOGItYzIyZjg0NjFhMmJj
^^^ORvvv
~~~>http://img217.imageshack.us/img217/9731/12apr27.pdf
^^^ORvvv
https://docs.google.com/spreadsheet/pub?key=0AhxKzvQ2GlM8dDBqYWl6XzlEbFZDWFVob0FMbG9nbGc&output=html (1) <~~OR~~> https://docs.google.com/document/pub?id=1Y5rnn301l8-O_xROiUY15UzqwhHoCWipS6mND6YTepY (2)
Posted by: MDunleavy Aug 31, 2012, 10:51 AM
—The Australian dollar showed some movement in both directions but was almost unchanged over the week, as AUD/USD closed at 1.0399.
—Highlights of the upcoming week include Building Approvals and Private Capital Expenditure.
—The pair continues to trade in a narrow range following mixed economic releases in both the US and Australia, as the pair showed some fluctuation but was unable to sustain any breakout.
—I am neutral on AUD/USD.
—After impressive gains this summer, the aussie has been in a holding pattern for the past few weeks.
—Given the turmoil in Europe and mixed data out of the US and Australia, the choppiness could continue.
—However, if the US economy produces more weak data and there is further talk of QE intervention, look for the Australian dollar to make some gains.[Written by forexcrunch]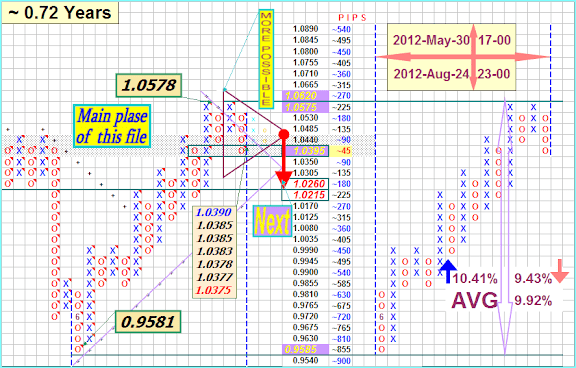
https://docs.google.com/spreadsheet/pub?key=0AhxKzvQ2GlM8dDBqYWl6XzlEbFZDWFVob0FMbG9nbGc&output=html
See also ↓↓↓
~~~>https://docs.google.com/open?id=0BxxKzvQ2GlM8YzEyYWE0ZDUtZjI5My00MjA3LWJkOGItYzIyZjg0NjFhMmJj
^^^ORvvv
~~~>http://img99.imageshack.us/img99/5194/12aug27.pdf
A d d i t i o n a l l y ↑↑↑
Posted by: MDunleavy Sep 9, 2012, 08:35 AM
–Euro/dollar had a positive week, riding on the determination of the ECB in using its firepower to counter the Spanish crisis.
–The upcoming week is even more important, with the German constitutional court’s ruling needed to enable the bailouts.
–There are quite a few additional regular indicators and special events.
–Will the rally continue?.
–I am neutral on EUR/USD.
–After the huge rally that sent the pair to the highest levels since May, there is room for some correction.
–The rise came on a better than expected ECB decision, and high hopes for QE3 in the US.
–These hopes could lead to a disappointment, countering the big steps that Europe is taking to counter the crisis.
–Written by Forexcrunch.
https://docs.google.com/spreadsheet/pub?key=0AhxKzvQ2GlM8dDBqYWl6XzlEbFZDWFVob0FMbG9nbGc&output=html
See also ↓↓↓
~~~>http://img684.imageshack.us/img684/9896/12sep08.pdf
^^^ORvvv
~~~>https://docs.google.com/file/d/0B9cvIxidsTjvSVVYaWM5N2dYQ1k/preview
A d d i t i o n a l l y ↑↑↑
Posted by: MDunleavy Sep 23, 2012, 07:52 PM
–The GBP/USD pair rose during the session on Friday and even managed to break through the 1.63 level at one point.
–However, by the end of the day we saw a pullback that formed a shooting star.
–This pair has been overbought for a while, and as such a pullback would be welcomed by many of the buyers at this point.
–We still see the 1.60 level was massively supportive at this point time, and hope that a pullback is a chance to start buying this market somewhere closer to that level.
–However, we managed to break the top of the shooting star from Friday, then of course is a massively bullish signal as well.
–Even if we do see a breakdown of price over the next day or two, we are not interested in selling as the central bank equation of this currency pair is pretty straightforward: the Federal Reserve is looking to expand its quantitative easing, and the Bank of England is looking to sit still with its rates.
–Because of this, there is a positive swapped going long this pair. [Written by fxempire]
https://docs.google.com/spreadsheet/pub?key=0AhxKzvQ2GlM8dDBqYWl6XzlEbFZDWFVob0FMbG9nbGc&output=html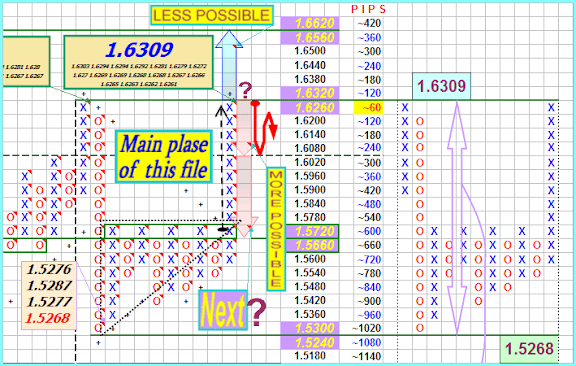
See also
~~~> https://docs.google.com/file/d/0B9cvIxidsTjvSGdHNEQwMDY5LTQ/preview
↑↑↑ OR ↓↓↓
~~~> http://img525.imageshack.us/img525/354/12sep23.pdf
A d d i t i o n a l l y
Posted by: MDunleavy Oct 7, 2012, 05:53 PM
–USDCHF: With USDCHF reversing almost all of its corrective recovery gains the past week, the big risk is for it to return to the 0.9238 level.
–If this occurs in the new week, further declines will shape up towards the 0.9193 level, its May 07’2012 low with breach targeting the 0.9100 level and ultimately the 0.9000 level, its big psycho level.
–Its weekly RSI is bearish and pointing lower supporting this view.
–On the upside, it will have to return above the 0.
–9424 level to annul its current weakness and resume its bullish offensive towards its Sept 10'2012 high at 0.9482.
–A breach will open up further upside gain towards the 0.9606 level.
On the whole, the pair remains biased to the downside in the short term.
[Written by traderslaboratory]
https://docs.google.com/spreadsheet/pub?key=0AhxKzvQ2GlM8dDBqYWl6XzlEbFZDWFVob0FMbG9nbGc&output=html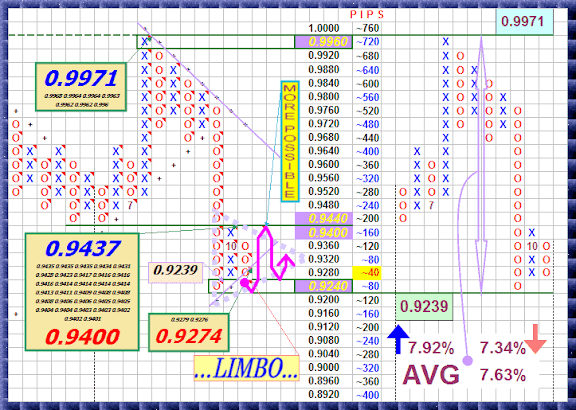
See also
~~~> https://docs.google.com/open?id=0B9cvIxidsTjvRzZvZ1pFS1N1ZGs
↓↓↓ ORvvv ↑↑↑
~~~> http://img15.imageshack.us/img15/8383/12oct06.pdf
A d d i t i o n a l l y
Posted by: MDunleavy Oct 21, 2012, 07:52 PM
–Gold Prices Range bound till New Effective Triggers are seen:
–Gold traders now look ahead to next week and movements in gold prices will be taking cues from the FOMC interest rate decision on Wednesday and Q3 GDP data on Friday.
–It is highly unlikely for the Fed to change its QE3 decision in the October 2 day FOMC meeting, which concludes Wednesday.
–Although the central bank is not expected to alter its policy stance, investors will be closely eyeing the accompanying statement for an updated assessment of the domestic economy.
–If the Fed adds concerns about inflation and rising prices, gold prices will remain well supported as investors flock into gold bullion as a traditional hedge against inflationary pressures.
–The Fed may also keep focus on what to do when Operation Twist ends in December.
[Written forexpros]
~~~~~~~~~~~~~~~~~~~~~~~~~~~~
https://docs.google.com/spreadsheet/pub?key=0AhxKzvQ2GlM8dDBqYWl6XzlEbFZDWFVob0FMbG9nbGc&output=html 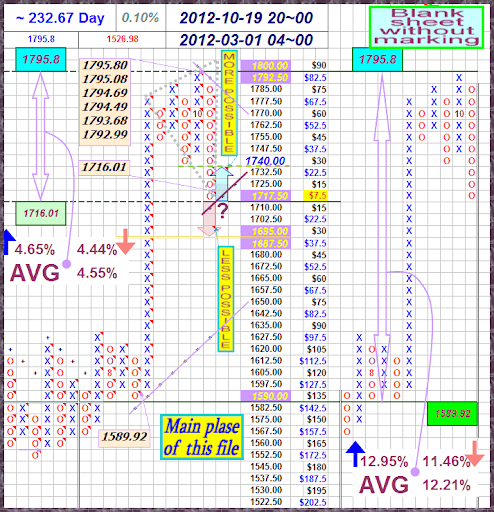
See also
~~~> https://docs.google.com/file/d/0BxxKzvQ2GlM8MUVRNkxibXlpSms/preview
↑↑↑ OR ↓↓↓
~~~> http://img443.imageshack.us/img443/8240/12oct21.pdf
A d d i t i o n a l l y
Posted by: MDunleavy Oct 27, 2012, 04:02 PM
–The AUD/USD pair initially fell during the week, but found a bit of a bid later on and formed a hammer.
–This is right after to shooting stars, and is in the middle of a massive consolidation area.
–We figure that this pair will be very difficult to trade, although it does look bullish at the moment.
–As for a longer-term point of view, the Reserve Bank of Australia is slated to cut rates at least once if not twice.
–This should weigh upon the Australian dollar going forward, as well as all the global risks out there.
–However, it appears that as far as longer-term trader concerned, we need to break above the 1.06 level to have complete clarity higher.
–If we managed to break down below the 1.0150 level however, we figure that this pair will absolutely crumble.
[Written by fxempire]
https://docs.google.com/spreadsheet/pub?key=0AhxKzvQ2GlM8dDBqYWl6XzlEbFZDWFVob0FMbG9nbGc&output=html
See also
~~~> https://docs.google.com/file/d/0B9cvIxidsTjvZFVnNDZGTjJ3ZXM/preview
↑↑↑ OR ↓↓↓
~~~> http://img402.imageshack.us/img402/7477/12oct27.pdf
A d d i t i o n a l l y
Posted by: MDunleavy Nov 10, 2012, 07:56 PM
EURUSD Analysis 10th November 2012 – P&F Update...
https://docs.google.com/spreadsheet/pub?key=0AhxKzvQ2GlM8dDBqYWl6XzlEbFZDWFVob0FMbG9nbGc&output=html
See also
~~~> https://docs.google.com/file/d/0BxxKzvQ2GlM8ZmRlMjViOTMtNjAyMS00NzUxLWFjMjEtODk0ZjFlNzg5YzQ5/preview
vvv ORvvv ^^^
~~~> http://img7.imageshack.us/img7/3057/12nov10.pdf
A d d i t i o n a l l y
||BJF Trading Group||Expert Advisor||MT Indicator||Forex Software||MQL4 Coding||
Posted by: MDunleavy Nov 18, 2012, 03:38 PM
•The dollar index continues to remain firmly bullish on the daily chart, moving higher and breaking above the 81 region, as the currency of first reserve continues to strengthen following the U.S. election.
•This firm move higher for the U.S. dollar has been accompanied by sustained buying volume on both the daily and the three day chart, which have both provided additional momentum to the move higher, following the key breakout from the sideways congestion created during September and October, which saw the index trade in a narrow range.
•This platform of support is now providing the necessary springboard, and with the Hawkeye Heatmap now firmly green, the U.S. dollar looks set to continue higher in the short to medium term.
•Should the three day trend also transition through to bullish in due course, then we can expect to see the index climb to test the 83.00 region and beyond with consequent weakness across the major currency pairs, along with commodities. [Written by forexpros]
↓↓↓ Click to learn more! ↓↓↓
https://docs.google.com/spreadsheet/pub?key=0AhxKzvQ2GlM8dDBqYWl6XzlEbFZDWFVob0FMbG9nbGc&output=html
See also
~~~> https://docs.google.com/file/d/0B9cvIxidsTjvYnFHMWVmM25oVlk/preview
↑↑↑ OR ↓↓↓
~~~> http://img822.imageshack.us/img822/5085/12nov18.pdf
A d d i t i o n a l l y
||BJF Trading Group||Expert Advisor||MT Indicator||Forex Software||MQL4 Coding||
Posted by: MDunleavy Nov 26, 2012, 09:24 AM
Crude Oil Weekly Technical Outlook
•Sat Nov 24 12 09:51 ET Crude Oil Weekly Technical Outlook Nymex Crude Oil (CL)Crude oil edged higher to 89.98 last week but failed to take out 90 psychological level and retreated again.
•Nonetheless, note that firstly, it's has taken out near term falling channel.
•Secondly, it seems to be well supported by 4 hours 55 EMA.
•Thirdly, daily MACD is staying well above signal line.
•The development argues that fall from 100.42 might be completed at 84.05 already.
•Further rise will be mildly in favor as long as 86.17 minor support holds.
•Strong rally would be seen to 93.66 resistance to confirm the bullish case.
•Though, below 86.17 will flip bias back to the downside for another low below 84.05.
[Written by oilngold]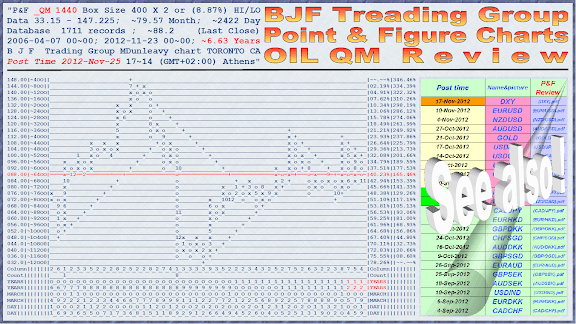
https://docs.google.com/spreadsheet/pub?key=0AhxKzvQ2GlM8dDBqYWl6XzlEbFZDWFVob0FMbG9nbGc&output=html
See also
~~~> https://docs.google.com/file/d/0BxxKzvQ2GlM8MjZhMjY4ZjAtZTA3Yi00MTZmLWJhZTQtN2ExODI3NGUxYzQz/preview
↑↑↑ OR ↓↓↓
~~~> http://img547.imageshack.us/img547/2082/12nov26.pdf
A d d i t i o n a l l y
||BJF Trading Group||Expert Advisor||MT Indicator||Forex Software||MQL4 Coding||
Posted by: MDunleavy Dec 9, 2012, 06:54 AM
—The GBP/USD fell friday to trade at 1.6010 after the Bank of England yesterday held rates and policy.
—Today, industrial production and manufacturing production both disappointed markets reporting well below forecast, casting a greater doubt on the UK economy.
—Just a few days ago, the UK downgraded growth for 2013 and Chancellor Osborne, presented the Autumn statement with a negative forecast. [Written by forextv]
~~~> https://docs.google.com/spreadsheet/pub?key=0AhxKzvQ2GlM8dDBqYWl6XzlEbFZDWFVob0FMbG9nbGc&output=html
See also
~~~> http://goo.gl/acRBE
↑↑↑ OR ↓↓↓
~~~> http://img402.imageshack.us/img402/2061/12dec08.pdf
A d d i t i o n a l l y
Posted by: MDunleavy Dec 16, 2012, 04:14 PM
—USDCHF Analysis - December 15, 2012
—USDCHF breaks below 0.9214 support, suggesting that the downtrend from 0.9971 has resumed.
—Further decline could be expected next week, and next target would be at 0.9000 area.
—Resistance levels are at 0.9300 and 0.9400, as long as these levels hold, the downtrend from 0.9511 will continue.
—For long term analysis, USDCHF had formed a cycle top at 0.9971 on weekly chart.
—Further decline to 0.8500 area would likely be seen over the next several months.[Written by ForexCycle] 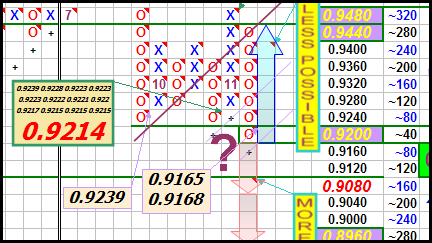
~~~> https://docs.google.com/spreadsheet/pub?key=0AhxKzvQ2GlM8dDBqYWl6XzlEbFZDWFVob0FMbG9nbGc&output=html
See also
~~~> http://goo.gl/EMVCX
^^^ OR vvv
~~~> http://img35.imageshack.us/img35/9255/12dec16.pdf
A d d i t i o n a l l y
||BJF Trading Group||Expert Advisor||MT Indicator||Forex Software||MQL4 Coding||
Posted by: MDunleavy Dec 29, 2012, 06:58 PM
—USDJPY Analysis - December 29, 2012
—USDJPY's upward movement from 77.14 extends to as high as 86.63.
—Further rise could be expected after consolidation, and next target would be at 88.00 area.
—Support is at 85.50 followed by 84.50, as long as these levels hold, the uptrend will continue.
—For long term analysis, USDJPY had formed a cycle bottom at 77.14 on weekly chart.
—Further rise to 90.00 area is possible over the next several weeks. [ Written by ForexCycle]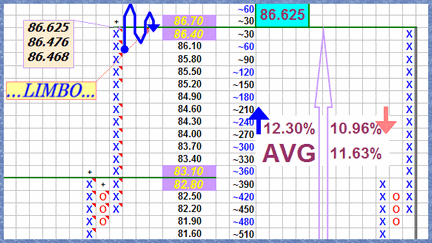
~~~> https://docs.google.com/spreadsheet/pub?key=0AhxKzvQ2GlM8dDBqYWl6XzlEbFZDWFVob0FMbG9nbGc&output=html
See also
~~~> http://goo.gl/lZCUV
^^^ OR vvv
~~~> http://goo.gl/j3V7n
A d d i t i o n a l l y
||BJF Trading Group||Expert Advisor||MT Indicator||Forex Software||MQL4 Coding||
Posted by: Mani_786 Nov 18, 2013, 08:34 PM
*At time of writing, AUD/USD is quoted in the 1.0290 zone, around 10 pips above Friday's closing price. If the pair continues its decline in the session ahead, support levels lie at 1.0270, 1.0230 and 1.0180. To the upside, resistance levels lie at 1.0360, 1.0400 and 1.0440.
CLICK HERE for detail information...
~~~>http://mdunleavy.byethost7.com/11Nov13.html
^^^ OR vvv
~~~>http://iticsoftware.com/postimages2//201009/11Nov13.html
^^^ OR vvv
A t t a c h m e n t
^^^ OR vvv
HTML~~>https://docs.google.com/leaf?id=0BxxKzvQ2GlM8MmNiN2VmMTgtMzYyNC00ZWY3LTg2Y2UtOTJmOGViOGEyNzg1&sort=name&layout=list&num=50
EUR/USD rose a bit during the Friday session as the pair continues to grind higher. The 0.93 level that was broken above recently has been very supportive over the last week, and we think this is a possible sign of things to come. The pair is being supported by the fact that the Swiss National Bank is working against the value of the Franc and this should continue to push this pair higher. Also, the Dollar is the safe haven everyone wants. Because of this, we are buying this pair overall, and especially on dips.
Posted by: sree6020 Nov 22, 2013, 06:40 PM
the mass deflection in nifties would affect US economy
Posted by: Elsamty Apr 18, 2016, 09:43 AM
USD/JPY closed higher due to loss taking on Monday as it consolidated some of last week's decline. The high-range close sets the stage for a steady to higher opening on Tuesday. Stochastics and the RSI are oversold but remain neutral to bearish signalling that sideways to lower prices are possible near-term. If it extends last week's decline, the reaction low crossing is the next downside target. Closes above last Wednesday's high crossing would temper the near-term friendly outlook
Powered by Invision Power Board (http://www.invisionboard.com)
© Invision Power Services (http://www.invisionpower.com)